By Gill Grieshaber, CET
Although similar to "Reports from the Test Lab" this feature is longer and more detailed due to the many functions of the VA-48. Results of tests and tips on using the instrument are included.
The phrase "TV-VTR-MATV & Video Analyzer" that appears on the Sencore VA-48 panel does not completely describe this versatile item of test equipment. The following is an incomplete list of signals and functions of the VA-48:
- color-bar generator
- dot-crosshatch generator
- tuner substitute
- alignment generator
- peak-to-peak voltmeter to 1000V
- peak and null dc meter
- variable do voltage for bias or B+ substitute
- Ringer tester of flybacks and yokes
- controlled-amplitude source of all major injection signals for testing, color TV receivers
- 5-frequency "Bar Sweep" pattern for measuring response up to 3.56 MHz
- 3-frequency "Chroma Bar Sweep" for chroma response at center and both edge frequencies
- a standard 1VPP (at 75 n load) video signal that's properly clamped with zero Vdc at the negative-going sync tips.
Obviously, many explanations are required for the multitude of items listed. But one point not made clear by the list of separate functions and signals is that all output signals are phase locked. For example, an RF carrier with video modulation can be injected at the antenna terminals or in the IFs to provide a raster picture, while It the same time a keying pulse (of same phase) can be used to test an AGC circuit. The value of phase-locked signals will not be appreciated properly until after the feature is used in actual servicing.

----------- Sencore-VA-48
"Channels" and "Video Pattern"
In the upper left corner of the front panel is the channel selector knob, which can be turned to any VHF channel (2 through 13) or a choice of six UHF channels (Figure 1). Also, two UHF positions can be retuned by a small screwdriver to any desired local channel. A hole in the panel near the UHF channel-15 mark allows access to the trimmer pot. Another hole near the channel 60 UHF mark permits that channel to be retuned. A "4.5MHz Crystal" switch adds that carrier when needed.
Modulation for the RF carrier selected by the channel switch is determined by the "Video Pattern" switch (Figure 1). Seven patterns are available: a single cross, a single dot, a full cross-hatch, all dots, conventional color bars with black bars between, bar sweep and chroma bar sweep. The two sweeps will be explained later.
So far the description is similar to a deluxe color/bar pattern generator. But the VA-48 has many other features.
Below the channel selector is another switch marked "RF-IF Signals," which has one position for UHF channels and another for VHF channels. Signals from this switch go to the "RF-IF Level" control (Figure 1B) for calibrated attenuation, and then exit at the "RF-IF Output" jacks. These signals go to the TV antenna terminals.
RF-IF Signals selector
The "RF-IF Signals" switch also selects one of three kinds of IF signals. First is the "Tuner Sub" position that provides a modulated picture-IF signal having a level of 5mV (this is the same amplitude as the VHF and UHF signals, and it matches calibrations of the level control). The signal can be injected at the UHF jack on the VHF tuner or at the input of the first IF tube or transistor.
Next position of the RF-IF switch is marked "2nd IF Input" that gives the same signal as before except at a 50mV maximum level.
The "3rd IF Input' position increases the level to 500mV. Comments-Signal-injection tests in the picture IF stages can be very helpful when done properly. Usually, the VA-48 is adjusted for the third IF input position of the signals selector and the probe is connected to the input of the third IF stage. (Both the VA-48 and the 300 ohm balun supplied with it have capacitor coupling so additional isolation is not required when connecting to a circuit.) If the video signal is normal (as viewed on picture tube or test scope), the generator is changed to the second IF position and connected to the input of the second IF. After a favorable test result there, the generator is set to the tuner sub position and connected to the input of the first IF stage. During this sequence, the first stage that shows a weak signal (or whatever the original symptom was) is the one with the defect. This identification of the bad stage is a tremendous help during servicing.
Figure 2 shows both the crosshatch pattern on the TV screen during a test of the IF signal injection feature and the video scope waveform when the bar sweep pattern was used. A good sharp crosshatch pattern and strong color bars were obtained when the signal was injected at the input of each IF stage. The level control adjustment was helpful in obtaining the best appearance of the picture.
"Bar-Sweep" and "Chroma Bar Sweep"
These next two waveforms can be selected by the video-pattern switch so one or the other modulates the RF or IF carrier for injection tests.
Or either pattern can be selected by the drive-signal switch and appear as adjustable-level video at the drive-output jack (described later) for injection in video or other stages.
Both signals are unique, and they deserve an accurate description. As pictured in Figure 3, the bar-sweep signal has five switches to add or delete specific frequency bursts from the waveform. A drawing above the switches shows the location of each waveform area on a TV picture, along with a drawing of the corresponding scope waveform inserted at the center of the raster.
If any of the five switches is moved to the out (or off) position, that burst disappears from the raster or scope.
Figure 3B is a closeup picture of the bar sweep drawing on the VA-48 panel. The drawing is helpful, but not totally realistic. Examples of real pictures and scope waveforms will be given later.
When a full-bandwidth bar-sweep pattern is viewed on a scope, all five bursts (single bar 0.188MHz, 0.75MHz, 1.51MHz, 3.02MHz and 3.56MHz) should have the same amplitude without any tilt. Less amplitude of any burst indicates a loss of gain at that frequency. Also, the amplitude between each "step" of the black, gray and white bars should be equal. Refer to the instruction book for the significance of this test.
On the picture tube, four frequency bursts should appear to have the same intensity (Figure 4). Most important are the 3.02MHz and 3.56MHz bars. Incidentally, when the bar-sweep pattern is scoped at the video detector of a TV, it would seem logical for the 3.56MHz burst amplitude to be only half of the others, because that frequency usually is at the 50% point of the IF alignment curve.
However, Sencore compensated by increasing the amplitude in the generator before modulation so all burst amplitudes should be equal after detection in the receiver. (It is not necessary to compensate the 3.56MHz bar in the VTR standard or video from the drive circuit.) Testing with bar sweep-Several receivers were tested for IF bandwidth by observing the bar sweep patterns on the picture tubes and scoping the video-detector waveforms.
Evidently, video-amplifier response of the Figure 4 receiver was rolled off more than most, because the video-detector waveform showed excessive level of high frequencies (Figure 4B) but the raster picture was textbook perfect. For that model color TV, those results apparently are normal.
The picture and waveform of Figure 5 were taken from an old tube-type color TV that was badly out of alignment. Both the raster picture and the scoped detector waveform showed poor frequency response.

Figure 1---RF and IF signals for signal injection tests of TVs are regulated
by these controls.

Figure 2 (A) A good quality crosshatch pattern was obtained when injecting
the IF test signal at three points in the picture IFs. (B) Top scope
trace is the bar sweep pattern taken from the drive-signals circuit.
Bottom trace shows the same pattern at the TV video detector after the
carrier was Injected In the IFs.
The uneven frequency response and some overshoot probably are' typical of injection that goes through only a part of the IF circuit.

Figure 3 Five burst frequencies of the "Bar Sweep" pattern
can be turned on or off by pushbuttons. (A) Drawings on VA-48 panel show
the approximate raster picture and scope waveform obtained from the complete
bar sweep. The "Chroma Bar Sweep" is treated the same, except
only three pushbuttons are required. (B) This closeup of the bar sweep
drawing shows the five video frequencies and corresponding five picture-IF
frequencies selected by the buttons.

Figure 4 (A) Flat frequency response to 3.56MHz is indicated by this
TV picture of the bar-sweep pattern. Consider it as normal response to
the pattern when injected at the TV antenna terminals. (B) Scope trace
at the top shows the bar-sweep waveform from the "VTR Standard" output.
Slightly less than one horizontal line is shown. Bottom scope trace is
the bar-sweep pattern obtained at the video detector. This trace was
taken from the same normal TV that showed the excellent raster picture
in A. Therefore, the IFs evidently were peaked to give higher amplitude
at the high frequencies, which then were reduced in the video amplifiers
before reaching the picture tube.

Figure 5--An RF carrier with bar-sweep modulation was injected at the
TV antenna terminals. (A) The TV picture had only fair quality with reduced
3.02MHz and 3.56MHz response and some visible ringing. (B) Top scope
trace is the original bar-sweep pattern at the drive-signals output.
The bottom trace is the same pattern at the video detector of this old
receiver that had poor picture-IF alignment.

Figure 6--The bottom scope waveform shows the bar-sweep waveform when
the 3.02MHz burst was missing or greatly attenuated. Waveform of the
bar-sweep pattern taken from the drive-signals circuit is shown above
for comparison.

Figure 7---This TV picture shows near-normal response to the "Chrome
Bar Sweep" signal. The broad center bar is blue, and the two side
bars have audio-modulation lines. These outside bars should have the
same brightness, if the overall alignment and response are satisfactory.

Figure 8---The top scope trace is the chroma-bar sweep signal at the
drive-signals output. Below are the poor-quality chroma bars at the demodulator
Input. Incorrect alignment has reduced the 4.08MHz bar (at the right)
to almost zero amplitude.
Figure 6 waveforms show a missing 3.02MHz bar. This can occur if a sound trap is incorrectly adjusted. Of course, any or all of the five bursts can be switched in or out as desired. Such flexibility is needed if a receiver defect has distorted the bar sweep pattern.
No color burst is placed on the blanking bars back porch. However, the 3.56MHz bar has the same frequency as that used for color bars. This allows accurate adjustment of the TV color oscillator.
First, the color killer is defeated, which brings barber-pole stripes of color in the 3.56MHz bar-sweep bar. Next, the color oscillator is adjusted for zero beat. Afterwards, the killer must be reset.
Testing with chroma bar sweep
Only three broad bars should be seen on the TV screen when the chroma bar sweep is selected by the video-pattern switch. Of course, any or all of the 3.08MHz, 3.56MHz and 4.08MHz color-bar signals can be switched in or out as desired.
These frequencies modulate the picture carrier, and they travel through the receiver IFs and chroma section in the same way as the familiar keyed-rainbow bars.
However, only the center bar has a color (blue) in the TV picture, while the other bars have phase-locked sine-wave modulation (see Figure 7 for correct response in a monochrome picture, or the cover of the May 1979 issue of ES for the same chroma bar sweep in color). Both the 3.08MHz chroma bar (at the left) and the 4.08MHz bar at the right should have the same brightness when the chroma alignment is correct.
Figure 8 shows the chroma bar sweep pattern from the generator versus the video detector scope waveform when the color receiver had poor picture IF alignment that greatly attenuated the 4.08MHz bar signal.
Aligning with both bar sweeps
The Sencore operating book for the VA-48 (and other Sencore literature) gives detailed instructions for aligning both the picture IFs and the chroma stages. For trap adjustments, the RF-IF signals switch selected 39.75MHz (adjacent video), 41.24MHz (sound) or 47.25MHz (adjacent sound) crystal-controlled continuous carriers that have audio modulation. Included also is a 4.5MHz sound IF carrier that is frequency modulated by a 1kHz sine wave.
Although no color TVs were available for a complete alignment by these methods, the method seems practical. One strong point is that the picture carrier is operating continuously. Therefore, no clamping of the AGC is required.
Another unique feature is that synchronous video detectors can be adjusted for minimum ringing and best amplitude linearity by interpreting the scoped video waveform.
(Synchronous detectors cannot be aligned by the usual sweep-frequency technique.) Adjustable power supply At the lower left corner of the front panel and below the RF-IF signals knob are the calibrated knob and banana output jacks for the zero to 35V variable-dc power supply that can be used either as AGC bias or as substitute for a low-voltage B+ source. Neither output jack is grounded (both float), so either positive or negative polarity of voltage can be obtained.
The knob and jacks can be seen in Figure 1B.
Rating of the supply is 1A maximum and the regulation measured about 2.5% between zero current and 150mA.
Meter
An analog meter is mounted at the panel's center. It is the readout for five peak-to-peak ac ranges between 10VPP to 1000VPP full scale. Or when the meter selector knob (Figure 9) is turned to the "signal monitor" position, the meter reads the peak-to-peak amplitude of whatever pattern is selected by the drive selector and control (described later). Meter input and common (ground) jacks are below, the meter.
Two other positions of the meter switch provide a positive or negative do voltage peak or null function. A special nonlinear scale places .1V near the left end, 1V at the center 10V at the right of the meter scale.
The nonlinear operation eliminates any need to change ranges as the voltage nears zero. Internal resistance is about 20K, therefore, the low resistance might decrease some voltage sources. This is of no consequence when the meter is used only as an indicator of minimum or maximum.
Ringing tests
Last position of the meter switch selects the ringing test, which appears to be similar to that used in the YF-33 Sencore Ringer. This function is designed specifically to test vertical yokes, horizontal yokes and flybacks for shorted turns.
These ringing tests are very easy to make. The coil to be tested is connected to the common and "Ringing Test" jacks. Next, the "Ringing Test" switch (Figure 10A) is rotated through all six positions before being returned to the one that gave the highest meter reading.
The number of rings before the decaying waveform (Figure 10B) reaches a pre-determined amplitude is read directly on the bottom meter scale. This calibrated scale is helpful for testing or matching any sweep coils of unusual characteristics.

Figure 9---The multipurpose analog meter has these functions: five ranges
of peak-to-peak ac voltage; two peak or-null do ranges; measures the
drive signals PP amplitude; and gives readings of the ringing tests.
Peak-to peak and peak/null functions enter at the "Meter Input" jack.
Above the ringing cycles calibration is the bad/good scale, which shows 10 cycles of ringing as the division between good and bad coils.
Tests on flybacks and yokes having known defects proved the ringing tests are dependable and helpful. The only limitations are those of the yokes and flybacks themselves. For example, a perfect transformer would read zero ringing cycles if even one turn was shorted in any of several windings. However, the coupling between the turns of most yokes is so slight that a number of shorted turns will reduce the reading to less than 10 cycles, but not to zero. For accurate yoke measurements (by any method), disconnect all resistors and capacitors from each pair of horizontal or vertical coils, test each coil separately and then compare the two readings. The one having shorted turns will show a lower reading.
Construction of a flyback determines the amount of coupling between turns. A shorted turn or turns in any of several windings between the ringing test leads positively will reduce the reading to zero. However, shorted turns in other separate windings might not lower the reading that much. The high-voltage doughnut coil has the least coupling to the primary winding of all flyback windings. In fact, the HV coil should be tested separately for shorted turns.
Solid-state flybacks usually require all transistors, diodes and HV triplers to be disconnected before they will ring. MS, questionable readings should be followed by tests of both the suspected flyback and a new one (before it is installed). Yoke and flyback windings should be more than 3 inches from a metal chassis or a metal bench when tested. Otherwise, the ringing cycle reading will be noticeably lower.

Figure 10 (A) When the ringing test is selected and a yoke or flyback
connected to "Common" and "Ringing Test" jacks, the "Ringing
Test" knob is rotated to the position giving the highest reading
on the meter. Generally, coils giving readings under 10 have shorted
turns, and those giving above 10 rings are alright. (B) Top scope trace
is the waveform of a flyback with a reading of 37 cycles. When the rectifier-tube
filament winding was shorted, the reading dropped to 9 cycles (shown
by lower trace).
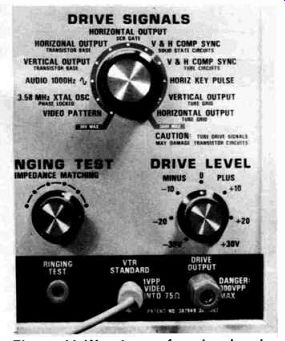
Figure 11 Waveforms for signal, substitution in sync, sweep, audio,
chroma or video are selected by the "Drive Signals" switch.
Signal amplitude and polarity both are adjusted by the "Drive Level" control.
Then the selected signal emerges from the "Drive Output" jack.
These few precautions apply only to borderline cases. Usually, the ringing test is infallible. It is a valuable addition to the VA-48.
Drive signals As mentioned before, one of the best tests is to connect an outside source of signal to various circuits in a TV and watch the picture tube for the result. Whenever a normal picture is obtained, the circuits between the injection point and the picture tube must be working alright.
The Sencore VA-48 provides a choice of 11 different waveforms as test signals under control of the "Drive Signals" switch and the "Drive Level" control (Figure 11). One extra bonus is illustrated in Figure 12: All drive signals (except the 1000Hz audio sine wave) are phase locked to the video signals (such as crosshatch, dots, color bars, bar sweep and chroma bar sweep. Figure 12 shows dual-trace (simultaneous) waveforms of color bars (above) and the tube horizontal drive (bottom trace). The color-bar signal was fed to the TV antenna terminals and the horizontal output tube . grid drive was connected to the grid of the output tube. A stable color-bar pattern was shown on the TV screen.
There are only a few precautions.
Notice that these drive waveforms have either 30VPP or 300VPP maximum amplitudes. All 300VPP signals are for tube operation.
These are the tube composite sync, horizontal keying pulse, vertical output-tube grid and horizontal output-tube grid signals. All others have less than 30VPP, and are intended either for solid-state circuits or for audio and video stages where large signals are not needed.
Do NOT attempt to connect one of the tube-type waveforms to any transistorized circuit. This could ruin the solid-state device.

Figure 12---The stable phase lock between all VA-48 signals is illustrated
by this simultaneous dual-trace picture.
Calibrations for the continuously variable drive-level control range from-30V when counterclockwise to zero at the center of travel and on to 1-30VPP at the full clockwise position. These calibrations are approximate but direct reading for all except the four 300VPP waveforms. For those signals, the calibration must be multiplied by 10.
Of course, the meter can monitor these drive amplitudes where greater accuracy is required. The meter switch is rotated to "Drive Signal Monitor." For convenience, the circuit automatically changes the peak-to-peak range so the 30VPP waveforms are measured on the 30VPP range and the 300VPP signals are measured on the 300VPP range. However, there is no indication (except for the color keyed markings around the drive signals knob) of which range is in use. The operator must keep this in mind.
The "Drive Output" jack is supplied with drive signals through a 20yF non-polarized capacitor. A 470K resistor is connected from jack to ground. These components prevent any steady do voltage from reaching the drive output jack.
They also isolate the VA-48 from the receiver circuits under test. In most instances there are no precautions. It is possible to produce a temporary do voltage of considerable value by rotating the drive level control rapidly when tube-drive signals are present there. No problems were experienced in actual signal substitution tests, but it is strongly advisable to select the type of drive signal, set the level with meter and drive-level control, and then ground the drive-output lead wire for a few seconds to bleed any voltage before connecting to the unit under test. Also, the output lead should be grounded between tests made on parts of a receiver circuit that have supply voltage and those tests made at tube grid or transistor base. (This recommendation also holds true for signal-substitution tests made with instruments other than the VA-48.)
Drive signal waveforms Figure 13 shows most of the drive-signal waveforms. Those for horizontal output-tube grid and vertical output-tube grid are shown in both positive (+300VPP) and negative (-300VPP) versions, while all others are pictured in the positive polarity. A few fast-rise waveforms have had the vertical lines touched up to make them visible.
Vertical Injection test
The positive vertical output-tube grid waveform was connected to the grid of the output half of the vertical multivibrator oscillator. Because the circuit was not defective, the VA-48 signal and the oscillator signal were interfering with each other and producing an unstable height. When the coupling capacitor between oscillator and output was disconnected and the VA-48 signal injected at the capacitor, almost full height could be obtained. As shown by the pictures and waveforms of Figure 14, the linearity was slightly distorted, but the vertical sweep operated with stability. The lack of good linearity was not important, since the test proved the entire output stage was operating as it should. Similar results were obtained when the VA-48 signal was reduced in amplitude and injected at the oscillator grid.

Figure 13 These drive signals were photographed from the VA-48: (A)
At top is 260VPP positive-going horizontal-output tube grid waveform.
Lower trace is same but negative-going. (B) Top waveform shows 260VPP
positive-going vertical-output tube grid waveform. Lower trace is same
but negative-going. All following waveforms are positive-going only.
(C) Top trace is 260VPP horizontal keying pulse, while 250VPP tube V&H
composite sync is shown by the lower trace. (D) Solid-state composite
sync of 31VPP is the top trace. Horizontal SCR-gate drive of 31VPP is
shown by the bottom trace. (E) At the top is 31VPP horizontal-output
transistor base square waves, while the lower trace shows 26VPP vertical-output
transistor base drive. (F) Audio sine waves of 27VPP are the top trace,
and 28VPP 3.56MHz color carrier is shown by the lower trace.
Several video patterns were shown previously.

Figure 14 Normal operation of a multivibrator-type vertical-sweep circuit
is shown by the (A) raster-crosshatch picture and the top trace of the
(B) scope waveforms. This top trace is the waveform at the output grid.
When the VA-48 vertical-output grid drive waveform was connected to the
output-grid coupling capacitor (lower B waveform), the crosshatch was
nonlinear (C), but almost covered the TV screen.

Figure 15 (A) Top scope trace is the normal horizontal-output grid waveform,
while the lower trace is the grid waveform when the horizontal output
tube grid VA-48 signal was connected from grid to ground without removal
of any components. Circuit capacitances reduced the amplitude and lengthened
the retrace time that produced the out-of-focus crosshatch of (B). Disconnecting
the oscillator end of the grid coupling capacitor (C) and feeding in
the VA-48 signal direct improved the grid waveform (lower trace of D,
with normal waveform ; above), restored the high voltage and gave a perfect
crosshatch (E).
Horizontal injection test
First attempt to drive the horizontal-output grid in an old color TV was partially successful. The VA-48 horizontal output-tube grid signal was connected to the grid of the output tube without any circuit changes except to remove the horizontal oscillator tube. As shown in the pictures and waveforms of Figure 15, a careful adjusting of the drive-level control produced an out-of-focus crosshatch pattern with some compression near the center and only about 12kV of high voltage. Of course, this was enough to prove the previous problem was a defective horizontal-oscillator circuit.
The TV model used for the test had two coupling capacitors and two resistors to ground between the oscillator and the output. There fore, the coupling capacitor (nearest the oscillator) was disconnected from the oscillator and the VA-48 signal was injected there. This time the operation was totally normal, giving full width, 24kV of high voltage and good horizontal linearity.
Video signal substitution
Video patterns from the drive-signals selector switch were injected at various points in the video circuit. Figure 16 shows the successful results of connecting the VA-48 signal to the grid of the first video tube. The frequency response of the bar sweep is not flat because it is normal for the bandwidth to be reduced by video peaking. Whether or not locking is obtained depends on the TV model and where the video, signal is injected. Locking was good in this test.
Comments
It was impossible to check all functions of the VA-48 in the available time because there are so many. But all attempted tests performed perfectly.
The VA-48 is said to incorporate tests and functions usually supplied by 10 separate instruments. Many of these signals are unique. These include the bar-sweep patterns and most of the drive signals. The features appear to be very adequate for servicing videocassette recorders, although that application was not explored.
Three general features were most impressive. First is the ability to control the amplitude of these signals as needed. Second in importance is the phase lock between various signals. This is a luxury that a technician probably would not appreciate until after he has attempted to feed in two signals from separate generators. The elimination of extra test leads saves much time and prevents mistakes.
Many tests can be performed with only the RF-IF cable. Others require only a ground lead and one signal lead.
In summary, the VA-48 Sencore is an excellent instrument for MATV, television receiver and videocassette recorder servicing.

Figure 16 Bar-sweep video from the drive-signals source was connected
direct to the video-detector output in an old color TV. The raster picture
showed an expected loss of high frequencies, but the contrast was high.
This is an excellent way of checking video gain.
Also see: Fluke DMM