Most servicing is done with voltmeters.
An oscilloscope is a voltmeter. It is a more complete voltmeter than a VOM.
A scope gives more complete information than a VOM (or VTVM) because it shows how a voltage rises and falls in. a receiver circuit. This rise and fall is called the waveform of the voltage.
It is sometimes supposed that a scope is difficult to operate. As a matter of fact, it is easier to learn how to use a scope than to learn how to ride a bicycle.
Just as we can go places faster on a bicycle than on foot, we can troubleshoot TV receivers faster with a scope than with a voltmeter. For example, a meter cannot show whether a voltage is "ringing"-a scope does. A meter cannot show whether a signal is undistorted, clipped, or noisy-but a scope does. A meter cannot indicate the occurrence of parasitics, cross talk, or phase shift-a scope shows these troubles at a glance.
Using a scope can be an interesting procedure, as well as a profitable one. The service technician who understands scope operation is worth more to himself and to his employer than one who is handicapped by ignorance of this important instrument.
Although this guide is titled 101 Ways to Use Your Oscilloscope, there are also many other ways to use a scope. Additional applications will be found in the companion volume, 101 Ways to Use Your Sweep Generator.
This guide is not intended to be used as a textbook. It is a practical working handbook for the professional service technician. However, if you have never used a scope before, you will find it helpful to read the next few pages carefully. Here you will find a practical discussion of peak-to-peak, instantaneous, effective, and average values of sine waves and how they tie in with the peak-to-peak values of complex TV waveforms.
Peak-to-Peak, Instantaneous, Effective, and Average Values
TV service literature frequently refers to "peak-to-peak" voltage values. The AC voltage scales of a volt-ohm-milliammeter indicate rms voltage values. The meter movement in a VOM responds to the average value of a rectified sine wave. What do these various terms mean?
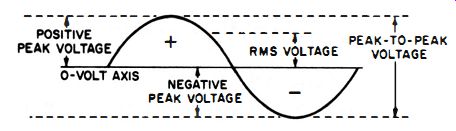
Fig. 1. A sine wave.
A sine wave, with its important component values indicated, is given in Fig. 1. The highest value reached in any one direction by a waveform is called the peak value. The peak-to-peak voltage is equal to the total excursion from the positive peak to the negative peak. The two peaks of the sine wave have the same value on both positive and negative half-cycles-that is, a sine wave is a symmetrical waveform. The peak voltage is equal to one-half the peak-to-peak voltage. The rms voltage is equal to 0.707 the peak voltage.
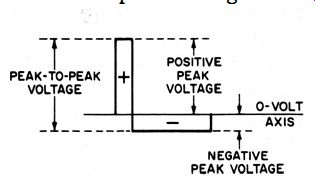
Fig. 2. A pulse waveform.
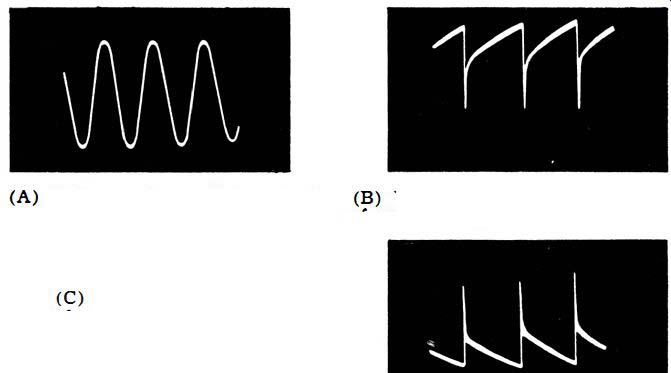
Fig. 3. Typical waveforms found in a TV receiver. (Courtesy Motorola, Inc.)
(A) 3.58-mhz color oscillator signal. (B) Vertical sweep voltage at grid of
vertical output tube. (C) Vertical sweep voltage at plate of vertical output
tube.
Of course, not all television waveforms are symmetrical. For example, consider a pulse waveform as shown in Fig. 2. Note that here the positive-peak voltage is not equal to the negative peak voltage. However, the positive area of the waveform is equal to its negative area. The sum of the positive-peak and negative-peak voltages is equal to the peak-to-peak voltage.
Pulse waveforms are common in television receiver operation, as shown in Fig. 3. In Fig. 3A, the 3.58-mhz color oscillator signal is shown. This waveform has a peak-to-peak voltage of 55 volts. Fig. 3B shows the waveform at the grid of the vertical output tube, and Fig. 3C shows the waveform at the plate of the same tube. The peak-to-peak voltage of the waveform shown at B is approximately 150 volts, while the one shown at C is approximately 1,500 volts, depending upon the settings of the Vertical Size and Vertical Linearity controls.
The value of the voltage at any point on the waveform is called the instantaneous voltage at that point. Thus, the peak voltage of a waveform is an instantaneous value. A given point on a waveform can be identified in terms of time (such as the 1/8-cycle point) , or it can be identified in terms of an angle (such as 45°) . As seen in Fig. 1, the average value of a sine wave is zero--that is, the average value over one complete cycle is zero. It is sometimes puzzling to consider how we can speak of "10 milli-amperes of alternating current," because the instantaneous value of the current is continuously changing and the average value of a complete cycle is zero. The puzzle is solved by first recognizing that, although the average value of an AC current is zero when tested with a DC meter, it does have some finite value when tested with an AC meter. Furthermore, when an alternating current is used for heating a soldering iron or for lighting the filament of a tube, for example, both the positive and the negative half-cycles of the waveform effectively produce heat or light and do not cancel out. Cancellation occurs only when the AC waveform is applied to a DC utilization device, such as a DC voltmeter.
Early in the development of the electrical industry, DC was used exclusively for heating, lighting, and power. Later, AC was found to be more economical to distribute and use, and AC power systems gradually displaced DC power systems.
Now, the industry faced a new problem. A unit of voltage and current measurement was needed, whereby "110 volts" of AC would produce the same amount of heat, light, or power as "110 volts" of DC. What unit of AC measurement produces this equivalence? Equivalence is realized when AC is measured in terms of "effective" values. In other words, the effective value of an AC current corresponds to a DC value. A soldering iron will get just as hot when energized by 110 volts of DC as it will by 110 effective volts of AC. Usually, we speak of an effective value as an rms value. As noted in Fig. 1, the rms value is equal to 0.707 the peak value. Service voltmeters are normally calibrated to read AC voltage and current in terms of rms values. The initials "rms" stand for "root mean square."
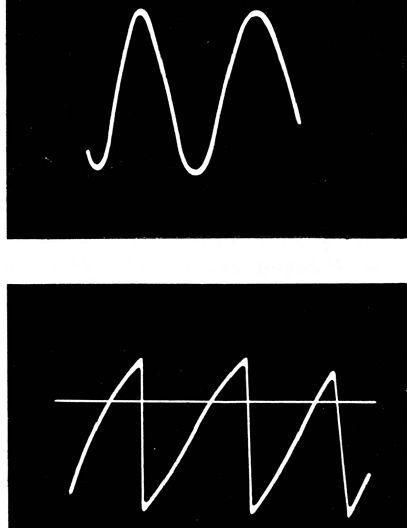
Fig. 4. A sine wave and sawtooth wave with equal peak-to-peak voltage values.
(A) Sine wave. (B) Sawtooth wave.
Thus, we can compile the useful relations of sine-wave voltages:
PEAK-TO-PEAK VOLTAGE = 2 x PEAK VOLTAGE PEAK VOLTAGE = % x PEAK-TO-PEAK VOLTAGE RMS VOLTAGE = 0.707 x PEAK VOLTAGE PEAK VOLTAGE = 1.414 x RMS VOLTAGE PEAK-TO-PEAK VOLTAGE = 2.83 x RMS VOLTAGE
Furthermore, if you are using a DC scope, you need to know that when you apply a 1.5-volt battery across the vertical-input terminals of a DC scope, the trace will move the same vertical height as when a 1.5 peak-to-peak, sine-wave voltage is applied.
(This is discussed and illustrated in detail in the text.)
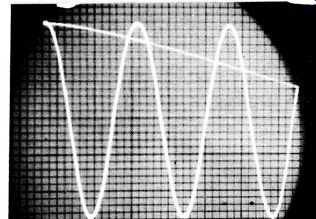
Fig. 5. Appearance of a graticule, used to measure peak-to-peak voltages.
The peak-to-peak voltages of the sine wave and sawtooth wave in Fig. 4 are equal. On the other hand, it is clear that the rms voltages of the two waveforms are not equal.
Of course, the relationships for AC current are the same as those for AC voltage, as given in the foregoing tabulation. Note very carefully: rms relations are for sine waves only.
When a scope is used to measure peak-to-peak voltage values, a ruled screen (graticule) is placed over the face of the CRT, as shown in Fig. 5. This screen permits accurate counting of vertical intervals of deflection when measuring peak-to-peak voltages.
Oscilloscope Specifications
Service scopes are commonly rated for vertical-amplifier sensitivity on the basis of rms volts-per-inch of deflection. In practice, the service technician is concerned with peak-to-peak volts, but manufacturers prefer to rate scopes in terms of rms volts because it makes the scope "look better." Thus, a scope having a sensitivity of 0.01 rms volt per inch has an equivalent sensitivity of 0.028 peak-to-peak volt per inch. It is apparent that, to the casual reader of specifications, the rms rating gives the superficial appearance of higher sensitivity. This practice is now so firmly entrenched that it is not likely to be changed in years to come. However, a minority of scope manufacturers rate the sensitivity of the vertical amplifier in a scope in terms of both rms volts per inch and peak-to-peak volts per inch.
A few service scopes are rated in terms of rms volts percentimeter, and this type of rating makes the scope appear still more sensitive to the casual specifications reader. An inch contains 2.54 centimeters, and hence a scope having a sensitivity of 0.01 rms volt per inch has an equivalent sensitivity of approximately 0.004 rms volt per cm.
To illustrate these points with a specific example, consider a scope having a sensitivity of 0.01 rms volt per inch. All of the following ratings are exactly equal to one another:
rms volts per inch . ...... 0.010
Peak-to-peak (or DC) volts per inch . .....
0.028 rms volts percentimeter . ...... .. ... .
0.004
Peak-to-peak (or DC) volts percentimeter .. ... .
0.011
Service scopes vary in vertical-amplifier bandwidth from 500 -khz to 5-mhz. The uniformity of response (flatness) also varies greatly.
The most important requirements for wide-band flat response arise in color TV tests. (Readers interested in vertical-amplifier response may refer to the companion volume, 101 Ways to Use Your Sweep Generator.)
Triggered-Sweep Scopes
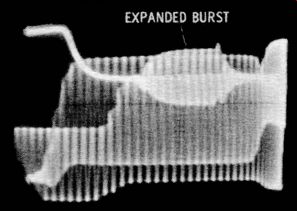
Fig. 6. Color burst expanded on an ordinary scope.
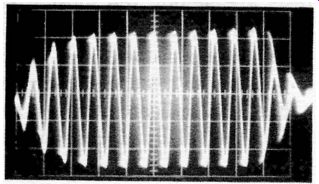
Fig. 7. Color burst expanded with a triggered-sweep scope.
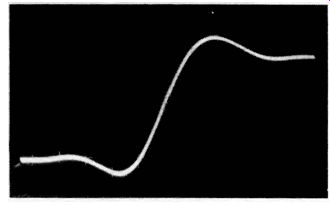
Fig. 8. Expanded leading edge of a square-wave display.
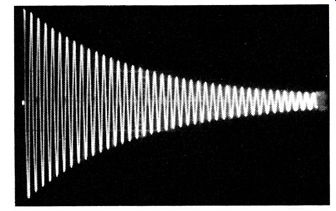
Fig. 9. Ringing test of a single coil.
There is growing interest in triggered-sweep scopes that have wide-band response. This type of scope is used with fast-rise square-wave generators to make accurate checks of amplifiers, TV receivers, circuit sections, and components. A triggered-sweep scope is not so very different from an ordinary scope in many respects. However, the sweep oscillator of the scope is normally biased beyond cutoff so no horizontal deflection occurs until there is a sync (trigger) signal of sufficient amplitude to bring the sweep oscillator out of cutoff. Then the beam is deflected across the face of the scope once by a single sawtooth cycle. The beam rests after the one sweep until the sync signal rises once again to the triggering level.
This triggering function might seem to be a minor feature, but it actually has great utility. For example, if you try to expand a color burst on the screen of an ordinary scope, a confused and overlapping display is obtained (Fig. 6) . On the other hand, a triggered-sweep scope provides the expanded display seen in Fig. 7. Why is there no overlap in the pattern of Fig. 7? It is because the beam deflects only once for each horizontal sync pulse, regardless of sweep speed. Since the sweep speed can be set at any value, we choose a speed that fills the screen horizontally with only the burst display. Unlike a conventional scope, sync lock is unaffected by changing the horizontal sweep speed.
Again, when square-wave tests of receivers, amplifiers, or circuits are made, rise-time measurement provides essential test information. To measure rise time, the leading edge of the reproduced square wave must be expanded as illustrated in Fig. 8. A confused, overlapping pattern is avoided by employing triggered sweep.
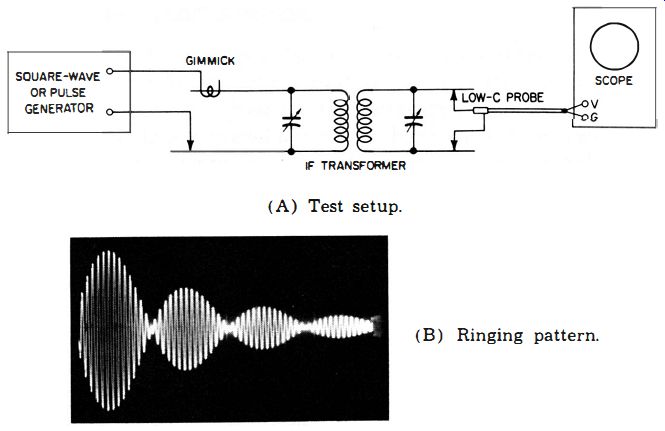
Fig. 10. Making ringing tests of transformers. (A) Test set up. (B) Ringing
pattern.
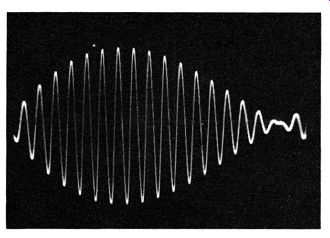
Fig. 11 . Expansion of ringing pattern.
Fig. 12. Ringing in an amplifier. (A) 2-khz square-wave response with resistive
load on the amplifier. (B) 2 -khz square- wave response with voice-coil load
on the amplifier.
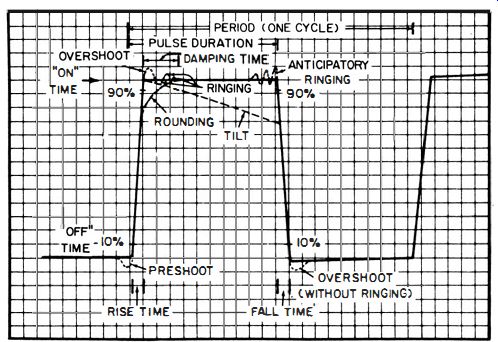
Fig. 13. Terminology of the square wave,
Technicians know that modular construction of TV receivers has already begun. Printed components have been with us for years, and sealed, encapsulated blocks containing several ordinary components are in regular use. Square-wave testing is most suitable for analyzing these multiple component modules. Ringing tests are among the most useful methods of checking inductive circuits. Fig. 9 displays a ringing pattern from a single coil. Triggered-sweep scopes have calibrated horizontal controls, making it possible to read out complete information concerning the coil.
Fig. 10A indicates the test setup of the equipment, and Fig. 10B shows the result of a ringing test on an ordinary IF transformer.
To the technician "in the know" this pattern provides complete information concerning the transformer; even the number of cycles in each ringing group is significant. A group display can be expanded when a triggered sweep is used as shown in Fig. 11.
Amplifiers often ring when tested with a square-wave signal (Fig. 12) . The ringing interval is an important part of the waveform that is taken into consideration in square-wave analysis. Some of these characteristics are discussed further under specific tests described subsequently.
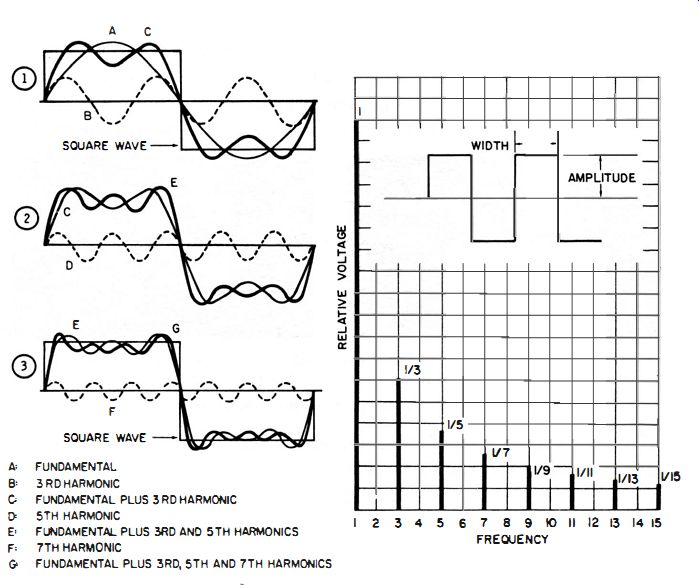
Fig. 14. Analyzing a square wave. (A) Building a square wave from (B) Harmonic
amplitudes in a per sine waves, feet square wave .
High-quality instruments (the only practical kind for accurate square-wave testing) provide square-wave signals and screen patterns having a rise time of approximately 25 nanoseconds (0.025 microsecond) or faster. The basic terminology of square waves is noted in Fig. 13. When the output from a square-wave generator is fed directly to a scope, preshoot, overshoot, ringing, rounding, and tilt should not be noticeable if the scope has a rise time at least twice as fast (12 nsec) as that of the square-wave generator.
Generators of lesser quality can be used in square-wave tests, but the limitations of the generator have to be allowed for in evaluating. a reproduced waveform, and this is sometimes a confusing task.
There are two ways of regarding a square wave. The easiest way is to assume that a square wave is composed of a very large number of sine waves, as depicted in Fig. 14. This viewpoint is useful for rough checks, but it has two disadvantages. First, if you try to apply Ohm's law from this viewpoint, there are so many sine waves to contend with that the solution of Ohm's law becomes prohibitively difficult. Second, there are many situations in which the assumption of a very large number of sine waves (theoretically an infinite number) will actually give the wrong answer. This is because the sine-wave viewpoint assumes that the circuit has a very large bandwidth (theoretically an infinite bandwidth) , and this is contrary to fact.
Fig. 15. Effect of varying R and C in an RC circuit.
Therefore, the better way to regard a square wave is to recognize that it is generated by switching a DC voltage off and on at regular intervals. This way we are concerned basically with exponential waveforms, such as are depicted in Fig. 15. Ohm's law can then be effectively applied to the circuit under test, and the correct waveform determined. Actually, it is not necessary to make step-by-step Ohm's law calculations in a circuit such as shown in Fig. 15. Instead, a universal RC time-constant chart can be used. From it values for voltage at any instant can be determined without going through any involved calculations.
+++