Although each receiver is correctly adjusted at the factory, rough handling during transit and aging components may cause misalignment of the critical circuits. If picture and sound defects indicate that a realignment is necessary, the manufacturers' step by-step procedure should be followed.
In order to better understand the following detailed alignment procedure, it is necessary to explain why this procedure has been prepared in this manner. Any receiver alignment problem may be classified as either minor or major. In other words, it is either only slightly out of adjustment and therefore requires minor adjustments of one or more of the coils; or some of the coil cores have been removed or are badly out of adjustment, requiring a thorough check of the entire circuit. A preliminary overview of basic alignment setups is shown in Fig. 15-1; typical coils with adjustable cores are shown in Fig. 15-2.

Fig. 15-1. TV-alignment setup. (A) An RF tuner alignment setup. (B) An IF alignment
setup. (C) A chroma

Fig. 15-2. Coils with adjustable cores.
External noise and signals may be very troublesome during alignment. Therefore a stage-by-stage procedure is usually followed, during which the signal is injected just preceding the stage under alignment. If it is known that the set is not badly out of alignment, it may be possible and practical to abbreviate the procedure considerably by applying the input signal directly to the antenna input during the entire alignment procedure instead of applying it to the different stages as each individual stage is aligned.
One important point should be kept in mind when making all adjustments: All the individual coils must be aligned at the same frequency setting of the generator rather than changing the generator setting and having to reset the generator at the same frequency. For example, when making adjustments at 41.25 MHz, do not change the generator setting from the time of starting these adjustments until all adjustments on all coils that are to be aligned at this particular frequency have been completed, even though this means changing the point of signal injection. The exact frequency to which the coils are aligned is not as important as being sure that all coils of identical frequency are aligned at exactly the same frequency. The frequency tolerance of ±5% in signal-generator frequency can be tolerated if the coils are aligned at the identical frequencies.
Again it should be emphasized that all pertinent data relating to the set to be aligned should be available for reference, and the manufacturer's alignment procedure must be followed.
GENERAL ALIGNMENT PROCEDURE
To align a television receiver or any other receiver or device employing wideband circuits, a visual indication of the response of the circuit being aligned is required if the alignment is to be considered acceptable. Visual alignment is fast replacing the older, slower, point-by-point alignment method and is as rapid as it is effective. When combined with the use of accurately established marker frequencies, it is also precise.
If the amplifier under test happens to be a wideband IF amplifier, the sweep generator is normally connected to the stage preceding the second detector. The vertical-input terminals of the oscilloscope are connected across the detector, and the horizontal terminals are connected to a source of deflection voltage usually supplied by the sweep generator. When the sweep generator is tuned to sweep the band of frequencies accepted by the IF circuit, a trace representing the response characteristics of the circuit will appear on the oscilloscope screen.
A typical trace is shown in Fig. 15-3. From this trace, valuable information about the response can be obtained; but if the center frequency of the response and its bandwidth are to be deter mined to any degree of accuracy, a marker must be used.
When a source of marker frequencies is coupled to the input of the amplifier under test, a discontinuity, or "pip," will be observed on the trace, as shown in Fig. 15-3. If the marker generator is tuned exactly to the center of the passband accepted by the IF amplifier, then this marker pip will indicate the position of that frequency on the trace. Knowing the center frequency, the serviceman then adjusts the final tuned circuit for a trace that is of maximum amplitude and is symmetrical about the marker pip or has the shape recommended by the manufacturer of the equipment being aligned. Preceding stages are then adjusted progressively by moving the sweep-generator-output cable back, stage by stage, toward the input of the amplifier.

Fig. 15-3. Typical tuned-circuit response.
Figure 15-4 shows the position of the marker pip relative to the response for various conditions of misalignment. It must be emphasized that, once the marker generator is tuned to the correct frequency, the position of the response is incorrect and must be moved over under the marker pip by adjustments of the tuned circuits in the amplifier.

Fig. 15-4. Response of improperly aligned circuits. (A) Response correct but
frequency (B) Frequency correct but response low not symmetrical (C) Response
correct but frequency high.

Fig. 15-5. Bandwidth measurement.
The determination of the bandwidth of a particular response is another important function of marker generators. Figure 15-5 shows how this is performed. After the amplifier is aligned, the marker generator is tuned to a lower frequency so that the marker pip falls on the 70 percent response point on the low frequency side of the response curve. The frequency at this point is read from the marker-generator dial scale; then the generator is tuned toward a higher frequency until the marker pip rests on the high-frequency side of the curve at the 70 percent response point.
This response is also read from the dial scale. The difference between the two frequencies is equal to the bandwidth of the amplifier at the 70 percent response points. (The application of marker generators to alignment problems has been discussed in a very general way to acquaint the reader with the technique.) Since various models of television receivers employ different coupling and amplifier circuits, any one method of alignment, if described completely in this Section, would be of little value to the television serviceman. In all cases, before alignment of any television receiver is attempted, the manufacturer's alignment instructions should be consulted. However, since the application of the television calibrator to alignment techniques in all cases is simply and clearly indicated, its use can be described in sufficient detail to cover all methods of alignment. Accordingly, in the following applications, we shall proceed with the assumption that the other equipment required is set up and operated in conformance with the manufacturer's instructions pertaining to the particular receiver under test and according to standard visual alignment technique.
Aligning Video IF Amplifier
The test equipment and the receiver are set up as shown in Fig. 15-6. When the sweep generator is tuned to sweep the passband of the video IF amplifier, a trace similar to that of Fig. 15-7 should appear on the oscilloscope screen. This trace is typical of the video IF response of modern television receivers. Since the intermediate frequencies for most television receivers are 45.75 MHz for picture and 41.25 MHz for sound, these frequencies are shown in their proper position in Fig. 15-7.

Fig. 15-6. Test equipment and receiver setup in alignment of video IF amplifier.

Fig. 15-7. Typical video IF response.
Typical Video IF Alignment
In the following description, we shall assume that the receiver under test employs standard intermediate frequencies, although under no circumstances does this assumption mean that receivers utilizing other intermediate frequencies cannot be aligned easily.
The instrument is employed as follows:
1. Couple the output cable of the calibrator loosely to the input of the mixer (see Fig. 15-6). Sufficient coupling is usually obtained when the ground lead on the output cable is connected to the receiver chassis and the hot lead is placed near the wiring of the mixer stage. Some television receivers, having comparatively low-gain IF amplifiers, may require tighter coupling. Too much coupling is undesirable because detuning of the circuit may result. If the curve shape is altered when the marker signal is inserted, coupling is too tight.
2. Set the calibrator frequency exactly on 45.75 MHz. A marker pip should appear somewhere on the trace. If the oscilloscope used to observe the response curve has a wide band video amplifier, the combination of marker pip and response curve may look like the curve shown in Fig. 15-8A. A sharper marker pip may be obtained when the high frequency response of the oscilloscope vertical amplifier is decreased by shunting the vertical input terminals with a small capacitor (about 0.001 µF). The resulting trace is shown in Fig. 15-8B.

Fig. 15-8. Trace of video IF response as it might be seen on oscilloscope.
3. The position of the 45.75-MHz marker (picture IF carrier) should be approximately the 50 percent response point on the slope of the response curve, as shown in Fig. 15-8. The tuned circuits in the picture IF amplifier are adjusted so that the response curve is of the proper shape with the marker pip in the position shown in Fig. 15-8.
4. The position of any frequency in the response curve can be determined by placing the marker pip at that point and reading the frequency from the tuning-dial scale. One important frequency is that where the response just starts to drop off toward the sound-carrier frequency (see Fig. 15-9). If the variable-frequency oscillator of the calibrator is set and calibrated to the picture IF carrier and the external variable-frequency oscillator is set to a frequency that is the difference between the picture IF carrier and the frequency whose marker pip is shown in Fig. 15-9, two simultaneous markers will appear.

Fig. 15-9. Trace of video IF response with sound-carrier frequency marked.
These frequencies are most important in the alignment of picture IF amplifiers, and their marker pips may be kept in sight constantly to eliminate the necessity of returning and recalibrating the signal source.
Other important frequencies are the trap frequencies, shown in Fig. 15-10. Since the response of the amplifier is very low at the trap frequencies, the marker pip will disappear when it is placed

Fig. 15-10. Trace showing typical trap frequencies.
on these frequencies; however, these points can be determined on the response curve by placing the marker pip first on one side of the trap frequency, then on the other, and interpolating the center frequency.
During preliminary alignment, when the response of the amplifier at the trap frequencies has not been tuned to a minimum, a marker can be placed on the adjacent-channel sound IF carrier or adjacent-channel picture IF carrier. These markers can be obtained from a separate variable-frequency oscillator tuned to 1,500 kHz and connected to the MOD IN jack of the calibrator.
With the variable-frequency oscillator of the calibrator set for a main marker at the sound or picture IF carrier frequency, markers will appear 1.5 MHz away from the main marker.
Two simultaneous marker pips may be provided by the calibrator-one at the sound IF carrier and the other at the picture IF carrier when the output of the variable-frequency oscillator is tuned to either frequency and the 4.5-MHz crystal oscillator output is used to modulate it. This may be accomplished by turning the calibrate selector to 4.5 MHz. It is advisable to maintain the RF OUT control near its maximum clockwise position whenever internal modulation is employed.
If the marker amplitude is still too high, it may be reduced by looser coupling to the amplifier input point. The size of the marker pip can be increased by turning the RF our control clockwise or by coupling the output cable closer to the amplifier under test, or both. Coupling that is too tight, however, may result in detuning of the IF amplifier and consequent distortion of the response.
Traps in the picture IF amplifier are adjusted by feeding the output of the television calibrator, tuned to the trap frequency, into the IF amplifier. Each trap is adjusted for minimum output, as indicated by a sensitive vacuum-tube voltmeter or digital voltmeter connected across the second detector. If the output of television calibrator is modulated by the internal audio signal, an oscilloscope may be used as an output indicator.
The general procedure in aligning picture IF amplifiers is first to set the traps and then to align the other circuits in the IF amplifier. Since any adjustment made on these other circuits in most cases will slightly detune the traps, they may have to be "touched up" during the picture IF amplifier alignment. The manufacturer's alignment instructions will again determine the exact procedure to follow.
Aligning RF Amplifiers
The radio-frequency stages of a television receiver should have a passband of about 6 MHz (see Fig. 15-11). The equipment for producing this is set up and operated according to the manufacturer's alignment instructions, and the output of the calibrator is fed into the receiver antenna terminals. Normally, the calibrator is tuned to the center frequency of the channel being aligned; then the tuning adjustments in the RF amplifier are adjusted to produce a response that is symmetrical on each side of the marker pip.

Fig. 15-11. Trace of typical RF response.
The output frequency of the calibrator is tuned to either the picture or sound carriers. When either of these frequencies is correctly marked on the RF response curve as seen on the oscilloscope, a marker pip appears at the other part of the curve if the output frequency is modulated by 4.5 MHz. To do this, the calibrate selector is set at the 4.5-MHz position, and two pips, one marking the sound carrier and the other marking the picture carrier, are seen on the response curve spaced exactly 4.5 MHz apart.
Aligning RF Oscillators
The local oscillator in the television receiver can be rapidly and efficiently aligned by feeding the sound-carrier frequency into the input of the receiver and adjusting the receiver oscillator to obtain zero output from the sound discriminator. This procedure can be followed only after the sound IF system has been correctly aligned. The procedure for a receiver using a discriminator is as follows:
1. Couple the output of the calibrator to the input of the receiver.
2. Connect a voltmeter to the output of the sound discriminator.
3. Set the calibrator to 215.75 MHz (channel-13 sound).
4. If the receiver has a fine-tuning control, it should be set at the center of its tuning range.
5. Adjust the channel-13 oscillator trimmer for zero output from the discriminator. Check this point by turning the trimmer through the correct setting. The discriminator output should be positive on one side of the proper adjustment and negative on the other.
6. Adjust the remaining channels in a similar manner. In each case, set the calibrator to the appropriate sound-carrier frequency. Since the order of alignment may differ in receivers of different makes, the manufacturer's instructions should be consulted before proceeding.
7. If the receiver uses a ratio detector, a VTVM can be connected across the stabilizing capacitor and the oscillator trimmers tuned for a maximum VTVM reading.
Aligning Sound IF Amplifiers
With the exception of the response-curve shape, the application of the calibrator to alignment of sound IF channels follows the same general procedure given in the previous paragraphs on picture IF channels. The alignment equipment is set up as shown in Fig. 15-12. The IF response, with the superimposed marker pip, is shown in Fig. 15-13 as being indicative of that to be expected from normal sound IF amplifiers.
The width of the passband can be determined as described under "General Alignment Procedure." The usual discriminator characteristic is shown in Fig. 15-14A. Figure 15-14B shows the usual discriminator response curve with the center frequency (sound IF) modulated by a 0.25-MHz frequency. Three simultaneous markers are provided by modulating the center frequency with the 0.25-MHz frequency. These marker pips are 250 kHz apart and are used to check discriminator bandwidth.
The center-marker pip may not be visible since it is at a point of zero voltage, and consequently the two visible pips will be 500 kHz apart. If the small capacitor previously shunted across the oscilloscope vertical input is removed, a trace like the one shown in Fig. 15-158 will appear. Using this trace, the serviceman can determine the important center frequency of the discriminator characteristic with relative ease. Figure 15-16 shows the various conditions of discriminator misalignment.
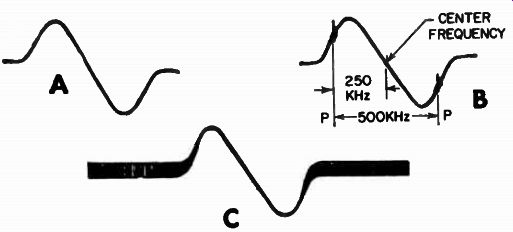
Fig. 15-14. Typical discriminator response.

Fig. 15-15. Typical discriminator response. (A) With capacitor across oscillator
input. (B) Without capacitor.

Fig. 15-16. Response of improperly aligned discriminator circuit. (A) Correct
response. (B) Secondary resonant frequency high. (C) Primary resonant frequency
too high or resonant frequencies of other IF transformers too high.
Another method of aligning the discriminator or ratio detector of television receivers is to obtain the usual response, as shown in Fig. 15-I4A. The center frequency (sound IF) is then modulated by an audio frequency. An internal audio frequency is provided in many generators. When the discriminator or ratio detector has been properly aligned, the response curve seen on the oscilloscope will be similar to the one shown in Fig. 15-14A. When the center frequency is other than that provided by the generator, the response curve will be similar to that in Fig. 15-14C. Television receivers employing intercarrier-sound IF stages may be aligned in a manner similar to the procedure described previously. Since all receivers of this kind use a sound IF frequency of 4.5 MHz, it is merely necessary to provide this frequency as the center frequency of the response curve. When the calibrator is set to 4.5 MHz, the RF output frequency is 4.5 MHz and its output may be controlled by the RF OUT control. This output is fed into the video amplifier ahead of the 4.5-MHz takeoff point. If additional markers are needed, they can be obtained by connecting the output of an ordinary variable frequency oscillator the MOD IN jack of the calibrator.

Fig. 15-17. Typical setup for second detector and video-amplifier response
check.

Fig. 15-18. Video-amplifier and -detector response.
Second-Detector and Video-Amplifier Response Check
This test portrays on the screen of an oscilloscope a trace that shows the response of, not only the video amplifier in a television receiver, but the second detector and its load as well. Equipment for the test is set up according to Fig. 15-17. The method follows:
1. Connect the outputs of the television calibrator and the sweep generator directly to the video detector stage.
2. Set the sweep generator to sweep an arbitrary band of frequencies, say 20 to 30 MHz. Tune the calibrator to 20 MHz.
(These exact frequencies do not have to be used; it is necessary only to set the calibrator to a frequency that is included near the low-frequency end of the band swept by the sweep generator.) Rectification in the second detector will produce, across the detector load, a band of frequencies continuously swept from 0 to 10 MHz. This video sweep is used to check the video-amplifier response.
3. The detector probe of the oscilloscope is connected to the output of the video amplifier at the picture tube. If the oscilloscope is not equipped with a detector probe, then an external detector, using a diode or crystal rectifier, may be utilized. The detector should have, in addition to good 60 hertz, square-wave response, a low-input capacitance to preclude any detrimental effect on the video-amplifier response produced by capacitance loading of the amplifier output.
When the picture tube is removed from its socket, the amplifier can be tested under more nearly actual conditions since the input capacitance of a well-designed detector closely approximates the input capacitance of the picture tube. If the oscilloscope has a wideband response, a detector probe will be unnecessary.
4. A trace similar to the one shown in Fig. 15-18 should appear on the screen of the oscilloscope. This trace represents the frequency versus amplification characteristic of the video amplifier and second detector. Particular frequencies along the response curve can be estimated since the length of the entire trace is known to be representative of a video frequency bandwidth equal to the sweep-width output of the sweep generator.

Fig. 15-19. Response of the video-signal channels.
ALIGNMENT OF COLOR-TV RECEIVERS
Alignment of a color-TV receiver is much the same as for a black-and-white receiver except that the chroma section presents somewhat different requirements. With reference to Fig. 15-19, it is helpful to observe the relative frequency-response curves for the various video-signal channels of a typical color receiver. In this example, the chroma subcarrier falls at the 35 percent point on the IF curve. To compensate for chroma-sideband attenuation, the bandpass amplifier is aligned with a rising frequency response. In turn, the overall IF and bandpass-frequency response is substantially flat through the chroma-signal region.
The Y amplifier is checked in the same manner as explained previously for a video amplifier in a black-and-white receiver.
Y -amplifier-response curves have different specifications for various color receivers. For example, one type of curve for a Y amplifier is seen in Fig. 15-19, whereas another receiver employs more extensive subcarrier trapping, as depicted in Fig. 15-20. Some color receivers have a picture-peaking control between the video detector and the video amplifier. The setting of this control will change the high-frequency portion of the response considerably.

Fig. 15-20. Frequency-response curve for Y amplifier.
Figure 15-21 shows a typical chroma bandpass amplifier and a bandpass-response curve with absorption markers. The sweep and-marker signals are applied at the video amplifier that drives the chroma-takeoff circuit. A scope is connected across the output of the bandpass amplifier (color saturation control in Fig. 15-21B). Either a low-capacitance probe or a demodulator probe can be used with scope. The frequency-response curve shown in Fig. 15-21A is an envelope display obtained with a demodulator probe. A circuit for a demodulator probe (sometimes called a traveling detector) is shown in Fig. 15-23.
Absorption markers may be provided in the video-frequency sweep generator, or an external marker-absorption box may be used (Fig. 15-24). The video-frequency sweep signal is passed through the marker box before it is applied to the receiver under test. Traps contained in the box (Fig. 15-25) produce notches in the frequency-response curve, as shown in Fig. 15-26. This is an envelope response, produced when a demodulator probe is used with the scope. If a low-capacitance probe is used with the scope, a video-frequency pattern appears, as depicted in Fig. 15-27. To the frequency of a marker "notch," the operator touches his finger to a terminal button (Fig. 15-24). In turn, body capacitance causes the associated notch to become more shallow and move on the pattern.

Fig. 15-21. Circuit diagram of typical bandpass amplifier.

Fig. 15-22. Bandpass-response curve with comparatively little high-frequency
rise.

Fig. 15-23. Circuit for a demodulator probe.

Fig. 15-24. Physical appearance of a marker box.

Fig. 15-25. Circuit configuration of a marker box for three markers.

Fig. 15-26. Marker-demodulated video curve.
Fig. 15-27. Video-frequency pattern obtained with a low-capacitance probe.
To summarize an important point, corresponding un-demodulated and demodulated video-frequency-response patterns are shown in Fig. 15-28. The un-demodulated pattern is obtained with a low-capacitance probe, while the demodulated response is obtained with a demodulator probe. The envelope of the response patterns is the same. If a narrow-band scope is used, a demodulator probe is necessary to avoid pattern distortion; on the other hand, if a 4-MHz scope is used, a low-capacitance probe may be employed if desired.
Fig. 15-28. Corresponding un-demodulated and demodulated frequency response patterns.
In the example of Fig. 15-21, three adjustments are provided to align the bandpass section. We observe that the curve shown in Fig. 15-21 has greater bandwidth than the one shown in Fig. 15-22. It is necessary to consult the service data for the particular receiver to determine the optimum bandwidth.
The burst amplifier has a narrow bandwidth; in other words, it is sharply tuned, with a peak frequency of 3.58 MHz. To align this stage, we simply use an unmodulated 3.58-MHz signal from a signal (or marker) generator and adjust for maximum output, as indicated by a scope or DVM. It is advisable to use a crystal calibrated marker generator because the alignment of the burst amplifier is somewhat critical.
Figure 15-30 shows the chroma-reference oscillator and control sections. A color-bar generator is generally used for alignment.
We proceed by disabling the burst amplifier so that the subcarrier oscillator is free-running. A DVM may be connected to indicate the amplitude of the subcarrier-oscillator signal, and the slug is adjusted for maximum DVM reading. This completes the first portion of the alignment procedure.
Next, we remove the short in the burst-amplifier circuit. If slug B has not been adjusted previously, it may be turned at this time to provide a maximum DVM reading, that is, aligned to resonance with the color-burst signal from the color-bar generator.
Thus far, the subcarrier oscillator is only in rough alignment; in other words, the oscillator may be "pulling" appreciably, which is undesirable because the receiver will tend to lose color sync on weak incoming signals. Hence, we proceed to make a touchup adjustment of the subcarrier oscillator.
In this final step, we can connect the DVM to test point C in Fig. 15-29. It is very likely that either a positive or a negative voltage will be indicated. We adjust slug D to obtain a 0-volt indication on the DVM. A cross check can be made by reducing the output from the color-bar generator to a very low level. The color-bar display on the picture-tube screen should remain in sync. If the color bars break up into "rainbows" at a low signal level, the foregoing alignment procedure should be repeated.
After the subcarrier oscillator has been checked out, we proceed to make a touchup adjustment of slug B in Fig. 15-29, if required. However, this involves the chroma demodulators, and this alignment procedure is explained subsequently.

Fig. 15-29. Bandpass amplifier may be cut off by the color killer.

Fig. 15-30. Basic chroma-demodulator configuration. (A) Sweep and marker signal
applied. (B) Scope connected at demodulator output. (C) Typical demodulator
response curve. (D) Display of a demodulator response curve on oscilloscope
screen.
Figure 15-30 shows a basic chroma-demodulator configuration. This is a simple arrangement in which the inductors are fixed-tuned. Therefore, if the frequency-response curve is not normal, there is a circuit defect, such as a faulty capacitor, off-value damping resistor, or shorted turns in an inductor. It is desirable to disable the subcarrier oscillator when checking the frequency response of a chroma demodulator to avoid interference from the strong 3.58-HMz signal. Absorption markers are generally used to check the bandwidth of the curve. Manufacturers of color receivers may not provide specified curves; in such a case, it may be possible to check against the curve from a receiver that is known to be in good working condition.
Phase-alignment checks are made with a color-bar generator.
Most shops use a keyed-rainbow generator, which provides the signal shown in Fig. 15-31. The signal contains 11 bursts, the first of which is utilized by the color-sync section. The following 10 bursts produce color bars on the picture-tube screen, as shown in the diagram. Each burst advances in phase by 30° from the previous burst, as shown in Fig. 15-32. The color-bar signal is usually applied to the antenna-input terminals of the receiver, and a scope is connected at the output of the chroma demodulator, which is being checked for phase alignment.
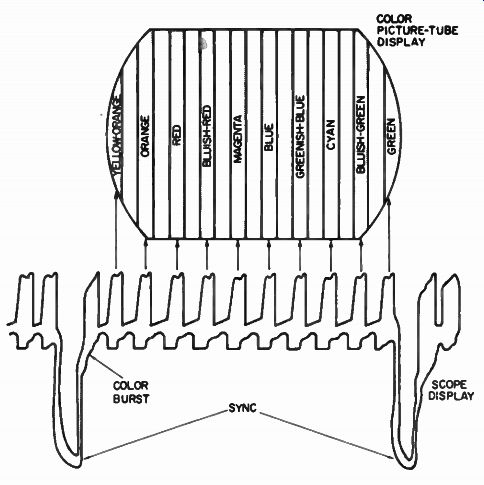
Fig. 15-31. Keyed rainbow and hues corresponding to each bar.

Fig. 15-32. Phase progression of rainbow signal.

Fig. 15-33. Demodulator outputs using keyed-rainbow signal.
Note that phase-alignment checks apply to chroma matrixes, as well as to chroma demodulators. In other words, if we are checking a G-Y signal channel, it makes no difference whether the G-Y signal is produced by a demodulator or by a matrix. The color picture tube is always driven by R-Y, B-Y, and G-Y signals. If the phase alignment is correct in these three channels, we observe scope patterns as depicted in Fig. 15-33. We count bars, or pips, to check the null points. For example, an R-Y output signal should null on bar No. 6.
Occasionally, tuning slugs are provided for adjustment of phases of the injected subcarrier signals. Often, the circuits are fixed-tuned. As noted in the discussion of frequency-response curves, an incorrect pattern indicates a defective component, such as a faulty capacitor; that is, if one or more of the nulls in Fig. 15-33 occur at incorrect bars, we proceed to check the components in the associated circuit.
SUMMARY
A stage-by-stage procedure is usually followed during alignment due to external noise, which can be very troublesome. It should also be kept in mind that all pertinent data relating to the particular set to be aligned should be available for reference, and the manufacturer's alignment procedure must be followed.
The vertical-input terminals of the oscilloscope are connected across the detector, and the horizontal terminals are connected to a source of deflection voltage usually supplied by the sweep generator. When the generator is tuned to sweep the band of frequencies accepted by the IF circuit, a trace representing the response characteristics of the circuit will appear on the scope screen. The marker is used to obtain valuable information as to response and degree of accuracy.
The position of the picture IF carrier (45.75 MHz) should be at approximately the 50 percent response point on the slope of the response curve. If the marker generator is tuned exactly to the center of the passband accepted by the IF amplifier, then this marker will indicate the position of that frequency. Knowing the center frequency, the serviceman then adjusts the final tuned circuit for a trace that is of maximum amplitude.
QUIZ
1. Why is the signal injected just preceding the stage under alignment?
2. How many hertz separate the sound and video IF?
3. Why should markers on response curve be observed?
4. What is the response point? What percentage?
5. What is the picture IF (in megahertz) in most TV receivers? The sound IF?