By Leonard Feldman
SEVENTEEN years after the Institute of High Fidelity (IHF) published its first definitive standards for FM tuner measurements, the home entertainment industry has produced a new set of standards which takes into account the tremendous advances which have occurred in the interim. The early 1958 standards (IHFM-T-100) pre-dated stereo FM broadcasting by fully three years, and so, quite naturally, the major difference between the old and new standards is the latter's incorporation of a whole list of specifications and measurements relating to stereo FM performance. But calling for full disclosure of stereo performance is only one aspect of the new standard's up-dating. We have already discussed the transition from voltage (or micro-voltage) to less ambiguous power or wattage as a means of specifying signal strengths delivered to the antenna terminals of a tuner or receiver. (See Audio, Dec., 1975, p. 47.) It is of extreme significance that, for the first time, three major industry associations have put their seal of approval on the new standards. In addition to the IHF, the other sponsors of the newly adopted standards include the EIA (Electronic Industries Association) and the IEEE ( Institute of Electrical and Electronic Engineers). In fact, the new standard, printed in a 35-page manual, bears a double identification number. It is designated as IHF-T-200, 1975 by the IHF and STD-185-1975 by the IEEE. Copies of the complete standard are available from either organization at a cost of $6.00, and the addresses are 489 Fifth Avenue, New York, N.Y. 10017 for the IHF and 345 E. 47th Street, New York, N.Y. 10017 for the IEEE. One of the outstanding contributions to specification writing of the older standard was the notion of "usable sensitivity." This specification spelled out the signal strength required to produce a program output level (at full modulation) which contained 3% combined noise and distortion. As the incoming signal applied to a tuner's antenna terminals increases in intensity, both background noise and distortion at the output of the tuner decrease-but not necessarily at the same rate. Since both constitute an "annoyance factor" added to the desired program material, the idea of specifying that signal strength which resulted in a diminution of both noise and THD taken together was a good one. What was not good was the 3% criterion, since today 3% of noise, distortion, or a combination of both is hardly regarded today as "high fidelity." Yet, it is this often-mentioned IHF sensitivity figure which has dominated the list of FM tuner and receiver specs, and it is the one which most prospective purchasers use in judging competing products.
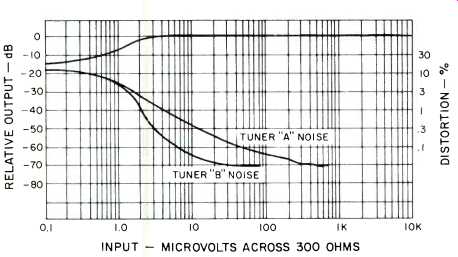
Fig. 1--FM quieting characteristics of two tuners that have approximately
the same "usable sensitivity" but widely different "50-dB
quieting sensitivities."
While the new standard still includes this spec (calling it "usable sensitivity"), it has added a much more important measurement -50-dB quieting sensitivity. This spec represents the number of microvolts (or, more properly, the power in dBf) of signal strength required to yield program output from the tuner or receiver which is 50 dB greater in amplitude than residual background noise. This lower level of background noise (compared with "3%" which is about -30dB) is more typical of what can be expected from reasonably good disc recordings or tapes played on home equipment and does qualify as hi-fi reproduction.
Figure 1 shows how two tuners, each having identical "usable sensitivity" (1.7 µV or 10 dBf) may have markedly different "50 dB quieting sensitivities." Tuner "B" is obviously superior to tuner "A" in this respect, requiring only 3.0 AN (14.9 dBf) to produce 50 dB of quieting.
Distortion Measurements
Since the "50 dB quieting sensitivity" measurement involves only residual noise, the standard requires that a statement regarding total harmonic distortion at this signal input strength be made, in addition to the distortion measurements made at the more usual "strong signal" conditions (formerly 1000 µV, now 65 dBf, which corresponds to about 977 µV when using the 300-ohm input terminals of a tuner or receiver). Furthermore, THD must now be stated for three audio frequencies-100 Hz, 1 kHz and 6 kHz-instead of at 1 kHz alone, as was formerly the practice.
Unaltered Measurements
Aside from the new reference levels of signal strength (45 dBf, where 100 µV was previously the reference; 65 dBf for measurements formerly made at 1000 µV), the following publishable specs remain, virtually the same as they were in the old standards: Capture Ratio; Alternate Channel Selectivity; Ultimate Signal-to-Noise Ratio; Frequency Response; IM Distortion; AM Suppression; I.F., Image and Spurious Response Rejection, and Frequency Drift. More sophisticated techniques for making these measurements are detailed in the standard itself, but the basic idea of these disclosures remains the same.
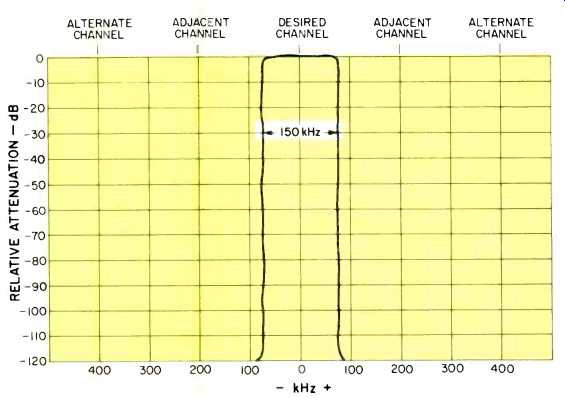
Fig. 2--If this idealized i.f. response could be achieved, adjacent and
alternative channel selectivity would be identical and "infinite."
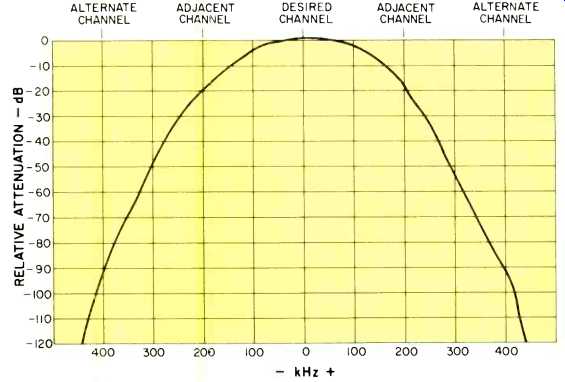
Fig. 3--In actual practice, adjacent channel rejection will be far poorer
(fewer dB) than alternate channel rejection.
Adjacent Channel Selectivity
A new measurement included in the standard is that of adjacent channel selectivity. The specification previously listed by most manufacturers called "Selectivity" was, in reality, alternate channel selectivity. That is, it was a measure (in dB) of a tuner or receiver's ability to reject signals spaced 400 kHz away (or two channel widths removed) from the desired signal frequency. Selectivity (be it adjacent channel or alternate channel) is largely a function of the band-pass characteristics of the i.f. section of the FM tuner. If the ideal i.f. bandpass filter could ever be designed, i.f. response of a tuner or receiver designed for FM reception would appear as shown in Fig. 2 and would measure exactly 150 kHz in width. Then an adjacent or an alternate channel signal would be attenuated by an "infinite" amount. In the real world of physically realizable designs, the i.f. response curve appears more like that shown in Fig. 3.
While this band-pass response still shows excellent attenuation of the alternate channel (400 kHz removed from center), here to an extent of about 90 dB, attenuation of signals removed only 200 kHz in frequency from the desired signal are attenuated by a mere 20 dB or so. Therefore, as manufacturers begin to quote adjacent channel selectivity as required by the new standard, don't be too shocked if you see numbers as low as 20 dB or even worse.
Adjacent channel selectivity has taken on new importance in recent years for two reasons. First, the very fact that tuners are more sensitive than they used to be means that many of them can pick up more distant signals, some of which may only be 200 kHz removed in frequency from the strong, local station signal. (The FCC tries to separate station frequencies by 400 and even 800 kHz in given geographical locations, but when stations are many miles apart, the stations may be only one channel width apart in frequency or may even occupy the same frequency.) The second justification for mentioning adjacent channel selectivity has to do with the very popularity of FM in recent years. With so many stations on the air, it is much more likely (especially in populated metropolitan areas) that stations will be found closer together on the FM dial than they used to be. Improving adjacent channel selectivity from 20 to 25 dB may be more significant than the difference between two sets having alternate channel selectivities of 80 and 90 dB.
Required Stereo Performance Disclosures
Even before the advent of the new standard, many manufacturers began publishing some of the stereo performance characteristics of their products. It is no surprise to find statements of separation capability for tuners sold almost from the very first days of stereo broadcasting. Channel separation is, after all, what the public associates most immediately with stereo. As anyone who has ever read our tuner test reports knows, however, separation is usually better at mid-audio frequencies (1 kHz or 400 Hz) than at the frequency extremes, and now manufacturers will have to tell us separation capability at 100 Hz, 1 kHz, and 10 kHz if they wish to comply with the requirements of the new standards.
Some tuner and receiver makers have also seen fit to tell us about harmonic distortion present when the set receives a stereo signal. Invariably, the figure is always worse than for mono, but again, most disclosures have involved the one mid-frequency, 1 kHz.
Now, as in the case of mono, distortion will have to be listed for audio frequencies of 100 Hz, 1 kHz and 6 kHz. The 6 kHz mark was chosen as the highest frequency at which THD must be reported (in mono and stereo) because the harmonics of much higher audio frequencies would fall outside the FM audio pass-band and THD information at such frequencies would be meaningless.
But more important than THD and separation figures for stereo reception are the measurements that will now have to be reported that duplicate all the sensitivity measurements made for mono performance. In other words, "stereo usable sensitivity" must now be listed, as must "stereo 50 dB quieting sensitivity," "distortion at stereo 50 dB quieting sensitivity," and "stereo signal-to-noise ratio at 65 dBf." As you might have guessed, all of these numbers are likely to be "poorer" than those you are accustomed to seeing for mono performance. For example, while "usable sensitivity" may typically be about 2.0 µV (11.2 dBf) in mono operation, it can range from about 5 µV (19.4 dBf) to 10 or more µV (25.4 dBf) for stereo. Even more surprising, most stereo tuners do not reach the 50-dB quieting point until signals strengths of 30 µV (34.9 dBf) or more are applied to the antenna terminals. Small wonder that manufacturers were reluctant to talk about these numbers before the standard was formalized and approved! Whenever stereo signals are received and decoded by a tuner or receiver, frequencies of 19 kHz and 38 kHz are generated or amplified within the circuits of the receiver. While the presence of such signal components at the output of the tuner or receiver would not be audible to humans, high levels of these sub-carrier product signals have been known to affect the quality of tape recordings made of FM programs, since such high frequencies can "beat" with the tape recorder's bias frequency to produce audible tones and squeals in playback of the resultant recording. The ability of the tuner or receiver to attenuate these super-audible frequencies will be listed as "sub-carrier product ratio," in dB, and the higher the number the better. The same thing applies to "SCA rejection ratio" which is the ability of the tuner or receiver to suppress 67-kHz products at the output of the tuner section. This 67 kHz is often used as an additional FM modulated sub-carrier to transmit over the main FM carrier private point-to-point communications, such as background music, special news services, and the like.
While such programming cannot be heard on conventional tuners or receivers (special sets are leased to subscribers of such services), the modulation of the 67 kHz can sometimes be heard as a sort of "swooshing" interference to regular stereo FM programming, and the better the set, the higher its rejection capability of these SCA signals, measured in dB.
Simpler Graphs
Because all signal strengths are now listed in dBf, graphic plots such as those used in Audio's equipment reports relating to tuners and the tuner sections of receivers will be easier to interpret. Referring back to Fig. 1, you will note that the signal strengths (in microvolts) are plotted on log-type graph paper. That is, the distance from 1µV to 10 µV is the same as from 10 µV to 100 µV. Since the dB scale itself is a logarithmic progression, by labeling the horizontal axis in dB, the divisions along the horizontal axis can now be spaced linearly. A typical example is plotted in Fig. 4 and will henceforth be used in all future test reports of FM products. We will continue to add parenthetic notations along the horizontal axis giving a few spot values in microvolts (referred to 300-ohm antenna inputs and based upon the old standard) until our readers become accustomed to the new dBf notations.
The other graphic presentation which we use to describe FM performance-channel separation and distortion versus audio frequency-remains unaltered since it is easier to interpret when a logarithmic horizontal axis is used, in which each octave of the audio spectrum occupies the same horizontal axis distance.
A Typical Complete Disclosure
Table I summarizes all the specifications that the IHF has asked its members to publish for a complete disclosure of FM product performance.
(The standard itself lists a few others which the IHF considers as less important, such as AFC correction factor, AFC offset error, and minimum volume hum and noise.) As an aid in becoming acquainted with the new specifications, we have listed "typical" results for three fictitious tuners-a low priced one of modest performance, a mid-price one of good performance, and a super FM tuner that represents near state-of-the-art performance. Where applicable, we have listed equivalent (old) microvolt values alongside the new, preferred dBf readings.
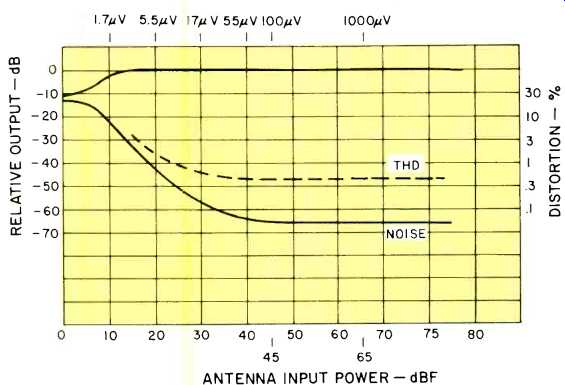
Fig. 4--New quieting and THD curves can be calibrated linearly along both
axes, simplifying interpretation.
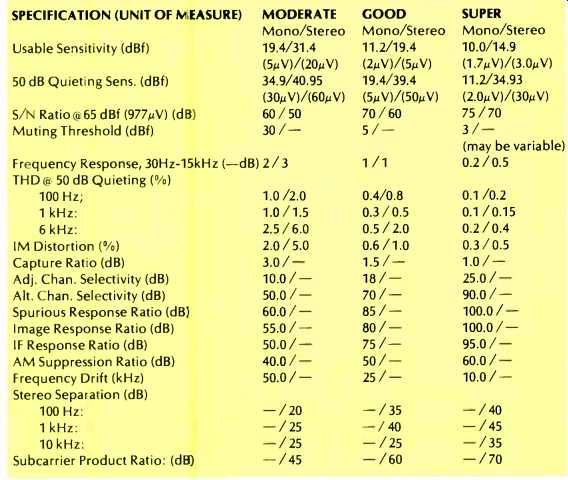
Table I--New required specifications for tuners, and sample results of three
classes of product.
Notes: (-) indicates that no published spec is required for this category, in mono or in stereo, as indicated. (µV) readings in parentheses under dBf readings correspond to equivalent "old" or "terminated" microvolts referred to a 300-ohm antenna input circuit. New power figures (dBf) are based upon "available power at antenna terminals" using "open circuit" microvolts properly terminated with dummy antenna network to match antenna terminal input impedance.
(Audio magazine; Jan. 1976)
Also see:
New IHF Tuner Specs (Jan. 1974)
Time Delay for Ambience by Len Feldman (Dec. 1976)
Reading VU Meters (Sept. 1976)
= = = =