
Manufacturer's Specifications
System Type: Four-way, bookshelf or floor-standing.
Drivers: 12-in. (300-mm), acoustic suspension woofer; 8-in. (200-mm), acoustic-suspension lower midrange in sub-enclosure; 1 1/2-in. (38 mm), dome, upper midrange, and 3/4-in. (19-mm), dome tweeter.
Frequency Response: -3 dB at 39 Hz and 32 kHz.
Sensitivity: 87 dB SPL for 1 watt, 90 dB for 2.38 V, at 1 meter on-axis.
Recommended Amplifier Power: 15 to 250 watts.
Impedance: 4 ohms, nominal; 3 ohms, minimum.
Crossovers: 200 Hz, 1.1 kHz, and 5.5 kHz.
Controls: Two-position ("Floor/ Shelf") switch.
Internal Volume: 1.49 cu. ft. (42 liters).
Finish: Oiled-walnut veneer.
Dimensions: 29 1/2 in. (749 mm) H x 15 1/2 in. (394 mm) W x 10 5/8 in. (269 mm) D.
Weight: 63 lbs. (29 kg).
Price: $1,150.00 per pair.
Company Address: 10 American Dr., Norwood, Mass. 02062.
The AR98LS is designed to be used either as a bookshelf speaker system or as a free-standing floor system. Four drive units, mounted in a vertical array, handle a separate frequency range. An unusual aspect of the design of this system is the use of a unique Dual Dome driver, in which the two highest frequency units are closely spaced on a single magnet structure. The remaining two drivers consist of a 200-mm (8-inch) acoustic-suspension lower midrange driver, which handles the frequencies from 200 Hz to 1.1 kHz, and a 300-mm (12-inch) acoustic-suspension woofer, which takes the spectrum from 200 Hz to well below 40 Hz.
Although not physically very large, these speakers are firmly constructed and are far heavier than their appearance might suggest. They easily pass the Heyser "heel of the hand" test everywhere except near their input connections.
Striking the middle of a speaker-enclosure panel with the heel of the hand will produce a drum tone if the cabinet has resonance in the bass region (which, of course, it should not have). Of some speakers it can be said, after eliciting a musical tone by this procedure, "If you like that note, you'll love this speaker." The AR sounds, and feels, like you are striking a brick wall when you try to elicit a tone from sides, top and back. Only near the rear-panel electrical connectors can you hear a truly distinct tone. The good news is that these speakers are solidly built; the bad news is that they are really too heavy to be safely considered a bookshelf speaker, even though their size might make that possible.
Electrical connection is made to a well-marked, five-way binding-post assembly mounted in a recessed cavity on the rear of the enclosure. A two-position switch, also mounted in this cavity, allows the user to tailor the response of the system for either "Floor" or "Shelf" placement.
The instruction manual supplied with this speaker is brief and well written. It outlines exactly what the user needs to know in order to get the best performance from this system, and it's written in clear English.
Measurements
Figure 1 shows the measured magnitude of impedance which the AR98LS presents to a power amplifier. As stated by AR, the lowest value is 3 ohms. There is very little difference in impedance between the "Floor" and "Shelf" rear-panel switch positions, so the complex impedance plot (Fig. 2) is presented for only the "Shelf" switch selection.
Following a very small change at around 5 Hz, the dominant bass resonance of impedance occurs at 31 Hz. Subsidiary "pigtails" of complex impedance occur at 110, 250, 875, 3,500, and 7,500 Hz. Although low in magnitude, the complex impedance of the AR98LS should offer no unusual or difficult drive requirements for any power amplifier capable of driving a 4-ohm resistive load at full power.

Fig. 1-Impedance for two equalizer settings.

Fig. 2--Complex impedance for the "Shelf" setting of the equalizer.

Fig. 3--Complex admittance for 2 V rms drive with the "Shelf" setting
of the equalizer.
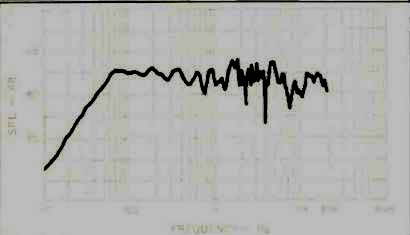
Fig. 4-One-meter on-axis sound output level with a constant drive level
of 2.8 V rms.

Fig. 5--One-meter on-axis phase response, corrected for three air path time
delays; (T) is mean average time of tweeter, (M) is 93-uS delay from (T),
and (W) is 460-uS delay from (T).

Fig. 6--Change in response caused by moving equalizer switch from "Shelf" to "Floor."
The complex admittance plot for a constant voltage drive of 2 V rms is shown in Fig. 3. This is a somewhat new concept in speaker measurement and requires a brief explanation. Figure 3 represents the amount and phase of amplifier current which the AR98LS demands for a constant voltage drive of 2 V rms, the voltage level which corresponds to 1 average watt into the stated nominal impedance of 4 ohms. It is amps per volt of amplifier drive.
Admittance values above the horizontal axis correspond to current demands which lead the applied voltage and represent capacitive components, whereas values below the axis are lagging and inductive. Unlike impedance measurements, which are normally made at very low voltages, this admittance measurement is made at a normal system drive level. The farther away the curve is from the origin in this plot, the harder the speaker is to drive. This speaker is hardest to drive at around 180 Hz, with a slightly lagging current of 5°, and becomes easier to drive at higher frequencies. As things go, it is a fairly easy speaker to drive.
One small consequence of testing at normal drive levels, rather than very small currents, can be seen in the "pigtail" that occurs around 875 Hz. The driving characteristic at 1 kHz is resistive at low drive levels (Fig. 2) and slightly inductive at 1 average watt (Fig. 3). While this effect is totally inconsequential in the drive properties of the AR98LS, it does illustrate the sensitivity of a test method that can be used to ferret out speakers whose drive properties can change with power level and music content. The AR is very good in this respect. Others, which I have tested for admittance change with drive, have been seen to be quite poor.
This is another example that the loudspeaker load can be a dynamic entity, not the simple load resistor which some amplifier manufacturers presume.
The 1-meter, anechoic, on-axis frequency response is plotted in Figs. 4 and 5 for a constant drive level of 2 V rms.
My measurements indicate a free-field response that is down 3 dB at 49 Hz, relative to the average value in the octave from 100 to 200 Hz, and quickly approaches a low frequency asymptotic slope of around 8 dB per octave. The measurement in this particular case is performed at a physical distance of 1 meter, which may account for the discrepancy between my measured -3 dB value and that cited by AR. In any case, the bass response is quite good.
Although the amplitude response is essentially uniform throughout the audible spectrum, the phase response departs from an otherwise linear slope at discrete frequencies which roughly correspond to the crossover frequencies in the AR98LS. This indicates a minor difference in arrival time for the sound from the separate drive units. The phase response measurement (Fig. 5) is corrected for three separate time delays in order to show the major response contribution from the separate drivers. The highest frequency response, from 10 to 20 kHz, arrives first, with the 2-kHz to 10-kHz range arriving 93 µS after the tweeter response, and the lower midrange from 1 to 2 kHz arriving 460 µS after the sound from the tweeter. The mean average phase of each driver is within 30° of an in-polarity convention; this means that, after removing the corresponding time delay from each driver, a positive-going voltage applied to the speaker terminals produces a nearly in-phase, positive-going sound pressure wave at the listening location. Thus, while there is some difference in the arrival time of musical partials, the phase relationships among those partials is essentially maintained by the AR98LS. The rear-panel switch marked "Shelf" and "Floor" produces a very small change in sound in the 200-Hz to 2-kHz frequency range. Figure 6 is a plot of this change in response for the "Floor" position relative to the "Shelf" position. The maximum change is 1.4 dB at 500 Hz, and this measurement indicates why it might be very difficult to sense any difference in response when switching between these two positions.
By contrast, Fig. 7 shows the change in response caused by adding the grille assembly to the design. The scatter from the frame of the grille causes an upper register irregularity whose peak-to-peak variation is higher than that introduced by the "Floor/Shelf" switch. If taste in decor allows, I recommend removing the grille assembly for more accurate sound from this speaker.
The 3-meter room response is shown in Fig. 8. In this case, the AR98LS was placed, as recommended by AR, with its back against a wall such that the middle of the cabinet was approximately level with the listener's ear. The upper curve was measured at a position 3 meters in front of the enclosure, while the lower curve (which was placed 10 dB lower on this plot for clarity of presentation) was for a position at the same distance, but offset 30° so that the speaker was in a conventional left-channel-stereo listening position. The rear-panel switch was set to the "Shelf" position for this measurement and the grille was in place. The measurement of Fig. 8 is the frequency spectrum of the first 13 mS of sound that reaches the listener's location. The vertical spread of sound from these speakers causes floor and ceiling reflections. These first reflections are of sufficient energy to interfere with the direct sound, causing the pattern shown in this measurement. Because of this effect, the AR98LS should definitely not be placed directly on a hard floor or beneath an overhanging shelf. The measurement indicates that, for a typical stereo configuration, this system will require a slight increase in high-frequency drive for a better-balanced direct sound at the listening location.
Figures 9 and 10 show the horizontal and vertical polar energy plots, respectively. Vertical sound is definitely hotter for sound which is directed upward from the geometric center line of the enclosure. This will work well for a floor mounted configuration, in which the listener will essentially be on the principal sound axis, but shelf mounting may cause some directional problems. In particular, if the speakers are placed on shelves, they should be laid horizontal, with the tops (where the tweeters are) nearer the listener's position. Horizontal dispersion is excellent and indicates good stereo lateralization.
Figure 11 shows the measured harmonic distortion of the AR98LS plotted as a function of drive power for the tones of E1 (41.2 Hz), A2 (110 Hz), and A4 (440 Hz). Harmonic distortion rises uniformly with drive power and, with the exception of low-bass second harmonic, remains reasonably low throughout the normal power range of this speaker.
The second harmonic of 41.2 Hz rises uniformly from a value of 0.08% at 0.1 watt to a maximum level of 10% at 60 average watts drive level.
Because the low bass driver handles only the lowest registers in this system, I used the tones of Middle C (262 Hz) and E, to measure bass intermodulation distortion.
Figure 12 is a plot of the cross-modulation in Middle C caused by E1, when both are reproduced at the same drive level. As shown in this measurement, the IM remains quite low throughout the full power range of the AR98LS. At low power levels, the IM is principally composed of a phase modulation of Middle C by E, (vibrato). With increasing power level, there is a gradual reduction of the average level of Middle C, compared to what it should be, caused by the presence of the lower tone. This is coupled with a small increase in time delay of Middle C relative to its lower power value. At 10 average watts, this reduction in level is 0.5 dB, and the time delay corresponds to a 4° phase shift in Middle C. Intermodulation at 40 average watts is composed of 7% peak-to-peak amplitude modulation (tremolo) and about 5° peak-to-peak phase modulation (vibrato) of Middle C by the lower tone.

Fig. 7--Change in on-axis response caused by the grille assembly (0 dB is
system without grille).

Fig. 8--Three-meter room response.

Fig. 9--Horizontal polar energy response.

Fig. 10--Vertical polar energy response.

Fig. 11Harmonic distortion for the musical tones E1 or 41.2 Hz, A2 or 110
Hz, and A4 or 440 Hz.

Fig. 12--Intermodulation addition of E1 or 41.2 Hz of Middle C caused by
in a one-to-one drive ratio.

Fig. 13--Energy-time curve taken at 1 meter with grille in place.

Fig. 14--Energy-time curve also at 1 meter but with grille removed.
Acoustic transfer linearity is exceptionally good. The tones of A4 and Middle C change less than 0.1 dB from their proper level throughout the drive level from 100 mW to over 60 average watts. This indicates that musical timbre will not change with dynamic level. The crescendo test is equally impressive, with inner musical voices retaining their proper level even when speaking under other musical peaks whose level is 20 dB higher. This holds right up to the peak-power handling capability of these speakers.
The 20-kHz, band-limited, amplitude energy-time curves, with and without the grille, are shown in Figs. 13 and 14.
These curves represent the amplitude of the Fourier transform time response corresponding to the 20-kHz bandwidth frequency response shown in Figs. 4 and 5. Hamming weighting is used to compute these curves in order to preserve the highest frequency components without introducing unnecessarily large ripples due to truncating the response above 20 kHz.
The significance of these curves lies in the fact that they represent instantaneous sound energy as a function of time and show the manner in which a sharp pulse of electric energy from the power amplifier may be spread out in time by the loudspeaker.
Without the grille, the basic amplitude ETC of the AR98LS is reasonably tight, with the majority of sound energy arriving within 0.5 mS of the first sound. The sound from the tweeter and upper midrange arrive at very nearly the same time, giving rise to the first peak of energy. The arrival of sound from the lower midrange driver produces the peak at around 3.4 mS, with the lowest components of frequency arriving at around 3.5 mS. The effect of the grille may be seen by comparing the difference in response between Figs. 13 and 14. The grille causes no delay in the arrival time of the first sound from the drivers, but does spread out the response after that first arrival. Other measurements (not presented in this review) made of the phase as well as amplitude of the ETC, and at different listening angles, show that the grille frame is at fault and not the fabric. I recommend that the grille assembly be removed for more accurate sound.
Use and Listening Tests
I preferred the sound of the ARs when placed on the floor and against a wall. My overall impression is that the system produces a reasonably uniform spectral balance. On some material, the upper midrange has, to me, a "tizzy" characteristic that gives a somewhat exaggerated brightness.
Bass is reasonably robust, but somewhat dominant in the registers in the octave below Middle C. Moving the system away from the wall eliminated this dominance, but reduced the deep bass.
I could not honestly tell any difference when the rear panel switch was changed between its "Floor" and "Shelf" positions. I could, however, sense that I did not like the coloration introduced with the grille in place. To me, having the grille in place caused the stereo illusion to be more diffuse than my senses tell me it should be. Most of my listening was done with the grille removed.
Piano is slightly bright, as is female vocal. Overall, however, the spectral balance is reasonably good to my ears.
I was favorably impressed with the ability of this system to belt out clean sound at high level. The lower impedance notwithstanding, crescendos are easily handled with no sense of distress on the part of the loudspeaker.
Stereo imaging is excellent so long as one stays within a reasonably narrow listening area, perhaps plus or minus a meter from the central position between the two speakers.
Imaging progressively deteriorates as one moves away from that area. The sonic illusion which this deterioration produces, to my ears, is that of a reduction in stage depth along with timbral changes of off-center sources.
-Richard C. Heyser
( Audio magazine, Jan. 1985)
Also see:
Acoustic Research 338 Speaker (Nov. 1995)
Acoustic Research Limited Model 2 Preamp (Aug. 1994)
AR M1 Speaker (Equip. Profile, Jan. 1992)
AR (Acoustic Research) MGC-1 loudspeaker (ad, Nov. 1986)
Altec Lansing 511 Speaker (Apr. 1991)
Acoustical Physics Labs Acoustic Image II Loudspeaker (Dec. 1984)
= = = =