by BASCOM H. KING
Before we had computers, audio testing required a lab full of instruments. The personal computer made audio and acoustic testing far more convenient and affordable.
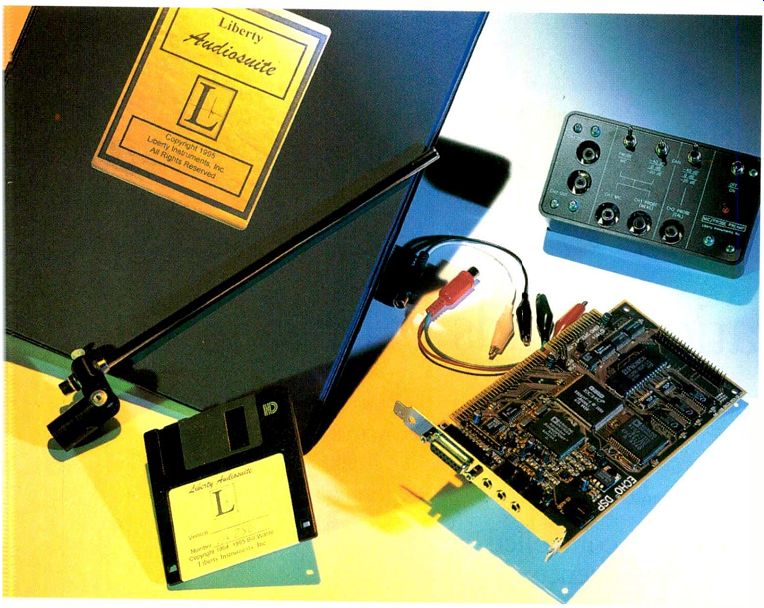
The Liberty Audiosuite (abbreviated LAUD) belongs to the second generation of these PC-based acoustical and audio measuring systems.
The first generation comprises the Crown TEF, LMS, MLSSA, and SYSid systems. (The Audio Precision system, though of this generation, makes different tests.) Each of these uses proprietary digital hard ware-peripheral cards to mount in a PC for MLSSA, SYSid, and LMS and, for the TEF, a separate box that communicates by cable to an interface card in a PC.
The second generation offers more measurement features for less money. This new generation began with Liberty Instruments' IMP, a $275 kit that the company called "a poor man's MLSSA." The IMP was followed by CLIO, from Audiomatica in Italy, which cost about $1,300 with microphone and pre amplifier. The Liberty Audiosuite, with similar features, is only $788.50 including a calibrated micro phone and mike pre-amp! What's more, its component parts (software, PC sound card, mike/probe preamp, and calibrated mike) are available separately if you have applicable hardware or do not need the full system.
The Audiosuite 2.0 performs a very wide range of tests, so many that the manual de-scribes it as five separate instruments: an MLS/FFT analyzer, a sine-wave analyzer, a digital oscilloscope, a spectrum analyzer, and a harmonic-distortion analyzer.
The dual-channel MLS/FFT analyzer uses maximum-length-sequence (MLS) pseudo-random noise or impulse signals to make time-domain measurements, which can then be translated into frequency-do main measurements via fast Fourier trans forms (FFTs). Impulse-based measurements take less time than those involving sine-wave sweeps or discrete sine-wave frequencies but are more sensitive to noise corruption. With a computer at its disposal, the Audiosuite can get around this by aver aging multiple tests, but doing so dissipates much of the speed advantage. The MLS technique, according to Liberty's manual, "mathematically squeezes the equivalent of thousands of test-and-average sequences into one... (converting the results] to an equivalent pulse response...." You can get some pretty sophisticated tests with the MLS instrument. These include "3-D" waterfall plots of spectral de cay over time, energy-time curves (ETCs), and power cepstra (an anagram, not a misspelling, of "spectra") for analyzing signal reflections (such as those from speaker grilles).
The sine-wave analyzer, also dual-channel, is used for more conventional audio measurements and for tests requiring noise immunity at very low frequencies. The Audiosuite can measure both magnitude and phase in its gated or continuous mode. In stead of a continuous sweep, the generator changes frequency in discrete steps. You can use it to make measurements at various frequency points of your choice or in logarithmic or linear frequency increments.
=====================
SOFTWARE SPECIFICATIONS
Digital Resolution: 16 bits.
Sampling Rates: 5.5125 to 48 kHz, in 14 steps.
Usable Frequency Range: 2 Hz to 45% of sampling rate.
FFT Sizes: Maximum Length Sequence (MLS), 256 to 16,384 samples; spectrum analysis, 256 to 8,192 samples.
MLS Lengths: 4,095 and 16,383 samples.
Real-Time Analyzer Resolution: 1/3 octave, 20 Hz to 20 kHz; 1/6 octave, 25 Hz to 20 kHz.
Frequency Resolution: Sampling rate di vided by FFT size.
Input Gain Range: Without optional preamp, up to 22.5 dB in 1.5-dB steps; with preamp, up to 62.5 dB.
Harmonic-Distortion Measurement:
THD for second through ninth harmonics; displays two harmonics per sweep; phase analysis of distortion products.
Output Signals: Sine waves, square waves, white noise, and pink noise.
Oscilloscope Capabilities: Dual-channel; triggerable; up to 21-kHz bandwidth; 16 input sampling.
Hardware and Software Requirements:
PC with 386 or later processor and internal or external math co-processor, 8 megabytes of RAM, VGA or SVGA monitor, mouse, and DSP sound card meeting Personal Sound Architecture specifications; DOS 5 or higher (with mouse driver) or Windows 3.1 or 95.
PREAMP AND MICROPHONE SPECIFICATIONS
Microphone Calibration: Correction data supplied to 21 kHz.
Input Impedance: Probe inputs, 2.2 kilohms; mike input, 2.2 kilohms with 2.5-volt microphone-bias supply.
Gain at 0-dB setting: Probe inputs, 0 dB; mike input, 54 dB maximum.
Probe Input Attenuation: 0,-20, or-40 dB for input levels up to 1, 10, or 100 peak volts at probes.
Prices: Complete system, $788.50; software and manual, $369; upgrade from Version 1 software, $100; preamp, $99; calibrated microphone, $129 (capsule and calibration data only, $23); Echo DSP sound card for ISA bus, $179; probes, $12.50 per pair.
Company Address:
6572 Gretel Court, Middletown, Ohio 45044; phone and fax, 513/755-0252
=====================
The MLS/FFT and sine-wave modes can each be used for net work and impedance analysis and for testing loudspeakers and room acoustics. Results can be smoothed; you have a choice of octave, half-octave, third-octave, sixth-octave, or twelfth-octave averaging. You can use MLS analysis to mark off time limits for some sine-wave measurements-of a speaker's direct response while ignoring room reflections, for example. A speaker's frequency response and complex impedance can be plotted on the same screen, and several Thiele-Small parameters can be measured directly.
The system's dual-channel, triggerable digital oscilloscope mode has a display bandwidth of about 21 kHz, which is suitable for most audio phenomena. This mode uses 16-bit input sampling and is accompanied by an adjustable sine-wave/square wave generator.
The Audiosuite's spectrum analyzer has two operating modes. One is FFT-based spectrum analysis with pink or white noise; in this mode, it can display data with a log or linear frequency scale and can average power responses from several microphone positions. The other mode is third- or sixth-octave real-time analysis (RTA) with constant-percentage bandwidth. You can average multiple RTA measurements and apply standard A-, B-, or C-weighting to the data; you can cascade (multiply) curves to reveal, for example, how an equalization curve would work with a speaker; and you can normalize (divide) curves to show only the differences between them.
The harmonic-distortion analyzer mode can plot the second to ninth harmonics individually (resolvable down to 0.04% or less) as well as total harmonic distortion (THD).
The program has intelligent routines for selecting sampling rate and sample size.
These routines help you minimize measurement times while preserving sensitivity to low-level distortion products down to 0.04% or less. The Audiosuite can also show the phase relationship between the fundamental signal and the distortion products.
When distortion is low, it's hard to see on the fundamental waveform, and showing the distortion components separately gives you little intuitive understanding of the distortion's character. This is where the analyzer's unique Distortion Visualizer comes into play. With it, you can magnify (or diminish) the distortion in a displayed sine wave while maintaining the distortion products' level and phase relationships.
This helps you see the types of distortion produced by the component you're testing.
All of this is complex enough to justify the 140-page instruction manual, so the Audiosuite 2.0 also has built-in Easy Scripts. These include guided and automated test procedures for commonly needed measurements that make it easy to get useful results with minimal experience. The built-in help menus are quite extensive, too.
And if a manufacturer wants to use the Audiosuite for production quality control, he can set pass/fail limits that reveal at a glance whether the component under test is acceptable or not.

---- The preamp accepts the microphone and probe connections.

Fig. 1--MLS impulse response of a two-way loudspeaker over 21 milliseconds
(top) and 2.1 milliseconds (bottom).

Fig. 2--Phase response (top) and frequency response (bottom), derived from
time-windowed MLS impulse at bottom of Fig. 1.

Fig. 3--Low-frequency phase response (top) and frequency response (bottom),
measured in the woofer's near field with a sine-wave signal stepped from
20 to 480 Hz.
The data you acquire with the Audiosuite can be printed out to IBM/Epson-compatible dot-matrix and HP LaserJet II-compatible laser or inkjet printers. The measurements can be saved as bitmap (.BMP) files, as ASCII files for use with other programs, or in compressed file formats that only the put signals. This card must be de signed in accordance with the Personal Sound Architecture (PSA) specification, which calls for an Analog Devices ADSP2115 DSP chip, special control ASICs (application-specific integrated circuits), and on-board memory. Such cards are made by Adaptec, Cardinal, Echo, Orchid, Paradise, and Wearnes. Because these sound cards are still relatively uncommon, Liberty offers the Echo DSP card as an accessory.
The Echo DSP sound card has mike and line inputs, but Liberty Instruments strongly recommends you use its battery-powered mike/probe preamp, which provides gain as well as switchable attenuation (0,-20, and-40 dB) to protect the sound card from high level signals or DC. The preamplifier has two input channels, one for a microphone or test probe and the other for a second probe or a reference signal. Toggle switches select between the probe and mike in puts, set the attenuator, and turn battery power on and off. The pre amp's inputs and outputs are phono plugs; you should not connect high-level signals, such as power amp outputs, directly to them. Instead, use the supplied probes, each of which has a 47.5 kilohm resistor in line with its hot clip-lead. (The Audiosuite's manual also tells how to build your own probes.) You'll need a shielded cable that has two phono plugs at one end and a stereo mini-plug at the other to connect the preamp to the sound card. Liberty Instruments does not supply such a cable, nor does it supply the single phono cable for connecting the mike to the mike preamp. Both cable types are easy to find, although I think the company should supply them.
The nifty microphone's electret capsule is in a thin, foot-long metal tube. A female phono connector is at the end farthest from the microphone element; an adaptor to fit standard microphone stands is included.
I installed Audiosuite 2.0 on my "measurement" computer, a 486 DX33 IBM PC clone with a 100-megabyte hard drive; this machine has LMS, CLIO, and Crown TEF software on it. Installing the Audiosuite went easily enough. Liberty Instruments says the program requires 8 megabytes of RAM, but this is somewhat conservative; it ran fine on my test PC, which has only 4 megabytes. Liberty cautions, however, that the Audiosuite may not run on some 4 megabyte PCs. The first time you run the program, a tone and an on-screen message will indicate that the configuration file can not be found. You must therefore create a configuration file for your computer; one of the program's Easy Scripts will lead you through the process. After that, you probably won't need to do this again.
The graphs in this review are all direct re productions of the 2.0's screens. Data about the signals in the windows is in the line just below the windows, keyed to the on-screen cursors. The boxes at the bottom of each screen show test-system settings.
Figures 1 through 3 illustrate how Liberty's Audiosuite 2.0 can be used to make 1-meter, quasi-anechoic speaker measurements without an anechoic chamber. I made these measurements in my lab. There wasn't enough free space around the speaker and mike to get the best results, so these tests show what you can accomplish with Audiosuite in a less than ideal environment.

------- The Audiosuite's calibrated microphone.

-------- The Echo DSP sound card fits an ISA PC bus slot.
My first step was to measure a speaker's MLS response (Fig. 1). The top window includes about 21 milliseconds of the captured MLS impulse response, which lets in Liberty Audiosuite can read. The program requires only DOS, but it is compatible with Windows 3.1 and Windows 95.
Aside from the PC itself, the Audiosuite's main hardware requirement is a sound card, to generate test signals and digitize input signals. This card must be designed in accordance with the Personal Sound Architecture (PSA) specification, which calls for an Analog Devices ADSP2115 DSP chip, special control ASICs (application-specific integrated circuits), and on-board memory. Such cards are made by Adaptec, Cardinal, Echo, Orchid, Paradise, and Wearnes. Because these sound cards are still relatively uncommon, Liberty offers the Echo DSP card as an accessory.
The Echo DSP sound card has mike and line inputs, but Liberty Instruments strongly recommends you use its battery-powered mike/probe preamp, which provides gain as well as switchable attenuation (0,-20, and-40 dB) to protect the sound card from high level signals or DC. The preamplifier has two input channels, one for a microphone or test probe and the other for a second probe or a reference signal. Toggle switches select between the probe and mike in puts, set the attenuator, and turn battery power on and off. The pre amp's inputs and outputs are phono plugs; you should not connect high-level signals, such as power amp outputs, directly to them. Instead, use the supplied probes, each of which has a 47.5 kilohm resistor in line with its hot clip-lead. (The Audiosuite's manual also tells how to build your own probes.) You'll need a shielded cable that has two phono plugs at one end and a stereo mini-plug at the other to connect the preamp to the sound card. Liberty Instruments does not supply such a cable, nor does it supply the single phono cable for connecting the mike to the mike preamp. Both cable types are easy to find, although I think the company should supply them.
The nifty microphone's electret capsule is in a thin, foot-long metal tube. A female phono connector is at the end farthest from the microphone element; an adaptor to fit standard microphone stands is included.
I installed Audiosuite 2.0 on my "measurement" computer, a 486 DX33 IBM PC clone with a 100-megabyte hard drive; this machine has LMS, CLIO, and Crown TEF software on it. Installing the Audiosuite went easily enough. Liberty Instruments says the program requires 8 megabytes of RAM, but this is somewhat conservative; it ran fine on my test PC, which has only 4 megabytes. Liberty cautions, however, that the Audiosuite may not run on some 4 megabyte PCs. The first time you run the program, a tone and an on-screen message will indicate that the configuration file can not be found. You must therefore create a configuration file for your computer; one of the program's Easy Scripts will lead you through the process. After that, you probably won't need to do this again.
The graphs in this review are all direct re productions of the 2.0's screens. Data about the signals in the windows is in the line just below the windows, keyed to the on-screen cursors. The boxes at the bottom of each screen show test-system settings.
Figures 1 through 3 illustrate how Liberty's Audiosuite 2.0 can be used to make 1-meter, quasi-anechoic speaker measurements without an anechoic chamber. I made these measurements in my lab. There wasn't enough free space around the speaker and mike to get the best results, so these tests show what you can accomplish with Audiosuite in a less than ideal environment.
My first step was to measure a speaker's MLS response (Fig. 1). The top window includes about 21 milliseconds of the captured MLS impulse response, which lets in some echoes along with the speaker's direct signal. The curve in the bottom window is a portion of that impulse, restricted to about 2.1 milliseconds in order to include only the direct signal and exclude room reflections.
(The portion selected for the bottom windows is marked off by cursors on the top window's curve.) Note that the pre-ringing just before the actual impulse response was generated by the Audiosuite's finite-impulse response (FIR) filter, not by the speaker.
In Fig. 2, we see an FFT analysis of this time-windowed portion of the MLS response; phase response is in the top window, and frequency (amplitude) response is in the bottom one. As can be gleaned from the phase response, the two-way speaker in my lab exhibits considerable phase shift, some 360°, in the region of the crossover from woofer to tweeter; this indicates a difference between the arrival times of the woofer's and tweeter's outputs. Figure 2's low-frequency limit is only about 470 Hz.
This is a function of the length of the transformed time record; the longer the time record, the lower in frequency the transformed response can legitimately go.
To assess the frequency range below 470 Hz, I put the mike close to the speaker's woofer and used the Audiosuite's sine-wave mode to take measurements in steps from 20 to 480 Hz (Fig. 3). Had I wished, I could have merged the curves of Figs. 2 and 3 into a wide-range composite covering the speaker's performance over the whole audio range. (This is routinely, and legitimately, done by speaker re viewers.) This is just one of the ways the Audiosuite's merge facility can add, subtract, multiply, and divide curve data; it can even draw curves to help smooth the transition between curves that it is merging.
Figure 4 is an FFT analysis of the full 21-millisecond impulse response seen in Fig. 1. This longer time window gives us a much lower frequency limit than we saw in Fig. 2, about 50 Hz. Because this longer time window does not exclude room reflections, the curve is more complicated than the quasi-anechoic frequency response in Fig. 2.
Nevertheless, you can still make out the basic shape of the Fig. 2 response curve.

Fig. 4-Phase response (top) and frequency response (bottom), derived from
full-length MI5 impulse at top of Fig. 1.

Fig. 5-Phase response (top) and frequency response (bottom) of lab filter
(with bandwidth of 400 Hz to 20 kHz), for stepped sine-wave signal.

Fig. 6-Step response of lab filter, derived from impulse response test (not
shown).

Fig. 7-Oscilloscope-mode display of lab filter's response (top) to 1-kHz
square-wave input (bottom).
What matters in audio testing is usually not the tested component's output, which includes the signal fed to it, but what the component is doing to that signal. I therefore made many of my measurements with the test signals fed to the Audiosuite preamp's "CAL" (reference) input as well as to the component I was testing. In Figs. 1 through 4, I fed the Audiosuite's generator output to the " CAL" in put and ran the Audiosuite in its dual-channel mode. (With this set up, I wasn't measuring just the speaker's response but that of my whole system, including the effects of my preamp's loudness compensation, which I had left on. If I had connected the " CAL" input to the output of the power amplifier or the speaker's input terminals, the effects of the loudness compensation-and any other deviations in my lab system's electronics would have been calibrated out and would not have affected the measurements.) While data is being acquired in this dual-channel mode, the bottom window on your computer screen normally shows the signal being fed to the " CAL" input, and the top window shows the response of the device you're testing. Once the data is acquired, you can switch to single-channel mode and view the selected portion of the impulse response, as seen in all the figures presented here.
For Fig. 5, I switched to the Audiosuite's sine-wave mode to measure the low-frequency response of a noise-measuring filter I use in my lab. This filter's bandwidth is 400 Hz to 20 kHz, with 18-dB/octave slopes. In the top window, you can see almost 270° of phase lead when the amplitude response (bottom window) is well into its attenuation slope, just as you'd expect from such a filter.
For Fig. 6, I returned to impulse mode and used the Audiosuite's processing capabilities to derive the filter's step response, the mathematical integral of impulse response. The step response in Fig. 6, which covers some 5 milliseconds, shows what the level transition of a 100-Hz (or lower) square wave would look like after passing through this filter. What you see is predominantly the low-frequency rolloffs transient response.
The Audiosuite's oscilloscope mode is handy for looking at audio waveforms, within the limitation of its 21-kHz bandwidth. The bottom trace of the dual-trace display in Fig. 7 is a 1-kHz square wave from the Audiosuite generator; the top trace is the same signal after passing through my noise filter. Al though the trace resolution is not the greatest, the 'scope mode is still a useful tool, especially if you don't have a real 'scope on hand.
Next, I turned to the Audiosuite's spectrum analyzer in its RTA mode. Before using the instrument for any other tests, I measured its overall flatness by displaying a third-octave analysis of its own pink-noise source (Fig. 8).

Fig. 8--RTA-mode display of output from the Audiosuite's pink-noise generator.

Fig. 9--Third-octave RTA of A-weighting filter response.
Some rolloff is noticeable at both ends of the audio range, and this lack of flatness may preclude the RTA's use for precise work. I then set the lab noise filter for A-weighting and measured its response; the RTA in Fig. 9 is a reasonable representation of it.
In its distortion-analyzer mode, the Audiosuite can display two curves at one time, either total harmonic distortion and a particular harmonic or two selected harmonics. By overlaying several runs, you can see how a number of harmonics vary with frequency in the device that you're testing. For Fig. 10, I set my noise filter to a bandpass of 20 Hz to 20 kHz and measured its second and third harmonics.

----- One floppy holds the entire Audiosuite program.

Fig. 10--Second- and third-harmonic distortion vs. frequency of filter (with
bandwidth of 20 Hz to 20 kHz).

Fig. 11--THD of 0.016% on 1-kHz sine wave, magnified 1,000 times by the
Audiosuite's Distortion Visualizer.

Fig. 12--Impedance phu5e (top) and magnitude (bottom) of dummy speaker load.

--- An extensive manual is included.
I then tried the Audiosuite's novel Distortion Visualizer, which magnifies the distortion of the device under test, making it easier to see how that distortion affects sine waves. For Fig. 11, I used the Visualizer to boost the 1-kHz distortion from my noise filter by a factor of 1,000.
Figure 12 shows the impedance phase (top curve) and magnitude (bottom curve) of the NHT-built dummy speaker load I now use for testing power amps, measured in the Audiosuite's sine-wave mode. (These results are virtually identical to those I've obtained with the Audio Precision System One, a far more expensive laboratory measurement system.) The readouts just below the display window are of impedance magnitude and phase angle at the two cursor locations. What excites my engineering soul about the Audiosuite's display is that you can move the cursor to any point on the curve and read the impedance magnitude and phase-and the equivalent resistance and inductance or capacitance in both series- and parallel-equivalent forms.
Audiosuite 2.0 is quite a versatile measuring system, and tests of my lab filter and dummy load, whose performance characteristics I know well, demonstrated that it is reasonably accurate. On the downside, I distinctly disliked that in many operating modes the display screen would be blanked and redrawn a number of times in rapid succession. I missed having enough band width to check tweeter and circuit response above 20 kHz; other measuring systems, and by no means just expensive ones, don't have this limitation. And the Audiosuite's microphone inverts polarity, so that a positive pressure in put produces a negative-going output. While I admit that such lofty reference mikes as the B&K 4133 share this problem, I was still annoyed that I had to temporarily reverse speaker connections to get impulse and step-response measurements to read the right way.
But, hey, you can't have every thing, especially at the Audiosuite's price. Overall, the program and its associated hardware worked well. I am quite enthusiastic about Audiosuite 2.0 and would sincerely recommend it, to home experimenters and professionals alike, as a way to get a lot of measurement capability for the money.
(Adapted from : Audio magazine, Feb. 1997)
Also see:
Yamaha DSP-1 Digital Sound Field Processor (June 1987)
Yamaha DSP-A2070 Digital Sound-Field Processing Amplifier (Sept. 1993)
= = = =