The task facing the phonograph preamplifier is a complex one. It must interface properly with high source impedance cartridges, follow the RIAA equalization curve precisely, and be immune from overload and nonlinearity from any signals present at the input, singly or in any combination. Over the last several years detailed information has become available on the range of signals to be expected from cartridges, and both musical signals and undesired warp and distortion signals have been quantified.
Consequences of the undesired signals on the program material may now be studied analytically and criteria set for phonograph preamplifiers. At the other end of the range, noise present in the system has received increasingly more sophisticated treatment, so that now a psychometrically correct comparison may be made between the noise level achieved by design and the theoretical limit.
Sonic Range Signals
In the low audio frequency range from 20 Hz to 800 Hz, the maximum allowable groove velocity is set by the physical amplitude of the groove width.* The criteria is set for LPs by the cutterhead's standard two-mil excursion, which is mechanically limited by stops and practically determined by playing time requirements. When played with a conventional cartridge having 1 mV/cm/sec sensitivity through an RIAA equalized preamplifier with 40 dB of gain at 1 kHz, the output overload level varies with frequency as shown in Fig. 1. For other sensitivies or gain, the curve may be translated up or down as appropriate.
In the range from 800 Hz to ultrasonic, the maximum velocity is set by the geometry of the cutting stylus.
If the maximum velocity limit were exceeded in this range, the back facet of the stylus (required for a smooth groove wall) would interfere with the just-cut groove, causing high distortion by deforming it.
At the audio frequencies above 2 kHz, the playback stylus' dimensions become the dominant mechanical limitation. The maximum curvature of the groove wall cannot exceed the contact radius of the stylus for low distortion. Two curves are shown for this region. For spherical stylii with 0.7 mil diameter, curve 2 applies, and for elliptical stylii of 0.2 mil minor diameter, curve 3 applies. The maximum undistorted playback velocity at high frequencies is extended by the elliptical and other special stylii. Special stylii developed for CD-4 have smaller contact radii with the groove wall and consequent greater high frequency tracking capability-all other things being equal.
The curve in figure 1 then gives the sine-wave low -distortion power response of the cutterhead and cutting stylus, cartridge, preamplifier combination. That is, no single-frequency component of program material may exceed the limits for low reproduced distortion. But, because overload is a peak phenomenon for which all frequency components instantaneously add, the actual spectral output of the preamplifier must run substantially below the sine wave limit line. The amount below is determined by the frequency and phase characteristics of the program material; since the energy distribution of orchestral music falls off with increasing frequency, it is less likely to produce high frequency overload than modern popular or jazz recordings, with their increased high frequency energy content. The overall record level should be adjusted downwards so that every peak fits under the curve if low distortion is important.
In such cases, the overall record level may need to be lowered so much that noise becomes apparent, or the disc plays back at a noticeably lower level than others. Since these are not commercially acceptable alternatives, peak levels beyond the modulation limits do occur at high frequencies. Good data exists for the highest recorded velocities-some "worst case" points are plotted on Fig. 1.6 The 105 cm/sec peak is from a Woody Herman recording, Verve V-8558, side 1, band 2. The 40 cm/sec peak is from the Sheffield Pressure Cooker recording; it is the sibilance on the beginning of side 1 with a center of 11 kHz. Notice that the 80 cm/sec peak imposes a more severe output requirement than the 105 cm/sec peak due to its lower frequency and consequent greater amplification. From this and earlier studies one may draw the conclusion that this high frequency stylus limit called curvature overload is a dominant one to dynamic range with modern program material.
"Low distortion" keeps repeating itself above as a criteria. Small, infrequent high -frequency overload of the system probably goes unnoticed since the high-frequency components are often broad -band, which offers built-in distortion masking. For example, sibilance or cymbal crashes to some degree contain their own source of distortion masking by their nature. Taken too far, however, sibilance overload can turn a clean "s" sound into one akin to rubbing two blocks of sandpaper together; "tish" becomes "tush." Although low distortion reproduction is limited by the cutter and playback stylus' mechanical overload, the preamplifier should be capable of reproducing these overloads (and their corresponding distortion components) cleanly without intermodulation.
Ultrasonic and Infrasonic Signals
In the ultrasonic spectrum, a wide survey of peaks from records has not yet been made. Recently however, information has become available on one well-known "hot" record. The ultrasonic range output is shown in Table 1 and plotted on Fig. 2. A moving-coil cartridge was used for this measurement, since moving-magnet cartridges driving cable capacitance in parallel with the input impedance of phonograph preamps form a low-pass filter which attenuates response in the ultrasonic range. The low source impedance of moving -magnet cartridges provides flat electrical response throughout the ultrasonic region.
While it may be argued that the output from a cartridge at these frequencies probably consists of distortion products that need not be reproduced cleanly, difference tone intermodulation, i.e., distortion products appearing as f2-f1, may become audibly important. Any nonlinearity in the phonograph preamplifier at these frequencies and levels will act as a detector and will thus produce output in the audio range. Difference tone intermodulation of two strong, in-band signals to produce a third has been noticed in preamplifiers. "One word of caution is in order. The preamplifier used to amplify the reproduced signal must be an extraordinarily good one. Even some highly respected amplifiers were found to introduce sufficient IM with high-level signals to partially obscure the contribution of the pickup." Ultrasonic signals could produce similar problems.
The ultrasonic output voltage requirement is ameliorated by the RIAA equalization; still, the preamplifier should clearly be capable of handling signals shown in the table with low distortion.
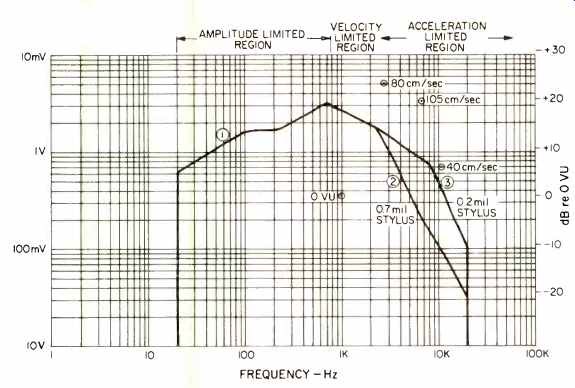
Fig. 1-Sonic cutting limits for low distortion playback. Uses 1 mV/cm/sec
cartridge with 40 dB/1 kHz gain RIAA equalized preamplifier.
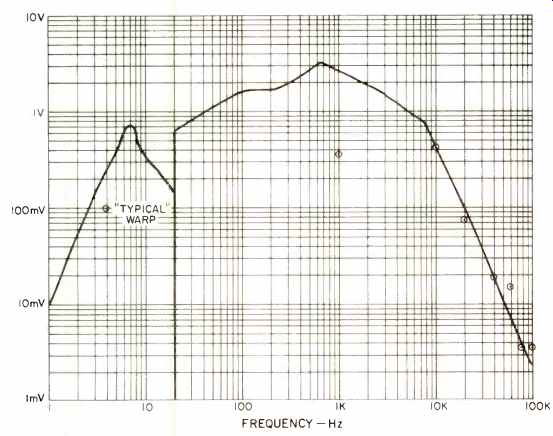
Fig. 2-Ultrasonic and infrasonic range signals measured from records (same
conditions as Fig. 1). No infrasonic rolloff in preamp. Average tone-arm/cartridge
combination, f = 7 Hz, 5 dB peak. Worst warp envelope shown.
The infrasonic range signals are generated by warps on records interacting with tone-arm/cartridge resonance. Fortunately, a large amount of data is available characterizing the warps which occur on commercially acceptable records which met the 1964 N.A.B. standards for record warp.9 The records in the survey were not particularly badly warped. Instead, they were from a conventional collection of records. The effect of much more severely warped records has not been included because of the inherent difficulties of playing such records, e.g. tracking them and their severe warp-induced wow. Most warps occur below 5 Hz (70 percent) with 95 percent occurring below 8 Hz.
The envelope encompassing all the measured warps, corrected for cartridge sensitivity and preamplifier gain and equalization, is shown in Fig. 3 as curve 1. This maximum envelope has not been corrected for the effect of tone -arm and cartridge mass/cartridge compliance peaking and roll -off. Also shown is a single warp at 4 Hz with a peak amplitude of 0.003 in. which was chosen from the data to illustrate a "typical" warp. This warp will be used to project the practical consequences of average warps on system performance. Also shown in Fig. 3 are the overall response of two tone-arm/cartridge systems. The two systems chosen represent quite reasonable best and worst case tonearm/cartridge systems--the "good" system has a resonant frequency of 10 Hz with a Q of 3; the "bad" system has a resonant frequency of 4 Hz with a Q of 3. The criteria of "good" and "bad" are set by the fact that having a resonance where there are few disturbances with a rapid rolloff below is preferable to a resonant system having a peak coincident with many disturbances. Since many more warps lie around 4 Hz than around 10 Hz, the difference in the maximum peaks do not tell the whole story--the statistical distribution of warps must be considered as well. The plotted points above and below the "typical" warp show the range of possible responses to that warp from the best system upwards to the worst. This shows that a 4 Hz warp may be reproduced over a 24 dB span by the range of available tonearm/cartridge combinations. Another interesting phenomena is seen in the difference between undamped systems and ones with pivot or arm damping, such as has been advocated among audiophiles. In the case of the 10 Hz, Q = 3 system, damping of the arm motion relative to the turntable base is seen to substantially increase the output on warps below resonance, even though this moderate degree of damping does not cause the system to mis-track warps. 10 Since this form of damping increases the output in the warp region, it is causing the arm to behave rigidly and therefore there is net motion between the stylus and the cartridge body; the arm is no longer following the warps. This can lead to frequency and amplitude intermodulation effects in the cartridge.
Therefore, damping of optimum systems is not recommended; it may, however, prove useful in a system with resonance in the 4 Hz region. For the composite whole range curve of Fig. 2, an average tone-arm/cartridge system has been used with the typical resonant frequency of 7 Hz with 5 dB peaking.
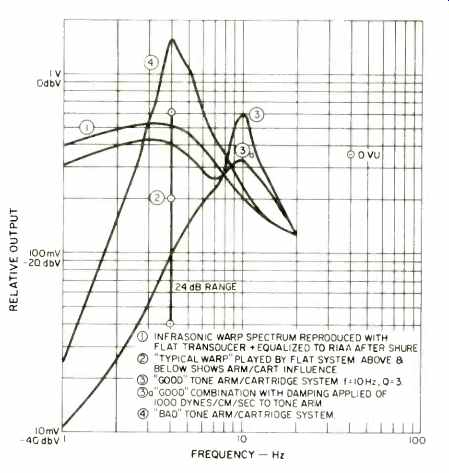
Fig. 3-Infrasonic region responses.
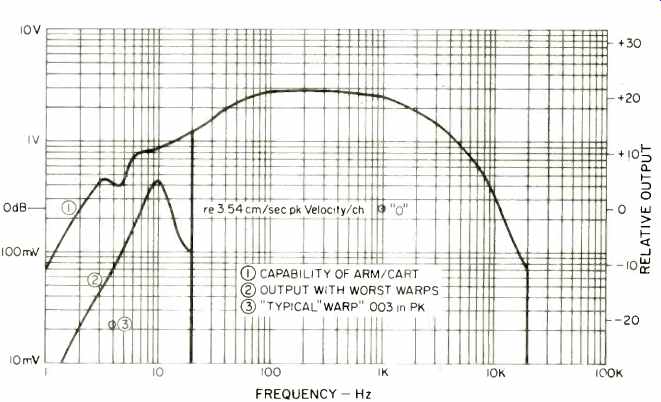
Fig. 4-Trackability vs. frequency referred to output of RIAA equalized preamp.
No infrasonic cutoff. Adjusted for 0.7 mV/cm/sec cartridge sensitivity with
40 dB/1 kHz gain preamp.
Example: Shure V-15 Ill.
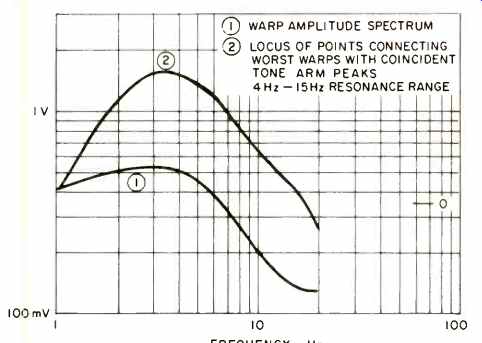
Fig. 5--1 mV/cm/sec cartridge sensitivity, RIAA equalized.
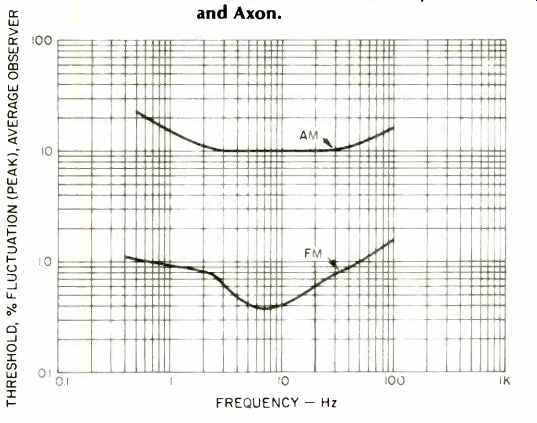
Fig. 6--Subjective pitch and amplitude fluctuation thresholds, after Stott
and Axon.
An example of cartridge/arm limits is given in Fig. 4. The overall playback system trackability has been modified by the frequency response of the tone-arm/cartridge system and by the gain and equalization of the preamplifier. The upper curve shows the capability of this arm/cartridge combination. The lower curve shows the maximum output of this combination from the worst warps. Once again, it should be remembered that there are statistically far fewer warps at 10 Hz than at 4 Hz. The plotted point represents the response of this overall system to our "typical" warp.
Figure 5 gives the warp amplitude spectrum from Fig. 3 as curve 1 while curve 2 represents the maximum output possible at each frequency by combining worst case warps with tone-arm/cartridge systems peaks.
The capability of handling these warp signals from records combined with the range of the possible tonearm/cartridge peaks is a clear-cut performance requirement for phono preamps. And these signals must be handled in the presence of sonic range signals without cross-modulation.
All the information up to this point has assumed no electrical low frequency roll -off in the system. Previous work has shown the usefulness of infrasonic rolloff.
The degree of rolloff was set empirically by observation of loudspeaker cones while playing moderately warped records. Once the criteria were set, group delay effects associated with such rolloff were studied and were shown to be inaudible on program material. The system consequences of passing warp range information to the loudspeakers has not been studied analytically. The presence of very low frequency warp components coincident with program material is expected to produce distortion in loudspeakers.
A loudspeaker driven simultaneously with mid-band and infrasonic signals will produce both amplitude and frequency modulation sidebands around the mid -band signal. Although a spectrum analyzer will read both kinds of modulation equally, the ear is much more sensitive to frequency modulation distortion than amplitude modulation distortion. Figure 6 shows the average threshold of subjects listening to slow piano music played in rooms to pitch and amplitude fluctuations.13 Note that the pitch fluctuation threshold is lowest in the range of 4 to 10 Hz, which unhappily corresponds to the range of warps and tone-arm/cartridge system peaks. Also, the threshold for amplitude modulation is more than an order of magnitude greater than for frequency modulation in this range.
Frequency modulation distortion arises from the Doppler effect. Although the audibility of F.M.D. is debatable on low-frequency program material cross-modulating with high frequency material, 14 the effect of warp range signals with their attendant high excursions intermodulating with mid-range material is worth study.
A simple equation for F.M.D. exists:
d.f. = 0.033 A1F2 (1)
where A1 = amplitude of cone motion, each side of rest, in inches; F2 = modulated frequency, and d.f. = distortion factor in percent. Since this distortion arises from cone motion and is not due to acoustic output, the relationship should hold for infrasonic signals present at the woofer.
It has been shown that the predicted F.M.D. occurs in loudspeakers by separate measurements of AM and FM sidebands. Since this problem quickly becomes overpowering if one tries to examine all possible combinations of loudspeaker, playing level, system rolloff, etc., a reasonably chosen example seems in order. A good acoustic suspension, two-way loudspeaker, with a 10 in. woofer, was set up in an ordinary listening position in a 2,000 cu. ft. living room. One-third octave noise, centered at 800 Hz, was fed the loudspeaker, and the drive level was adjusted to produce an average 90 dB sound pressure level in listening positions. The noise was then removed and replaced by an 800 Hz sine wave at the same drive level. Various frequencies and amounts of infrasonic signals were superimposed on the 800 Hz tone, representing a range of possible warp conditions assuming no electrical rolloff in the system. The results are given in Table 2. The woofer displacements corresponding with the warps were measured and are shown in the table. Distortion was measured with a spectrum analyzer, and under one set of conditions the AM and FM distortions could be separated due to a sideband null. Equation 1 checked for these conditions indicating that Doppler distortion was present in the amounts predicted by theory.
The percentage of distortion arising from these cone motions on the 800 Hz tone are given in the table. These percentages correspond to the same phenomena as flutter in tape recorders or turntables, but because of the multiplicity of flutter standards in use, they may not correspond with the specified flutter numbers. Specifications weighted to the DIN peak standard should correspond fairly well, however. The threshold for flutter is given in Fig. 6. At 4 Hz, where the worst warp velocities occur, the threshold for an average listener is about 0.4 percent peak. Setting a critical flutter standard at two standard deviations from the mean, so that fewer than 5 percent of listeners will perceive the flutter, yields a criteria of 0.14 percent peak flutter at 4 Hz.
These two flutter criteria are represented in Table 2 by the amount of attenuation required to meet the stated limit.
In order to make the problem manageable, one set of conditions was analyzed to produce the numbers in the table. While this set of conditions represents a reasonable average, different amounts of distortion will occur under other conditions. As the playback level is raised, the cone amplitude increases while the modulated frequency stays constant so the distortion will increase and vice-versa. A one-way speaker will be more susceptible since a wider spectrum will be handled simultaneously and the modulated frequency goes up; conversely, a lower crossover from the woofer to a midrange or tweeter driver will ameliorate the effect. Piano music threshold represents a practical worst case, in other real-world instruments, vibrato in the production of sound will more or less mask flutter sources in the system. In addition, the random nature of warp -induced flutter superimposed on complex musical signals, where the influence of the flutter stops at the top end of the woofer's range, complicates the problem further.
The built-in stochastic nature of the problem, along with these difficulties, prevents an absolute solution to the problem. As may be seen in Fig. 3 and Table 2, the tone-arm/cartridge system has a strong influence on the performance of the system. Infrasonic filtering should not be used as a "band aid" for bad tone-arm/cartridge systems since the bad system is likely to be producing modulation distortion in the cartridge, which no filter can take out. Still, even the best tonearm/cartridge system requires 13 dB of 4 Hz attenuation to make the warps from the survey produce inaudible flutter for 95 percent of the population.
It had been previously supposed that vented box loudspeakers, unloaded below resonance, would exhibit worse distortion on warps due to longer cone excursions on warp signals. This theory was tested on one vented box design. The unit tested had distortion at about the same level as the acoustic suspension design due to a quite stiff driver suspension.
Speakers that exhibit long, uncontrolled motion visible on warp signals should be suspected for their distortion contribution.
=====================

Table 1--Ultrasonic content from a record. Moving-coil cartridge playing
cymbal crash on opening of Sheffield Vol. 3, Lab 1. Ref. 3.54 cm/sec peak velocity
= 0 dB. Direct measurement of cartridge output before RIAA equalization. Measurement
made by Dave Hadaway of DB Systems.

Table 2--Consequences of Infrasonic Drive on F.M. Distortion generation by
loudspeakers. Conditions: Midband output 90dB SPL in 2,000 cu. ft. room; acoustic
suspension 2-way loudspeaker with 1.5kHz crossover.
======================
It is clear from Table 2 that some amount of infrasonic attenuation is desirable in nearly every circumstance. Larger amounts of attenuation are useful to limit the modulation distortion generated in loudspeakers.
However, the practical upper limit on infrasonic attenuation is set by the group delay characteristics of the filter in combination with the tonearm/cartridge system. Ideally, the group delay should be a small fraction of the audible limits. Figure 7 gives the data on limits of audibility and on the standards of the Federal German Post Office and West German broadcasting companies. Also shown is the group delay of the infrasonic filter with and without the influence of a worst case tone-arm/cartridge system.
At 50 Hz the group delay of the playback system is about one-fortieth of the audible limit on program material. This makes mental sense if one remembers that events happening at low frequencies take a relatively long time by definition. The "low-frequency transient" is practically a contradiction in terms. Furthermore, low frequency group delay is unavoidable in high-fidelity systems; the low -end rolloff of the loudspeaker system, combined with the response of the room, will always cause a delay. However, even most of the vented-box system alignments, with their relatively long delays, fall under the limit of perception even when aligned to the relatively high frequency of 50 Hz. And the high-quality acoustic-suspension design used in the distortion experiment adds only about 4 mS of 50 ….
[remained of this article … coming soon...]
Also see: Turntables (Part IV): Arm/Cartridge Resonance (Oct. 1977)
Turntables (Part II) (July 1977)
(Source: Audio magazine, July 1977)
= = = =