by HERMAN BURSTEIN
Equalization is used in many, many parts of the audio chain as a standard practice, and indeed there are several equalization standards which must be followed closely by manufacturers if their equipment is to interface properly with other pieces of gear and with software. While we think of the "normal" response of this gear as "flat," in many cases we are comparing the unit against a standard which is not at all flat. One example of such a standard is the RIAA response curve established by the Recording Industry Association of America for phono stage response in preamplifiers, integrated amplifiers, and receivers.
Broadly defined, equalization is the changing of a frequency band or range upwards or downwards in level, that is, changing its voltage level up or down. The precise industry definitions, which insure compatibility between parts of the audio chain, go much further in their accuracy, specifying exactly what the equalization must accomplish and using terms such as time constant and turnover frequency. A filter is the "how" of this equation, the way in which the equalization is accomplished, and filters are composed of resistors and capacitors, Rs and Cs.
For background, let us review the basics of equalization in home audio equipment tape, phono, and FM. Two essential reasons for equalization are to improve S/N (signal-to-noise ratio), and to compensate for losses in a reproducing medium. Minimization of distortion is a further consideration in deciding how much equalization to apply and at what frequencies.
Industry standards for tape, phono, and FM call for specific playback equalization curves, usually defined in terms of those mysterious µS (microseconds) but also often defined in terms of turnover frequencies (sometimes called transition or corner frequencies).
Without any equalization, record-playback response of a tape would exhibit pronounced bass and treble losses. Factors responsible include the tendency of the output of a magnetic playback head to drop at the rate of 6 dB per octave as frequency declines. Treble losses on the tape are also due to the magnetic phenomenon of self-demagnetization, and due to application of bias in recording; such losses increase with frequency, with reduction in tape speed, with bias; and they vary with tape formulation. Treble losses, usually relatively small, also occur in the record and playback heads.
Therefore, a tape system requires compensating bass boost and treble boost to achieve flat response. Bass boost is supplied largely in playback, and should conform to a standard playback curve stipulated by the industry which curve depends on tape speed. Treble boost is provided largely in recording. There are no standard treble equalization curves because the required treble boost varies with bias and tape formulation. Hence, the industry standard simply requires that recording equalization, when coupled with standard playback equalization, shall produce flat record-playback response within a specified tolerance.
For a given tape speed and tape formulation (ferric oxide, chrome or chrome equivalent, and metal), the industry's choice of a standard playback curve is largely dictated not only by the loss factors described above, but also by the objective of minimizing both noise and distortion.
In the case of the phono disc, a standard amount of bass cut is applied in recording to avoid excessively wide groove excursions, which would limit the amount of recording time and would result in distorted output of the phono pickup at low frequencies. True, the groove excursions could he limited by recording a lower signal level, but this would reduce S/N. Further, to make possible an improvement in S/N, a standard amount of treble boost is applied in recording; an equal amount of treble cut in playback not only restores flat response but also attenuates noise, which is predominant in the treble region.
The simplest case is that of FM, where stations are required to provide a specified amount of treble boost in order to permit an improvement in S/N in the same way as for phono discs. The FM tuner should therefore provide standard treble cut, which restores flat response and reduces noise. Standard treble boost (at the station) and cut (at the tuner) are less for a Dolby signal than for a non-Dolby one, with a view to minimizing distortion due to excessive FM modulation at high frequencies.
Turnover Frequencies
Equalization for a tape deck operating at 7 1/2 ips serves to illustrate the meaning of turnover frequencies.
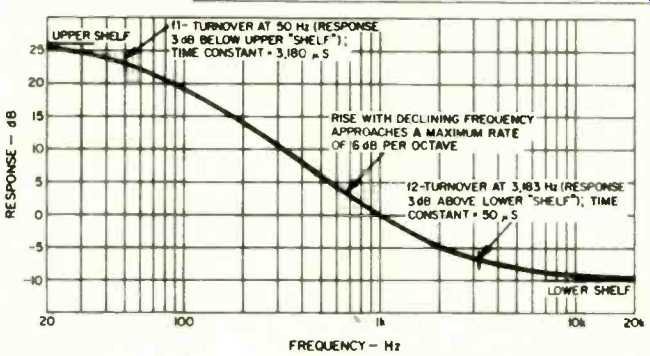
Fig. 1--Standard playback equalization at 7 1/2 ips, before correction for
playback head losses. The 0-dB reference is the level at 1 kHz.
Figure 1 shows standard playback equalization, as prescribed by the NAB and the RIAA in the U.S., for a 7 1/2-ips tape system. This curve may be described as either bass boost or treble cut, depending on whether we read it from right to left or from left to right. It is customary to refer to this, and other tape playback curves, as bass boost. In Fig. 1 bass boost "starts" at 3,183 Hz, where it is 3 dB up. And it "ends" at 50 Hz, where it is 3 dB below maximum.
As frequency declines, the curve rises at a rate approaching 6 dB per octave. Total bass boost is 36 dB. We refer to 3,183 Hz and 50 Hz as the turnover frequencies, respectively f1 and f2, which define the equalization curve. This is coupled with the understanding that the curve rises at a rate approaching 6 dB per octave. For other tape speeds, the turnover frequencies where response is 3 dB above or 3 dB below a stated level may differ from those for 7 1/2 ips. At 3 3/4 ips, bass boost begins at 1,768 Hz (f2) and ends at 50 Hz (f1); at 1 7/8 ips, it begins at either 1,326 Hz (ferric oxide tapes) or 2,274 Hz (chrome, chrome equivalent, and metal tapes), and ends at 100 Hz.
From Turnovers to Time Constants
At the preference of engineers, standard playback curves are more often defined in terms of time constants than turnover frequencies. However, one definition is easily convertible into the other.
The physical meaning of time constant will be explored later. Here we will just state the simple mathematical relationship between turnover frequencies and time constants, enabling the audiophile to readily convert one into the other:
f = 159,155/t1, (1)
t = 159,155/f1 (2)
where f is frequency in Hz and t is time constant in uS.
The equalization curve of Fig. 1 is defined as having time constants of t1 = 3,180 µS and t2 = 50 µS. From Equation 1 we obtain:
f1 = 159,155/3,180
= 50 Hz,
f2 = 159,155/50
= 3,183 Hz.
To take an inverse example, the standard FM de-emphasis curve for non Dolby signals has a turnover frequency of 2,122 Hz (treble response 3 dB down at this frequency, and continuing to decline at a rate approaching 6 dB per octave). Equation 2 converts this into a time constant:
t = 159,155/2,122
= 75 µS.
Table 1 shows the relationship between t and f for the time constants and turnover frequencies generally encountered in home audio systems.
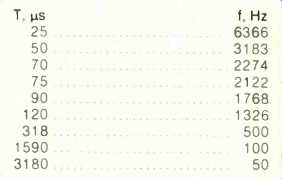
Table 1--Time constants, t, and corresponding turnover frequencies, f.
Equalization Circuits
Tape, phono, and FM playback equalization customarily employ combinations of resistance (R) and capacitance (C) in what are therefore called RC circuits. To illustrate, Fig. 2 shows a simple but basic circuit containing one resistor and one capacitor. This circuit produces treble cut, such as needed for FM de-emphasis.
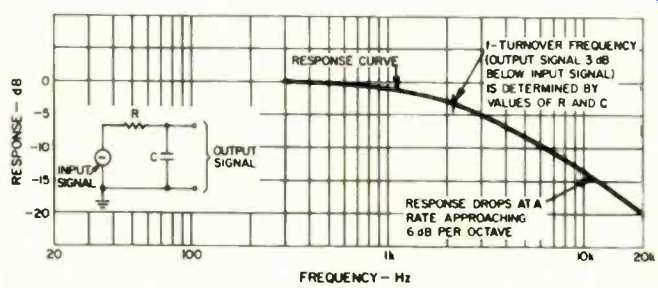
Fig. 2--Treble loss produced by an RC circuit. (It is assumed that the
source impedance of the input signal and load impedance of the output signal
have negligible effects.)
Before continuing we should review the terms impedance, resistance, and reactance. Impedance is a general term, denoting opposition to current flow in an electrical circuit. Resistance is the impedance presented by a resistor, while reactance is the impedance presented by a capacitor (or by an inductor, which will not be further discussed here inasmuch as inductors are seldom used for standard playback equalization, although are often used for other audio purposes such as equalizers, speaker crossover networks, etc.). The combined effect of a resistor and capacitor is called impedance; all types of impedance are measured in ohms.
A resistor presents equal resistance at all audio frequencies, while a capacitor presents decreasing reactance as frequency rises. Therefore C in Fig. 2 behaves more and more like a short circuit of the output signal as frequency rises; in other words, treble response declines. By choosing suitable values of R and C, a designer can achieve a desired turnover frequency at which response will be down 3 dB. In the case of a non-Dolby FM signal, the desired turnover is 2,122 Hz (or time constant of 75 µS). For a Dolby signal, the turnover is 6,366 Hz (25 µS).
By adding one resistor to Fig. 2, the designer can produce bass boost, for example that of Fig. 1. The revised circuit appears in Fig. 3. The added resistor, R2, is much smaller than R1; its purpose is to limit the extent to which the output signal can decline owing to the short-circuiting action of C as frequency rises. Instead of an endless decline in output signal with rising frequency (as in Fig. 2), the decline is halted within the desired part of the audio range. To produce the curve of Fig. 1, the R1, R2, and C components would be chosen to produce turnover frequency f1 at 50 Hz, and turnover f2 at 3,183 Hz; the respective time constants are 3,180 and 50 µS. (It may be noted that the circuit of Fig. 3 is only one of several ways of achieving bass boost.)
Time Constants
Let's refer again to the basic equalization circuit of Fig. 2, which produces treble cut. The turnover frequency at which response is 3 dB down occurs when the reactance of C equals the resistance of R. Why this is so is explained in the final section.
Capacitive reactance in ohms is X, =1 /2 pi fC, where f is in Hz, C is in farads, and pi = 3.1416. At the turnover frequency, since X, = R, we thus have R = 1 /2 pi fC. Transposing C, we obtain
RC = 1 /2 pi f at the turnover frequency.
The time constant, t, is RC. We may simplify by substituting 3.1416 for pi, yielding:
t = RC = 0.159155/f. (3)
In the circuit of Fig. 2, the input signal charges C through R. It can be shown mathematically or by experiment that RC is the time in seconds required for a constant voltage to charge C to 63.2% of this voltage. For example, if R = 10 ohms, C = 1 farad, and 100 volts d.c. Is applied across the series combination of R and C, it would take 10 seconds to develop 63.2 volts across C.
In audio we generally use capacitances far smaller than one farad. A more convenient unit of capacitance is the microfarad (µF)-one millionth of one farad. Since the numerical value of C, and therefore of t, is then increased by a factor of 1,000,000, we must compensate by changing our unit of time from one second to one-millionth second (µS). Thus we obtain:
t = RC = 159,155/f1 (4)
with tin µS and C in µF, but with R still in ohms and f still in Hz.
In audio the time constant is generally expressed as in Equation 4. To illustrate, if the circuit of Fig. 2 consists of a 75,000-ohm resistor and a 0.001-µF capacitor, the RC product is 75, and the time constant is 75 µS. It takes 75 millionths of one second to charge the capacitor to 63.2% of a constant applied voltage.
Of what importance is this to the audiophile? Well... the intent of this article is only to explain, not defend, the use of time constants in defining equalization circuits.
As previously pointed out, standard 7 1/2-ips playback equalization, shown in Fig. 1, can be produced by a circuit such as Fig. 3. Turnover frequency f2 = 3,183 Hz, where response is up 3 dB is determined by R2 and C in Fig. 3. At that frequency the reactance of C must equal the resistance of R2, and the product of R2 x C must be 50, with R2 in ohms and C in µF. If a constant voltage were applied to R2 and C in series, it would require 50 millionths of one second to charge C to 63.2% of the applied voltage.
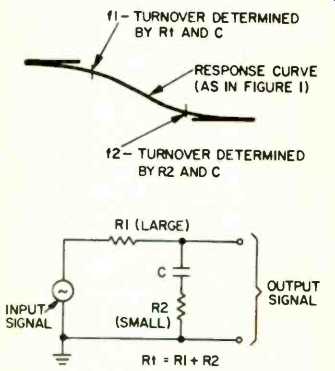
Fig. 3--Bass boost produced by an RC circuit. (Assumptions about source and
load impedances as in Fig. 2.)
R1, C, and R2 are all in series with the input signal. We may refer to R1 + R2 as Rt. Turnover frequency f1-- 50 Hz, where response is 3 dB below maximum is determined by At and C. If a constant voltage were applied to Rt and C in series, it would require 3,180 millionths of one second to charge C to 63.2% of the applied voltage.
Turnover Response
Referring to Fig. 2, we stated earlier that the turnover frequency f occurs when the impedances of C and R are equal. Accordingly, the signal voltages across C and R are equal. It may seem that half of the input voltage appears at the output, namely across C. If this were true, there would be a 6 dB drop in response at f. Actually, though, the drop in response at f is 3 dB.
The proportion of the input signal appearing across C in Fig. 2 depends on the ratio between the reactance of C and the combined impedance of R and C; in short, on the ratio Xc/Z, where Z is the combined impedance. We cannot simply add R and Xc to obtain Z, because the voltages across R and C are out of phase. Instead we must use vector addition (akin to the manner in which we obtain the hypotenuse from the le s of a right triangle).
That is, √Z = R^2 + Xc_2, .
Since Xc = R at turnover, we obtain Z = √Xc^2 + Xc^2
= √2Xc^2 = Xc√2.
At turnover, the signal across C is proportional to Xc/Xc√2 = 1 / √2 = 0.7071. And 0.7071 of the input signal represents a drop of 3 dB.
Referring to At and C in Fig. 3, for the same reason we obtain a 3 dB drop in response at turnover f1, when the reactance of C equals the resistance of Rt.
And for similar reasons we obtain a 3 dB rise in response at turnover f2, when the reactance of C equals the resistance of R2.
A review of high school math is not at all what was intended here; rather, we've gone through some of the basic formulas to show how engineers can determine how their circuits will respond with very good accuracy--before they ever put the circuit on the test bench. Whether or not you ever work out one of these problems for yourself, a basic knowledge of what the circuit designer intends, as well as the tools he actually uses in a circuit, goes a long way towards providing a good understanding of many parts of the audio chain.
(adapted from Audio magazine, Feb. 1982)
Also see: Link |
The Whys and Hows of Cassette Equalization (Jun. 1985)
EQ & NR: Striking A Balance (Aug. 1988)
Tape-to-Deck MATCHING For Best Dolby Tracking (Sept. 1979)
The March of Technology: Analog Tape Home Recording (May 1997)
= = = =