Now that we broadcasters have spent a full decade making FM loud, perhaps it is time to work on the fidelity side of the success equation.
Even though FM has blossomed into a whopping commercial success, many engineers and programmers have just cause to feel that we have not completely succeeded. Unfortunately, the competitive pressures that are an inevitable byproduct of commercial success have forced many stations to engineer for loudness as a first priority.
Although almost everyone goes through the motions of preserving as much audio fidelity as possible, few observers can honestly say that the FM band sounds better today than it did 10 years ago.
Ironically, source and transmission equipment has improved dramatically over the same period, and hardly a home in the United States is without some sort of high-quality FM receiver.
What strange road have we taken, then, that has led us so swiftly into the embrace of economic comfort, while leaving behind much that once was of value? As the FCC continues to withdraw from its role as administrator of technical righteousness, the only hope of reversing the trend lies in the economic pressure that spawned the present situation in the first place. There is good reason to believe that heightened interest in FM fidelity will develop as a competitive factor. The key to understanding this lies in understanding how loudness, at the expense of fidelity, got to be so important.
The proliferation of FM stereo in autos, and the horrendous multipath problems that were generated, resulted in a significant practical requirement for higher average levels and smoother v.f. coverage. FM stations went to tall towers, and competitive processing became the name of the game. During that period, we were rather unsophisticated in our handling of pre-emphasis and filter overshoot problems; therefore, many stations simply overcompressed the audio.
As the number of FM receivers in homes and autos grew rapidly, FM stations began to make a lot of money; the number of well-financed, full-power FMs expanded, thus breeding strong competitive pressures. Programmers demanded "punch," "sock," "dial presence" and other sonic phenomena, all leading to heavier audio processing for higher average levels.
With the advent of the composite clipper, modulation karma was at hand! The peak light could be kept aglow at 100% and the modulation monitor needle hung happily around 95. Today, many FM stations are processed far beyond the point of diminishing returns (in terms of coverage optimization). At some stations, FM audio processing has developed into a bizarre art form.
Each time creative audio-processing designers have introduced new products, they have implored their users to swap some additional level gained for better fidelity. However noble the intent of the audio munitions suppliers, though, a processing war is on and nothing short of an industry-wide processing nonproliferation treaty (with verification) can halt it.
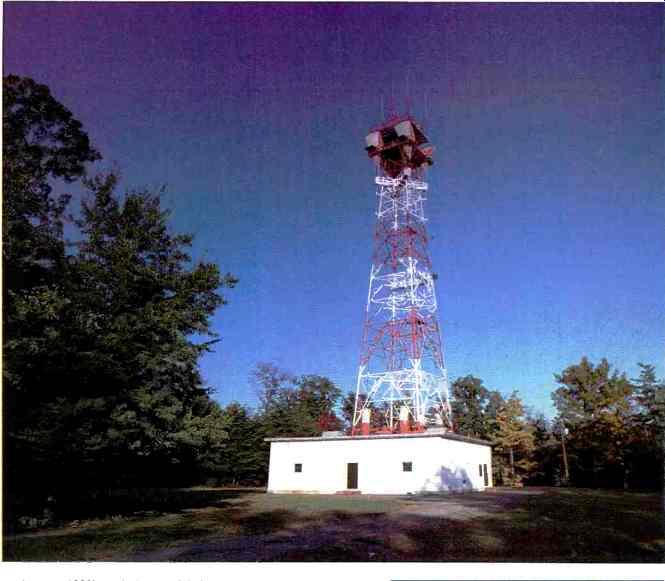
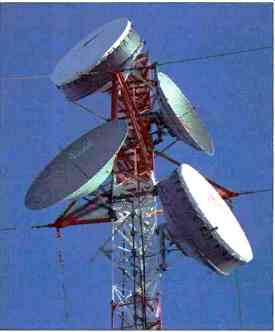
--- Above and top: As the number of FM receivers grew, FM stations
went to tall towers, and competitive processing became the name of the game.
Now that there are enough processors in everyone's hands to effect the universal elimination of audio fidelity several times over, perhaps it's time to disarm. Fortunately, the same equipment that now clips, clamps, and compresses in anger can be turned to peaceful employment without significant loss of level by careful testing and adjustment.
Today, almost everyone on the band is incredibly loud; the next new frontier must be the restoration of lost audio fidelity. After all, the only way an FM station can sound different and distinctive these days is to sound better. It is as simple as that, and with various forms of cable radio and other new competitors just around the corner, broadcast FM needs to sound great.
It is much easier to engineer a loud station than it is to fashion a loud and clean one. Cleaning up the signal without losing level is a much more complicated task than simply turning down the processing. It starts with the cleanest, flattest possible transmission system. In the end, a system design approach, including everything in the chain from tape head or stylus to antenna, will be required.
This process is a sonic adventure requiring both wit and endurance as test instruments become constant companions in the night. Nine-to-five, tweak-by-ear enthusiasts need not apply. The reward for those who persevere, however, is a distinct signature on the air that the station can be proud of. Honestly, there must be engineers out there who are a little tired of rationalizing squashed, clipped audio.
There are a couple of key points that are often missed when stations make their FCC-required proof-of-performance checks. The first is that the proof proves little. A really clean stereo transmission system would maintain all distortion components at 50 dB below operating level (0.3%), which is a far cry from the 2%-and-greater FCC specs. It used to be fun to speculate about how the FCC would bring its 1930s parameters in line with present day performance capabilities, but those days are gone. Therefore, it is incumbent upon quality-conscious broadcast engineers to be creative and design a meaningful proof routine.
From a technical standpoint, the equipment performance measurements required by the FCC for FM stereo stations are obsolete. For instance, attempting to check high-frequency linearity with harmonic distortion tests at 10 and 15 kHz is pointless. Stereo generators filter the audio above 15 to 17 kHz to protect the 19-kHz pilot, so even the second harmonics of 10 to 15-kHz inputs are also filtered. Under these conditions, the meter is not reading distortion at all, just residual noise.
Remove the input signal and you get the same reading. Performing similar measurements at 50% and 25% modulation makes even less sense, because the reference levels are 6 and 12 dB closer to the noise, so the distortion indications get higher as the input level is reduced. Obviously, these rules were pre-stereo and have never been changed.
There are all sorts of little quirks that render the FCC-required equipment performance measurements (EPMs) of limited value except for compliance purposes. The important point, however, is not how inadequate the required tests are, but what additional testing should be done.
To that end, Broadcast Engineering is proposing a new set of fidelity-oriented objectives. These objectives are not intended to replace the FCC tests, but to supplement the usual proof to ensure state-of-the-art FM fidelity. (BE also plans to expand the program to AM radio, and possibly to television.) Our performance specifications may look tough, and indeed they do describe superlative FM fidelity. They are, however, achievable. Even though the distortion targets suggested may be tighter than the manufacturer's specs on some of the individual links in a system, it is possible for the overall system performance to be better in some respects than the manufacturer's specifications for one of the component parts. First of all, the factory specs are usually conservative enough to accommodate production variations, so typical performance is generally better than the specification.
Also, distortion figures in a complex system are not usually additive, although they can be, and the weakest link generally sets the overall system performance limit. Frequency response errors can be manipulated to cancel each other, and, fortunately, most FM response deficiencies occur at the extreme high end of the audio band, affecting only a small fraction of an octave. They are, thus, quite inaudible. The point of all this is that station operators should not be discouraged if their stereo generator's distortion spec is equal to or slightly in excess of our system performance target. Even if a unit, when tested by itself, is nudging the factory specification, a call to the manufacturer's engineering department will often produce suggestions for minor adjustments or component swaps to improve performance.
If part of the system is due for replacement, by all means stations should consult the new vendor's engineering department to see what the typical performance figures are before making purchasing decisions. This is especially important when it comes to modulation monitors (precision FM demodulators equipped with accurate meters for noise and for L + R, L R, pilot, SCA and total modulation, plus stereo separation) because some older monitors have rather unimpressive distortion specs. Most broadcast engineers do not have the test equipment necessary to check the modulation monitor independently, so the measured system performance is really the combination of transmission system and demodulator performance. This is an acceptable situation when testing for FCC compliance because the proof limits are so much less stringent than even the worst demodulators.
If we intend to go for all-out fidelity, however, we must know that the monitor demodulator is clean and is not setting the limits of our measurement resolution so loosely that improvements in transmission-system performance cannot be detected. If the old monitor just isn't up to snuff and the factory isn't too optimistic about the unit ever getting down to 0.1% residual distortion and at least a 70-dB S/N ratio, then a new monitor is a must.
It is incredible to see how many stations use FM tuners for audio monitoring at the studio because the signal from the modulation monitor is noisy, and then use the same modulation monitor to make measurements. Alternatively, in some cases, a shiny new high-tech monitor lives in the studio because it's pretty and/or has a smarter peak flasher, while the old monitor does the measuring at the transmitter.
If optimizing the station's fidelity means anything at all, stations must get the best possible demodulator out at the transmitter.
============
Table 1
General test conditions of Broadcast Engineering's proof-of-performance program for FM stations. Note that "superior" performance represents the maximum performance capability of a state-of-the-art FM stereo facility.
"Excellent" performance, although tighter than the FCC numbers, is attainable by almost any properly engineered station having typical equipment.
The following conditions apply to all listed tests: System in stereo mode.
Input signals applied to console line input(s) used for most program sources.
System output sampled and demodulated at transmitter antenna output.
All processing and EQ left in line and adjusted as usual.
Operating level defined as 0 VU or equivalent at console.
The following tests are to be performed under the conditions listed for each
Frequency Response
Conditions
Automatic gain-control voltages switched off, not simply bypassed.
(Unfortunately, not all processors provide this feature; in such cases, use the bypass mode.) Any convenient modulation level between 50% and 100%. Input level as required to maintain reference modulation level.
Response error expressed as deviation of input level required to maintain reference modulation level, compared to the 75-uS characteristic for non-Dolby stations or 25-uS characteristic with Dolby encoding.
Superior Performance
30 Hz to 15 kHz, ± 1 dB 50 Hz to 15 kHz, ±0.5 dB 100 Hz to 10 kHz, ±0.2 dB
Excellent Performance
30 Hz to 15 kHz, ±2 dB 50 Hz to 15 kHz, ± 1 dB 100 Hz to 10 kHz, ±0.5 dB
Distortion Condition
Automatic gain control switched on, input levels as required to produce specific console levels. De-emphasis in.
Superior Performance
At Standard Operating Level: THD = 0.3%, 30 Hz to 7.5 kHz
[MD = 0.3%, 60 Hz and 7 kHz, mixed in a 4-to-1 ratio
At Operating Level Plus 10 dB: THD = 0.5%, 30 Hz to 7.5 kHz IMD = 0.5%, 60 Hz and 7 kHz, mixed in a 4-to-1 ratio
Excellent Performance
At Standard Operating
Level: THD = 1%, 50 Hz to 7.5 kHz IMD = 1%, 60 Hz and 7 kHz, mixed in a 4-to-1 ratio At Operating Level Plus 10 dB: THD = 1.5%, 50 Hz to 7.5 kHz IMD = 2%, 60 Hz and 7 kHz, mixed in a 4-to-1 ratio
Audio Clipping
Conditions
Same as for distortion tests except that the input level is increased until left/right channel clipping is observed on an oscilloscope at the indicated test frequencies.
Clipping level is defined as that level above operating level (0 VU) required to produce visible clipping as the input level is increased.
Superior Performance
+15 dB from 30 Hz to5kHz
Excellent Performance
+10 dB from 50 Hz to5kHz
Composite Clipping
"A" Conditions
Composite output of the monitor demodulator viewed on an oscilloscope with the transmission system in the stereo mode (and 19-kHz pilot tone on). Clipping level is defined as that level above operating level required to produce visible clipping of the total waveform.
Superior Performance
+15 dB at 1 kHz
Excellent Performance
+10 dB at 1 kHz
"B" Condition
Switch pilot off, view waveform clipping as defined above.
Superior Performance
+10 dB at 7.5 kHz
+5 dB at 15 kHz
Excellent Performance
+10 dB at 7.5 kHz
Noise Conditions
Measured at each stereo audio channel's output, with all processing equipment in the line and adjusted for normal operation.
Noise level is referred to the output level produced by an input signal at 0 VU at the console.
Superior Performance
-60 dB, 30 Hz to 15 kHz, unweighted, de-emphasis in
Excellent Performance
-56 dB, 30 Hz to 15 kHz, unweighted, de-emphasis in
Separation Condition
Measured at each stereo audio channel's output with all processing equipment in the line and adjusted for normal operation.
Superior Performance
40 dB, 400 Hz to 15 kHz 30 dB, 30 to 400 Hz
Excellent Performance
36 dB, 400 Hz to 15 kHz 30 dB, 50 to 400 Hz
=========
Some of the newer monitors are superb audio test instruments and a real investment in a station's on-air sound.
The QEI 691, for instance, features 0.05% THD and IM specs, as well as a 75-dB S/N ratio. It also provides 'scope outputs that generate a spectrum analyzer display for field calibration checks. There are several state-of-the-art monitors, including the new units from TFT which are rated at 0.1% distortion but perform considerably better. These are only two of several models available to broadcasters.
Test Measurements
Before getting into the details of some suggested procedures for optimizing the fidelity of FM systems, a look at our FM broadcast performance targets (Table 1) is in order. Comparing the station's last proof results to these specs is probably an irrational act because our tests are geared toward maximum performance in the real world. We propose two sets of specifications. The first and more stringent set of specs, which we label "superior," represents the maximum performance capability of a state-of-the-art FM stereo facility. Although relatively few stations will provide this level of performance, the targets are achievable, yet challenging goals for those in quest of all-out fidelity. The second set of specs will provide "excellent" fidelity, and, although they are considerably tighter than the FCC numbers, almost any properly engineered station with typical equipment can make the grade. (See Table 1.) Even stations with older equipment should achieve this level of performance if everything is properly maintained and engineered.
In general, our specifications are based upon a balance between inherent FM performance limitations and a pragmatic approach to audio fidelity requirements for system transparency.
A pragmatic approach is necessary because no transmission medium is likely to serve the needs of the super purist who interconnects his audio components with 3-inch Heliax and runs 1/2-inch copper tubing to his speakers. Likewise, it would be futile to suggest performance objectives that defy the laws of physics relative to maximum expected system performance. To be realistic from a business standpoint, we also must consider the real-world requirement for effective average levels.
These factors form the triad of objectivity that drives FM broadcast system design: Practical fidelity requirements, Inherent system limitations, and The need for effective average levels.
The practical fidelity requirements are based upon actual experimental results reported by audio industry experts. Detailed references are provided in the bibliography so that you may review the background data and arrive at your own conclusions as to the validity of the assumptions behind the numbers. Like everything else on earth, audio fidelity does reach a point of diminishing returns. Improvement beyond a certain point will be noticed by too few listeners to be of any practical consequence.
Measurement Conditions
The objective here is to simulate as closely as possible the normal operating conditions of the station. Although we suggest sampling the system at the transmitter output, a high-quality, off air demodulator would be ideal, if available. An off-air demodulator has the advantage of taking transmitter and antenna band-pass irregularities into account. The demodulator must, however, be very flat to avoid invalid results. For stations with a modern, wide-band antenna and near-zero VSWR (voltage standing-wave ratio) indications under static and modulated conditions, an output line tap makes the most sense.
Frequency Response Checks
Absolute frequency response accuracy over the audible band-pass does make an audible difference. Researchers exploring subtle differences in audio amplifier designs have found that errors as small as 0.2 dB can be heard [1, 2]. As a matter of fact, if the levels and frequency responses of good quality amplifiers are made equal, virtually no one can tell them apart in double-blind testing. Therefore, very flat frequency response (strict adherence to the non-Dolby or 25-µS Dolby pre-emphasis) is reflected in our performance objectives.
Because most musical content is in the 100-Hz to 10-kHz range, we call for ±0.2 dB in the "superior" category and ±0.5 dB in the "excellent" classification. There is no reason why an FM broadcast system can't be absolutely flat over this range, and in view of how critical flat response is to overall fidelity, it pays to optimize.
Somewhat looser tolerances are specified at the frequency extremes, in recognition of practical high-pass and low-pass filter considerations relative to subsonic warp components and 19 kHz pilot-filtering requirements. Fortunately, relatively little program material reaches the extremes of the band, so small response variations have less audible impact. As long as frequency dependent limiting is not excessive, a station meeting the "superior" objectives would do extremely well .against program input in a double-blind test comparing subjective frequency response. Most listeners would also have a tough time hearing any difference from the "excellent" parameters.
Although there has been much controversy over whether or not more than 15-kHz response is required for perfect fidelity, many researchers have found little, if any, advantage to extension beyond 15 or 16 kHz, even when the signal source is available for comparison [3, 4]. W. B. Snow's research results of 50 years ago are still valid today [5]. As a matter of fact, I have conducted experiments wherein program material was passed through two cascaded 15-kHz, toroidal, low-pass filters and no audible change could be detected, even with direct-to-disc sources and electrostatic headphones.
A strong case, based on objective research, can be made for FM broadcast frequency response not being an audible limitation, if the response within the pass-band is optimally flat.
This is especially true of stations equipped with late-generation audio processors, which do a superb job of preserving the high end while protecting against overmodulation. Because the super-processors have most frequently been used as heavy artillery in the loudness wars, many users are not aware of how beautiful a psychoacoustic picture these units can paint when used with lower input levels, and a little audio artistry.
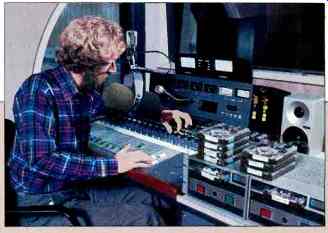
Above: A broadcaster's source equipment--turntables and tape
recorders--may impair FM fidelity.
=========
ONE STATION'S RESPONSE
The following comments were solicited by Audio from Gordon S. Carter, Studio Supervisor for Chicago's WFMT, a leading FM broadcaster committed to the highest standards of broadcast quality. (For background on WFMT, see our February 1983 issue.) While Broadcast Engineering's proposals for improving broadcast audio quality are long overdue, the standards as proposed leave a few problems. Some of these are intimated in the article but are never really dealt with.
The audio specifications given in the proposal are good. The old FCC requirements were easily passed by all but the very worst broadcasters, and tightening the specifications would tend to separate the men from the boys. Broadcast Engineering suggests making these measurements from a high-level console input, but they omit the real problem with many broadcasters, namely, the source itself-tape recorders and/or turntables. Many broadcasters never check their turntables for correct frequency response, wow and flutter, or even channel balance. In fact, many do not even own a good test record.
Tape recorders (including cart machines) receive a bit more attention but frequently do not perform up to their intended specifications. Only a regular check of the performance of these items can insure proper operation. It doesn't matter how good the rest of the system is if the sources do not perform well.
While there is no such thing as "correct" or "incorrect" processing, audio processing is the main cause for bad-sounding stations. Usually the decision regarding the amount of processing falls into the hands of one or two people, and their tastes dictate how the station sounds. They may be targeting a certain type of audience and trying to adjust the processing accordingly. If the listeners are happy, the processing is "right." But if you as a listener do not agree, you are "wrong." Unfortunately, it is impossible to put numbers on processing quality.
While the proposed standards call for measurements of frequency response and distortion, no consideration is made for checking the relative phase accuracy of the two channels. Phase errors can cause problems in mono, yet rarely show up in other measurements. Because much of any station's audience listens in mono on inexpensive radios, some sort of phase check should be included in the tests of the system to ensure mono compatibility.
Another problem that broadcasters have is the wide diversity of equipment used by listeners. While some may have expensive sound systems, others use inexpensive portable radios. Somehow the broadcaster has to keep both types of listener happy. He usually tries to do this with audio processing, which requires a delicate balance and a rather good idea of the type of audience the station has.
With no standardized listener equipment, some stations will always sound "bad" on some systems and "good" on others. No one station can satisfy everyone, either in musical programming or in "musical fidelity." However, each station must please its own audience.
One of the most disconcerting aspects of FM performance specifications is the lack of adequate monitors to measure current broadcast equipment. The BE article suggests a few monitors, but none of these can really measure the performance of a current-generation FM exciter and stereo generator (which produce the composite signal that drives the transmitter). To ensure accurate measurements, the measuring device must have residual specifications considerably better than the equipment being measured. However, there are no monitors currently being manufactured that perform as well in all areas as today's true state-of-the art FM broadcast systems. As has been the case for a number of years, most measurements of an FM system are not measurements of the system, but of the measuring equipment.
Most FM monitors do not perform as well in the areas of distortion, noise and separation as a good FM tuner, though they may cost upwards of 10 times the price of a tuner. A tuner is, however, not a measuring device. All performance standards for FM will be in question until the broadcast manufacturers are able to provide a suitable measuring device whose performance ís better than the equipment being measured.
In spite of the efforts of Broadcast Engineering to encourage FM broadcasters to do a better job, in reality little will change. Those broadcasters who want to provide good audio quality will do so, as they have done in the past. And those who wish to scream at the listeners will also continue to do so. We are very much in favor of improved quality standards for FM, and have no argument with performance measurements. However, as much as engineers would like to be able to measure the sound quality of a station, the fact still remains that the final test of a station's quality is how it is heard. We are broadcasting music, not test tones, and music remains the final test of our systems.
-Gordon S. Carter
=========
Distortion Tests
Our distortion tests are based upon twin objectives: Test-tone frequencies must be kept low enough so that at least the second harmonic of the highest audio frequency input will fall within the system's 15-kHz pass-band. Therefore, no test time will be spent making harmonic distortion measurements at frequencies where the harmonics have been filtered out by the stereo generator, and possibly by the test demodulator.
Virtually everyone who has done an FM stereo proof is familiar with the phenomenon in which the distortion at 10 and 15 kHz is the same whether the test tone is on or off. The test instruments are reading noise.
System performance must be probed at two important levels: At operating level, because that is where most of the program energy is most of the time, and at 10 dB above operating level, to be sure that most program peaks are cleanly reproduced.
When distortion measurements are being made, we have specified that the a.g.c. voltages be switched back on. After all, that's the way stations broadcast, and that's what the listener hears. Excessively fast attack-time constants will produce low-frequency and IM distortion (in older limiter designs), and excessive high-frequency clipping will obviously increase high frequency distortion. The newer limiters, with adjustable limit/clip ratios and low-frequency distortion protection, are an audio engineer's dream.
Although every chief engineer will have his own opinion as to what the optimum processor input level should be, high compression figures will make it more difficult to pass the +10 dB distortion tests. Consider the fact that if 0 VU on the console is right at the threshold of limiting (under these conditions 6 to 10 dB of compression will be indicated with program material), a 7.5-kHz input will be compressed by nearly 12 dB, due to pre-emphasis. If the level is increased to 10 dB above operating level, 22 dB of compression will result. Most systems should still provide fairly low distortion at 22 dB of compression, although the 0.5% "superior" objective might be elusive. If 0 VU at the console is 10 dB above the threshold of limiting, the resulting total of 32 dB of compression at 7.5 kHz might let the signal get into the safety clippers.
There is definitely a point of diminishing returns relative to compression versus loudness, until the generation of distortion components provides loudness with a second breath. We assume here that the folks who subscribe to that school of thought abandoned us after the first paragraph, and we make no apologies for suggesting that clipping should not be routine.
Although the IM tests are relatively impervious to system noise, the THD tests are limited by the noise floor. If the noise is 60 dB below 100% modulation (mono noise measurement), the S/N ratio of either stereo audio channel is about 54 dB (10% pilot plus 45% for one channel leaves 45% remaining for the other). When most modern modulation monitors make the FM left or right channel noise test, 6 dB is added to the actual audio S/N ratio to refer the noise level to 100% modulation, as specified by the FCC rules. Distortion test readings, are, however, susceptible to the noise floor below the recovered left or right-channel signal, thus producing a 6-dB impairment. Actually, the lower figure measured at the deemphasized audio output terminals is what the listener hears.
If a station is just meeting present FCC specs, a 54-dB S/N ratio at the audio outputs would amount to a 0.2% residual reading during the distortion tests. Our 0.3% "superior" and 1% "excellent" performance objectives recognize this fact. If a low-frequency spectrum analyzer is available, the distortion components can be picked out of the noise, and readings down to 0.1% are possible.
It is worthwhile to try and get the distortion products down to the noise level, and the noise level down to-56 to-60 dB at the audio outputs. Although THD and IM tests alone do not check dynamic instability problems like TIM, careful selection of high slew rate components in the audio chain, as well as THD/IM figures down in the noise floor, will leave an audiophile audience impressed.
The Importance of Clipping
The clipping objectives target audio clipping at the audio output, and pilot clipping at the composite output. Either will obviously cause distortion on peaks. The audible consequences of such clipping range from harshness to gross peak distortion. Because peak energy in music falls off rapidly above 5 kHz, and the most irritating distortion components of higher frequencies will fall out of the audible pass-band, the audio clipping tests stop there. At 15 dB above operating level and 8 dB of pre-emphasis at 5 kHz, this is a fairly severe test. The two-tone composite clipping tests are also demanding, but important.
The combination of very low distortion at operating levels and freedom from clipping at high peak levels under actual operating conditions results in audio transmission that is clean and open, with never a trace of harshness.
It is the stuff that long listening spans are made of.
Measuring and Controlling Noise
In many cases, system noise is the most frustrating parameter to bring under control. The opportunities for poor results are legion, and the stories about noisy telephone-company or radio links to transmitters are legend.
Fortunately, many noise problems are in the transmitter link and not in the rest of the transmission system. Over the years, I have experienced more troubles with interference in these links than noise in transmitters.
Many engineers disconnect the phone-company lines or microwave receiver and, upon finding that the noise goes away, conclude that the line or link is bad. A cavity filter on the microwave-receiver antenna input or careful shielding of telephone-company loops can make a world of difference. If modulation-monitor r.f.i. infiltration is suspected, a quick test with a remote receiver will isolate the problem.
For many years, program-source noise has been so much more audible than even a marginal FM-station S/N that many engineers have become complacent about this area of performance. With digital Compact Disc source material proliferating, it's a whole new ball game. To make matters worse, home audio systems with sizzling highs accentuate any hiss that might be present.
Our "superior" objective reflects state-of-the-art transmitter performance (about-66 dB) and assumes that the noise contribution from the audio chain and studio-to-transmitter link is minimal. Referenced to 100% modulation, -66 dB noise at the transmitter means -60 dB out of each audio channel. If the audio chain noise is kept down to 70 dB or less, the overall S/N for the system will be close to 60 dB. The "excellent" objective of 56 dB is just 2 dB better than that needed to make the FCC requirement, but every decibel of noise improvement is tough to come by.
Although 56 to 60 dB of dynamic range doesn't look very impressive in this digital age, it's important to bear two facts in mind. First of all, limited dynamic range isn't a limit at all unless the program input exhibits greater dynamic range [6]. Most program material, in most formats, stays within a 20 dB range most of the time, with short peaks outside this range.
Another key factor to remember is that the apparent loudness continues to increase as the threshold of limiting is exceeded and compression begins.
The limiter may present a peak-modulation barrier, but loudness forges ahead as density increases. Therefore, a station operating at program levels a few dB under the threshold of limiting can present a somewhat greater apparent dynamic range than is electrically possible.
A more important question is whether a 60-dB S/N ratio provides a low enough noise floor at a receiver playing at high levels in the home. This leads to the subjective determination of how high is "high." However, millions of audiophiles have found similar S/N ratios quite acceptable in Dolby equipped tape decks. In practice, if one monitors a well-engineered FM station during a quiet period between program segments, and adjusts receiver volume so that the residual noise is just perceptible in the listening position (assuming full receiver quieting), a considerable din will be generated when the next segment reaches full volume. The hardest part of arranging this demonstration is finding a period of true silence, devoid of higher noise floors from various sources, especially if the console operator tends to leave pots open.
Stereo Separation Requirements
Our proof separation tests are made in the traditional manner, by feeding tones into one channel while measuring the leakage into the other channel.
Our low-end separation objectives are looser than for mid and high frequencies. in recognition of the non-directional acoustic properties of long audio wavelengths and the fact that the bass is usually mixed to center for disc production. In large orchestral recordings employing two-microphone techniques, lower frequencies end up in both mikes, even when not intentionally mixed to mono, because of the long wavelengths involved. In view of this, it seems silly to strive for more low-frequency separation than we have recommended. [Editor's Note: There is, however, no reason to assume that bass will be blended in CD mastering, so improved bass separation may be necessary in the future.] In the middle and high ranges, we look for more separation than the FCC specifies, to preserve stereo imaging.
Program sources rarely provide greater than 30 dB of separation, so we suggest 6 to 10 dB more than that to ensure that the transmission system is not a limiting factor.
Recommended Processing Levels
Obviously, a station can test quite well under static conditions and yet sound mediocre because of excessive processing. Because it is the intent of the BE proof series to propose performance objectives that describe performance in the "excellent" to "superior" strata, completeness requires recommending processing targets. To that end, we suggest specific operating levels below the threshold of limiting (400-Hz tone input to one channel) for various station formats: For classical/ fine arts stations, levels of-6 to-10 dB; for beautiful music/jazz stations, -3 to-5 dB; for album-oriented rock/ adult contemporary stations,-2 to-4 dB, and for rock stations, 0 to-2 dB. Tweaking time constants and optimizing the performance of the audio chain are areas of individual prerogative that can give a system an extra measure of crispness and openness.
One huge benefit of the conservative processing levels and fidelity objectives we recommend is that the transmission system becomes transparent enough to make source and console improvements audible.
Final Thoughts
Achieving the fidelity objectives suggested in the BE proof program means more than simply providing outstanding FM audio. It means getting back into the high-fidelity business, ready to meet the challenges of the digital audio world creeping up on us. FM broadcasters will find improved source signals widening the gap between FM quality and home system quality, unless FM can once again establish itself as a high-fidelity medium.
It may well be that a whole generation of broadcast engineers who were reluctant soldiers in the loudness wars will respond to the call to serve under a new and more rewarding banner. For listeners who may be fortunate enough to have these stations in their area, perhaps Dr. Edwin Armstrong's promise of FM fidelity will not be a promise lost after all.
References
1. Lipschitz, Stanley P. and John Vanderkooy, "The Great Debate: Subjective Evaluation," Journal of the Audio Engineering Society, Vol. 29, No. 7/8 (July/August 1981), pg. 482.
2. Buecklein, R., "The Audibility of Frequency Response Irregularities," JAES, Vol. 29, No. 3 (March 1981), pg. 126.
3. Muraoka, Teruo; Makoto Iwahara and Yasuhiro Yamada, "Examination of Audio-Bandwidth Requirements for Optimum Sound Signal Transmission," JAES, Vol. 29, No. 1/2 (January/February 1981), pg. 2.
4. Plenge, G. H., H. Jakubowski and P. Schoene, "Which Bandwidth Is Necessary for Optimal Sound Transmission?," Preprint No. 1449, 62nd Convention of the Audio Engineering Society, Brussels, March 1979.
5. Snow, W. B., " Audible Frequency Ranges of Music, Speech and Noise," Journal of the Acoustical Society of America, Vol. 3 (1931), pg. 155.
6. Fielder, Louis D., "Dynamic-Range Requirement for Subjectively Noise Free Reproduction of Music," JAES, Vol. 30, No. 78 (July/August 1982), pg. 504.
By DENNIS CIAPURA: Dennis Ciapura is President of Starnet Corp., a San Diego-based consulting firm. This article is adapted from the August and September 1984 issues of Broadcast Engineering, with the permission of Intertec Publishing.
(adapted from Audio magazine, March 1985)
= = = =
Also see:
FMX: Long Distance Stereo, Clean as Mono (May 1986)
11 Outdoor FM Antennas Analyzed (Jan. 1983)
The Problem with FM (March 1985)
Antennas FM -- Try a Rhombic FM Antenna (Jan. 1982)