Walter G. Jung, Mark L. Stephens, and Craig C. Todd
[Portions of this article are adapted from "Slewing Induced Distortion in Audio Amplifiers" by the authors in. The Audio Amateur, Feb., 1977 ( P.O. Box 176, Peterborough, N.H. 03458), part of an article series which is available in book form. Portions were also adapted from the authors' article "Slewing Induced Distortion--Its Effect on Audio Amplifier Performance, with Correlated Listening Results," Audio Engineering Society Preprint No. 1252 from the May, 1977, convention. (See bibliography references nos. 33 and 34.) Copyright 1979 by Walter G. Jung, Mark L. Stephens, and Craig C. Todd. ]
A desirable object for the study of SID is to develop a re liable and predictive test method (or methods) for the presence of this distortion. With our studies, this objective was generally met, and good correlation was observed among several different means of measurement and theoretical calculations [33, 34]. These electrical test methods also appear to correlate roughly with listening tests made on the same devices. The results of these different tests made on a wide variety of IC op amps are described in this part.
THD Tests
It has been often reported that THD test methods are generally insensitive to the detection of TIM distortion [8, 9, 18, 49, 64]. In actuality this is only true for insufficient (or fixed) signal slopes, i.e. when SS<SR. This factor will be demonstrated in the discussion below. A 1-kHz spot-frequency THD test is an example of a test which is (typically) either too low in SS, or if fixed in level, not dynamic at all. An example of a dynamic test in terms of SS is one which moves the SS of the test signal up to and through the amplifier SR; i.e. where the SR ratio is forced to reach and pass unity. It must do this, of course, without amplitude clipping of the output signal, which implies a swept frequency test.
In practice, a relatively straightforward means of exercising an amplifier for SID (or TIM) is to apply a low frequency (about 100 Hz) signal at full rated output voltage, and then sweep the frequency upward until a sudden rise in distortion is noted [16, 33], the 1 percent distortion level coinciding with the amplifier's full power bandwidth.
In op amps, a full output-voltage level sweep test for THD from 100 Hz to 100 kHz has been found to be a sensitive and easily applied test to detect SID, as it exercises the output signal slope-tracking fidelity to a high degree. Unfortunately, this form of test is not always directly applicable to power amps, but it is an excellent one for IC op amps. Reasons which can defeat its validity for some equipment are limited signal bandwidth, which masks true distortion products, and in power amps, output stage stress. For wideband, low-level stages, it can be an excellent test. However, the SID distortion mechanism cannot always be conveniently isolated and quantified, simply because one does not always have direct ac cess and control over amplifier configuration and/or operating condition(s).
It is possible to isolate SID from other distortion sources when the test configuration can be completely controlled. For instance, when testing op amps, this can be accomplished by placing some important restrictions on the test circuit [33, 34, 35, 37, 38]. The test configuration should operate in the inverting mode, to eliminate the common-mode distortion effects which exist when an op amp is operated non-inverting [37, 38]. The magnitude of these effects in some designs can approach that of SID, therefore a non-inverting test is simply incapable of discriminating these two components. Similarly, output stage non-linearity should also be minimized by careful restriction of loading, to 10K or more. These precautions assure us that we are truly measuring only SID and not other additional distortions such as those produced by poor common-mode rejection or output loading. These distortion mechanisms should be evaluated separately [31, 38] and are not the subject of this study. Failure to make certain the test conditions are free from these distortions can lead to questionable results.
A test circuit which takes these points into consideration and is suitable for SID tests is shown in Fig. 9. It is a unity-gain inverter, with the device's frequency compensation adjusted for unity gain, except for special cases as noted. Input output signal levels are full rated-voltage swings of ±10V or 7 V_rms (except as noted), which generally maximizes the output SS. The heavy feedback condition maximizes sensitivity to slewing distortions, since it maximizes the potential error voltage.
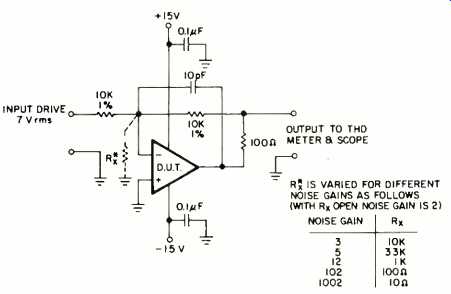
Fig. 9--Test circuit for slew induced distortion.
The device under test (DUT) is operated in this circuit, and a check is made for its actual slew rate. Note that for a given device, the actual slew rate can vary from the data sheet value, therefore results can only be correlated by actual measurement. Ideally, slewing should be symmetric, so the measurement should take note of both plus and minus slew rates. After the SR test, measurements can proceed.
Representative THD performance data on a common 741 IC op amp with a 0.5V/NS SR is shown in Fig. 10. These data indicate in the full output-level curve a characteristic sharp rise from the low frequency (LF) residual level to a 1 percent THD level at 8 kHz (fp), this occurring within only two octaves. For lower output levels, such as for 2V and 1V rms, the 1 percent THD frequency is proportionally higher, in fact by the ratio of amplitudes. In all three cases, the characteristic sharp rise in distortion can be noted as the device's SR is approached by the SS. The 1 percent THD point is reached when the SS becomes equal to the fixed device SR. This can be noted as a relatively constant SS for the three different 1 percent THD intercept points, as is evidenced by the different frequencies at which this point is reached for different levels. SID improves considerably for higher SR devices or compensation conditions which result in higher device slew rates.
In Fig. 11, THD data on a 301A amplifier is shown for various compensation/gain conditions, with all data referred to a 7V rms output level.
The first curve (left) is for unity-gain compensation, where the device SR is 0.9V/uS; the behavior is similar to but slightly better than the 741 for similar conditions. For the X10 compensation curve, the resulting slew rate is 7V/uS, and the performance is much better, with slew limiting not reached until 90 kHz. The improvement is largely due to the X10 improvement in SR and gain-bandwidth product, without any major penalty in LF distortion or noise.
The third curve is for a X100 compensation/gain, and here slew limiting is not at all evident.
Slewing symmetry has a pronounced effect on SID, and SID will only be minimized when the plus and minus slew rates are equal. In some IC amplifier devices, particularly those which use current mirrors, slew symmetry can be trimmed to demonstrate this effect, as shown in Fig. 12.
Here the THD performance of a 301A op amp with an SR of 0.4V/0 (when trimmed) is plotted, and the data indicate an fp of 6.7kHz, which agrees with the theory. For asymmetric slewing, however, the distortion generated is higher, and the break point occurs lower in frequency. This sort of behavior can be noted in many amplifiers, and those in which slewing is inherently asymmetric will not yield as low a distortion as devices which are symmetric.
An aspect of SR asymmetry which illustrates why inverting mode operation is recommended for SID characterization is demonstrated in Fig. 13 and 14. Figure 13 is the full-scale (20 V p-p) slewing response of a 301A amplifier, and, as can be noted, there is a marked difference between plus and minus slopes [21, 22, 37, 38]. This same amplifier was used in the inverting-mode pattern of Fig. 4a (Part I), where it was seen to be nominally symmetric.
Slewing differences between inverting and non-inverting input operating modes show up in THD tests, as is demonstrated by Fig. 14. This data is for the same amplifier operated at unity gain, with curve A for inverting mode, curve B non-inverting. Note that the fp is lower in curve B and distortion much higher at lower frequencies than curve A. This general pattern can also be seen in other devices as well [38].
An interesting demonstration of the effectiveness of SR improvement on THD is contained in Fig. 15. This data is for the 2725, a programmable IC op amp, where the device SR can be adjusted via a bias terminal. Shown here is the resulting THD for SRs of 0.5, 1.6 and 5V/1.S respectively. As can be readily noted, the resulting performance improves directly as SR is increased.
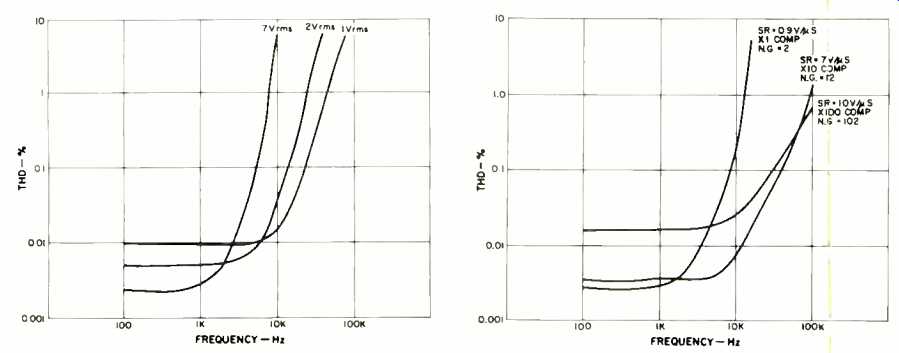
Fig. 10--THD vs. frequency for a 741 op amp operated as a unity gain inverter
at various output levels. Device slew rate is 0.5 V/uS.
Fig. 11--THD vs. frequency for a 301A op amp operated as a unity gain inverter at various compensation/ noise gain conditions. Output is 7 V rms.
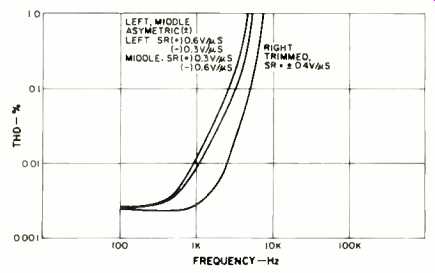
Fig. 12--THD vs. frequency for a 301A op amp operated as a unity gain inverter
with various slewing symmetries, Cc is 33 pF, output is 7 V rms. Offset adjustment
is trimmed for slewing condition shown.
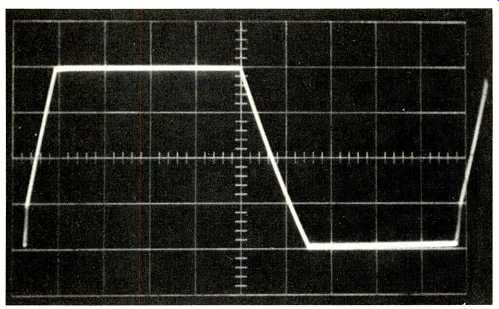
Fig. 13--Asymmetric slewing due to common mode asymmetry in a 301A op amp
operated as a unity gain follower; 20 V p-p.
Since the previous performance examples have indicated that quality is generally directly tied to slew rate, it might seem fair to assume that a very high slew rate is sufficient in itself to achieve this quality. However, this is not completely the case, as is shown by Fig. 16. These data are THD performance for a class of op amps known as "slew enhanced" types [20]. This form of op amp uses a class B (or AB) input stage to dynamically alter (increase) the output current (Ik) and thus boost SR for high SS conditions.
In terms of THD, slew-enchanted units generally show a low SS distortion performance much like a conventional op amp up to a point, but complete slew limiting is prevented.
The data reflects this, showing a general initial rise, then a leveling off in THD. It also shows substantial differences in the performance of the various devices tested. Highest performers are those units which show the combination of good low-level linearity concurrent with high GxBW, e.g. the x10 531, the 530A, and the 538.
As a final example of THD performance, the data of Fig. 17 indicate what effect an adjustment in SR independent of small-signal bandwidth (or feedback) has on SID. For this test, a 318 op amp is used in the circuit shown. The 318 has a very high SR of 50V/ NS with a gain bandwidth of 40MHz, and its performance is sufficiently high (curve A) that the THD measured is essentially the residual of the analyzer used [31, 33, 34, 38].
As the test circuit shows, the current sources and load CL constitute a slew limit mechanism which can be used to experimentally alter SR, independent of both feedback and amplifier bandwidth. Curve B indicates THD for a 6.7V/uS condition, C for a 0.5V/uS condition. Note that the fp for C is 8 kHz, as equation 3 predicts.
This test indicates two things; one that SR is a good general indicator or predictor of high frequency distortion for high SS waveforms. Second, it indicates a pattern of distortion rise in curve C much more sudden than any previously noted. This indicates that the heavy feedback (for the 318, as used here) is successful in suppressing the typical two octave rate of rise noted in other patterns above [33, 53, 60].
At this point, THD performance data has been shown which reflects the key behavior patterns observed in the group of IC samples tested. From this, it can in general be noted (for these tests) that if the device slew rate is 5V/ NS or more, is symmetrical, and does not use nonlinear slew enhancement, the THD performance can be superlative. This will be evidenced by a THD of 0.01 percent or less up to 20 kHz (a 20-kHz distortion-free bandwidth) with an fp of 80 kHz or more. For the best devices, THD can be 0.1 percent or less up to 100 kHz. Of those tested, the best devices in the above terms were: NE5534 (equivalent to TDA 1034), 536, 318, 518, the TL080 and TL070 series, 3140, 2625, 2525, 301A (feed-forward), and the OP-01. Nearly as good were the AD540 and 8007. The common characteristic of all of these amplifiers is their high slew rate and input stage linearity. (No ranking is implied, and other types may be capable of such performance.)
=======================
Sine-Square Test
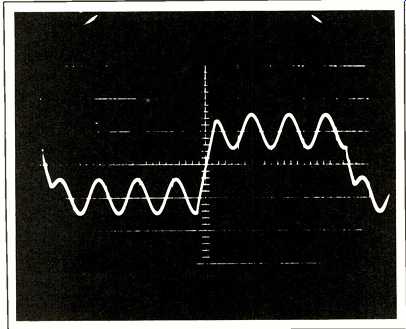
A combined sine-square wave IM test has been proposed by Leinonen, Otala, and Curl as a method of measuring TIM [18]. For this test, the signal is a 3.18-kHz square wave, which has been filtered with a simple one-pole, low-pass R-C filter, at either 30 or 100 kHz, and combined with a 15-kHz sine wave of one quarter the peak-to-peak amplitude of the square wave. The resulting square-wave signal component has a very high slope, which is in theory actually limited only by the low-pass filter. As can be appreciated from this factor, this test has the capability of stressing an amplifier to a high degree for non-linearities related to signal slope and/or slew rate. Figure B-1 is an oscilloscope photo of a 30-kHz band-limited signal (DIM 30).
The output spectrum of the amplifier under test is analyzed for intermodulation products generated by non-linear mixing of the sine and square waves. The rms sum of these products relative to the amplitude of the 15-kHz sine wave is defined as the percentage distortion. This definition of the test does not include the residual distortion products of the square-wave source (which are not a result of the intermodulation under examination). As typically occurring in practice, these spurious products are the even-order harmonics of the square wave (which, of course, should ideally be absent).
If a very high-quality square-wave generator is used, for example with even-order harmonics 90 dB down from the fundamental, even-order distortion resulting from amplifier asymmetry is measurable. In the tests of this study, this type of distortion was included, as sometimes it was the only distortion present in the output spectrum.
It should be noted that a test signal as defined above has a very wide spectrum. For example, even though the square wave is low-pass filtered at 30 kHz, there is still significant energy present up to several hundred kHz.
A very interesting and inherent property of an ideal square wave (with no band limit) is that every individual harmonic of the Fourier series comprising the square wave contributes the same amount to the resulting slope of the square-wave transition. This is because the amplitudes of the harmonics fall in exact, proportion to their rise in frequency, which makes the slope constant for increasing harmonics. Thus, it should be intuitively appreciated that an unfiltered square wave constitutes an extreme test in terms of signal slope. In the ideal case, for a fundamental frequency/amplitude combination resulting in a slope of "x" VMS, the composite slope will be infinite; in a practical case of "n" harmonics, the slope will be (n + 1) (x) VMS.
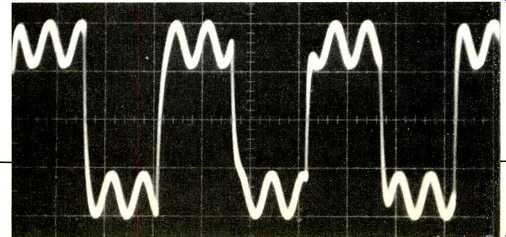
Fig. B-1--Time domain representation of DIM-30 test signal.
This pattern of constant signal-slope contribution per harmonic is not strongly ameliorated by a simple 30-kHz single-pole filter, such as is used in the sine-square test. As a result, a very high percentage of the signal slope is contributed by ultrasonic energy. As a specific case in point, every odd harmonic comprising a 16V p-p, 3.18-kHz unfiltered square wave contributes 0.16V4JS to its slope. When passed through the 30-kHz filter, there will be five square wave harmonics below 30 kHz (f1, 3 f1, 5 f1, 7 f1, 9 f1). These components will contribute slopes of 0.16, 0.15, 0.14, 0.13 and 0.12 VMS, respectively, to the composite test signal slope, while the 15-kHz, 4V p-p sine-wave signal (f2) has a slope of 0.19V/uS. This sums up to a slope contribution of 0.9V/uS for those test signal components below 30 kHz.
The total composite test signal slope for these conditions has a slope of over 3 V/uS. It is therefore clear that over two thirds of the test signal slope is contributed by the square-wave harmonics above 30 kHz, which are not completely filtered. Obviously, this form of test cannot be construed as an "in-band" test, as the bulk of the energy distribution in terms of signal slope is concentrated in the ultrasonic region of the spectrum.
The above points are graphically illustrated in Figs. B-2 and B-3. Figure B-2 is a simple spectral distribution plot of a sine-square 30-kHz band-limit test. This shows the relative amplitude of the individual signal components as they appear at the input to an amplifier being tested. The 30-kHz filter response is also shown for reference, superimposed above the spectral lines of the signal.
The spectrum, as shown here, very closely resembles the conditions used in our sine-square tests, for the 30-kHz case.
As can be noted, the non-ideal even-order products are approximately -90 dB with respect to the fundamental.
The plot of Fig. B-2 is simplistic in the sense that it gives no real appreciation for what is required of the amplifier in terms of SS capability or SR. The graph of Fig. B-3 is intended to convey this.
This figure is simply a graph (or graphs) of the signal slope which results for 30-kHz and 100-kHz band-limit conditions versus p-p operating level. For the case discussed above, the example of a 20V p-p level and 30-kHz band limit is plotted, and the resulting SS is 3.2V/uS, as noted. Were the band limit 100 kHz, the SS would be over 10V/uS (for the same operating level). From the simple relationship shown, an SS can be calculated for any operating level for either case of filtering.
An important point to be noted is the fact that this relationship applies to voltage swing, and it can apply to either preamps (at lower levels) or power amps (at the higher levels). It has an indirect link to power output (since power is a function of load impedance as well as voltage).
Finally, as will be noted from the discussions of the tests in the text, a given amplifier should have an SR greater than the SS generated by a particular test condition. The 3.2V/NS SS case, for example, would require an amplifier with an SR in excess of 3.2V/pS, for distortionless reproduction.
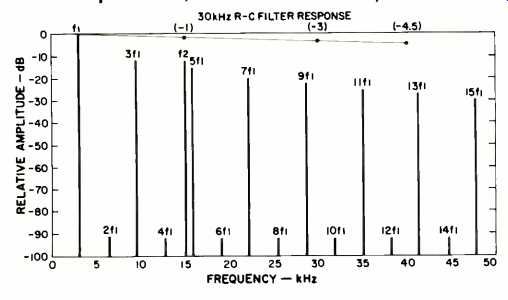
Fig. B-2--Spectrum of sine-square test signal. (f1 = 3.18 kHz square wave;
f2 = 15 kHz sine wave.)
========================
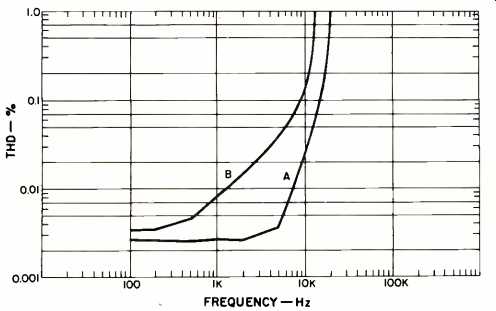
Fig. 14--THD vs. frequency for a 301A op amp at 7 V rms output in inverting(A)
and noninverting(B) modes.
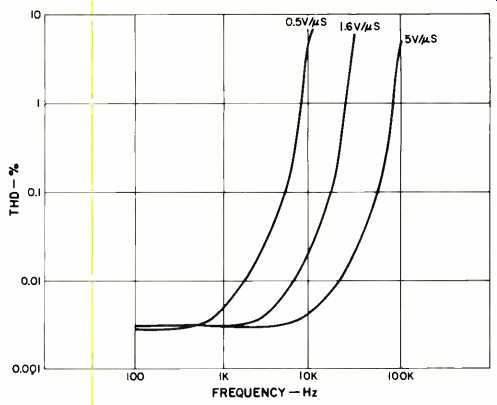
Fig. 15--THD vs. frequency for a 2725 programmable op amp operated as a
unity gain inverter at 7 V rms output at various slew rates.
Two-Tone HF IM Tests
A second series of tests conducted on this sample group of IC op amps was HF two-tone difference IM, hereafter called simply IM. This type of test also shows SID, as evidenced by IM, to be generally governed by amplifier slew rate. For this test a one-to-one mixed, high-frequency tone pair at full output level is swept from 10 kHz to 50 kHz. The difference frequency is maintained at 100 Hz. All tests were performed in the test circuit of Fig. 9.
Figure 18 shows some data which indicate the general relationship of IM performance and SR. These data were taken with the 2725 programmable op amp, with slew rates of 0.5, 1.6 and 5V/uS (condition similar to Fig. 15).
The nature of the IM performance behavior with respect to increasing SS strongly resembles the data based on THD, showing a similar rise as the amplifier SR is approached. This behavior pattern is a characteristic one of IM [14, 33, 34, 51], just as it is for THD. The rise in IM (dotted) at low SS reflects the equipment residual.
Figure 19 shows a composite plot of IM performance by this method, for a variety of different IC op amps. The highest performance devices here show IM distortion at the equipment residual level, while the others show quality generally proportional to slew rate. The notable exceptions to this pattern are the 535, a high-speed slew-enhanced type, and the 356, an asymmetric-slewing unit with appreciable second-order distortion. Each unit has a high slew rate, but the exact method of achieving it prevents optimum linearity from being realized.
The data from the IM tests follow the same general pattern as THD-based data in terms of distortion rise for SR ratios approaching unity. It is less sensitive, though, due to the fact that it measures even-order products and the amplifiers usually (if perfectly symmetrical) generate odd order. This test is quite effective in pinpointing amplifiers which have inherent transfer asymmetries (and thus even-order distortion), such as the 356 type. A two-tone IM test to measure odd-order products (2 f1--f2) would yield more useful data on the symmetrical devices.
It should be noted that an IM test such as this can be more useful for band-limited amplifiers, as it can measure IM products folded downward to lower frequencies by the HF tone pair.
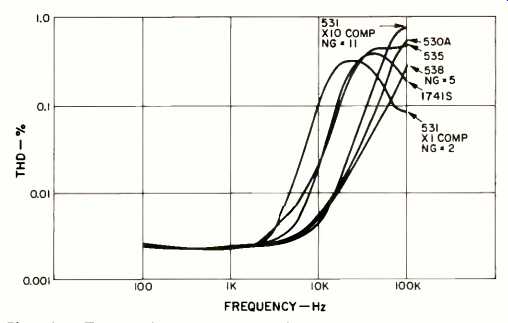
Fig. 16--THD vs frequency for various slew-enhanced op amps operated as
unity gain inverters at 7 V rms output.
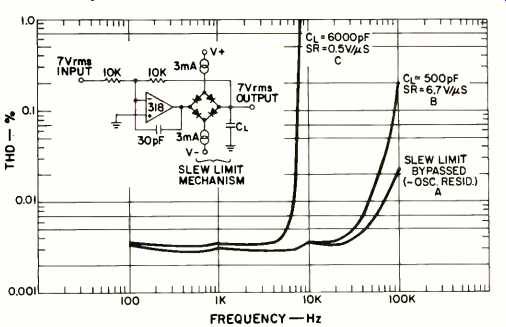
Fig. 17--THD vs. frequency for a 318 op amp with an artificially induced
signal path slew limit.
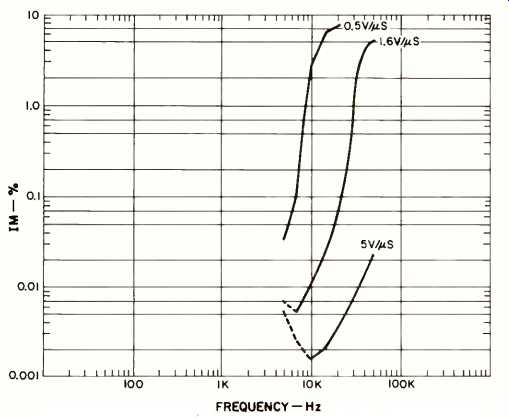
Fig. 18--Two tone IM (mixed 1:1) vs. frequency (Af = 100 Hz, constant) for
a 2725 programmable op amp operated as a unity gain inverter at ±10 V output
for various slew rates.
Sine-Square Tests
A selected sampling of devices which had undergone the THD and IM tests were subjected to the sine-square tests as outlined in reference 18 and described in the sidebar. Like the previous THD and IM tests, the test circuit of Fig. 9 was used. Our results do not directly correlate with those of reference 18, because we are operating the amplifier with no common-mode swing (inverting mode) in order to isolate SID from common-mode distortion. Figure 20 summarizes the results of these measurements, for full output-level tests performed with a 30-kHz square-wave band limit.
The general relationship between Dynamic Intermodulation Distortion (DIM after the terminology of reference 18) and device SR capability is shown by the graph in Fig. 20. This graph shows percentage DIM versus device SR, for all types of devices under one standard test condition. The maximum SS of the input sine-square signal for this case is 3.2V/uS.
Thus, a given device would require an SR of at least this much to pass the waveform without gross distortion. This graph shows that distortion rises above the residual level at around a device SR of 6.5V/uS, which is roughly twice the SS of the input waveform.
This is an important and useful indicator; on the average, a device must have an SR capability of twice the input signal slope to pass signals with negligible distortion. As the SR capability of the test devices falls below 6.5V/uS, the graph is seen to rise linearly to very high amounts of distortion. A best straight line drawn through the data points turns out to have a slope of 3:1 on the logarithmic coordinates. This indicates that DIM varies as the third power of the ratio of the input SS to the device SR. A simple equation that expresses this relationship is
%DIM = K (SS/SR)3 (18)
where K = 0.16 percent for our data.
This relationship is quite a valuable one to audio designers, as it indicates how DIM varies with SR ratio. A very interesting observation which can be made from Fig. 20 is that the DIM test is relatively insensitive to distortion detection, when the SR ratio is less than 0.5. It will, of course, measure gross IM levels for conditions of SS>SR, but this is hardly a practical mode of amplifier operation. Since the distortion mechanism being analyzed by a given test method is the inter-relationship of SS and amplifier SR, the point must be made that an optimum test method should show usable results over a wide range of conditions.
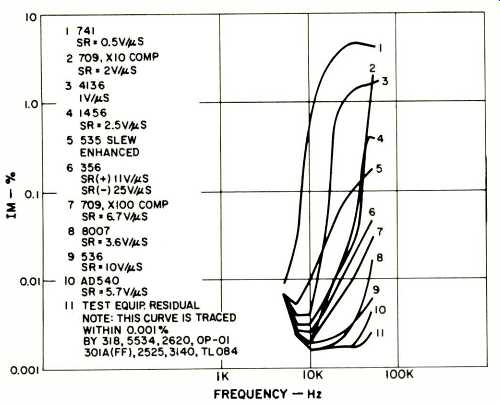
Fig. 19--Ranking of op amps operated as unity gain inverters 310 V output,
by slew rate on basis of two tone (1:1) high frequency IM.
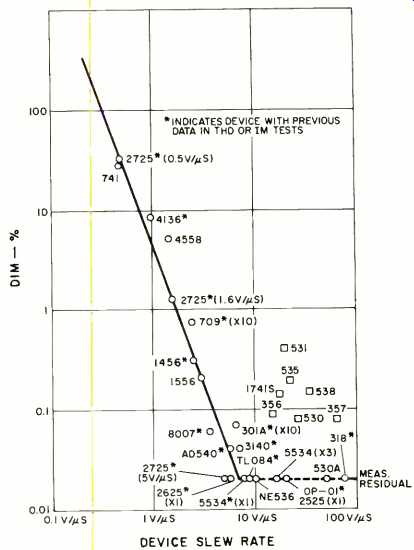
Fig. 20--DIM vs. device slew rate. Test level is 20 V p-p, filtering is
at 30 kHz, input SS is 3.2 V/uS. (*Indicates device with previous data in
THD or IM tests.)
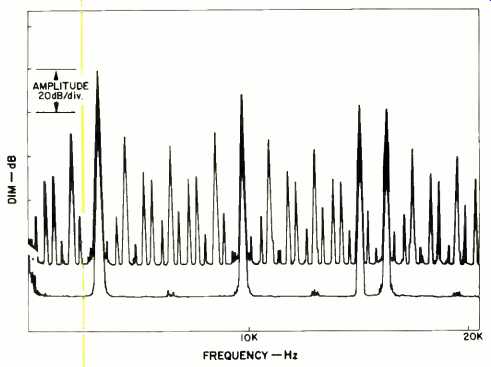
Fig. 21--Comparison of DIM performance of two devices with different slew
rates, both operated as unity gain inverters.
It should also be noted from Fig. 20 that there are devices that do not fit the characteristic relationship between distortion and slew rate. These devices are grouped to the right of the line and show excessive distortion for their high slew-rate capability (compared to the general trend). With the exception of the 356 and 357 devices, all of these op amps are slew-enhanced units. They feature an input-stage transconductance that varies with level to produce rapid slew rates for large signals. Unfortunately, the changing input-stage transconductance of these devices (a non-linearity), gives rise to a crossover type of distortion mechanism. Since, for small signals their SR capability is low, they begin to produce distortion for relatively low SS waveforms. As the SS of the input is increased, the slew capability of the device increases, and it is more capable of producing the required output. Thus, at high SS inputs, the distortion doesn't increase, it merely remains the same percentage as it was under low SS conditions.
We found that under varying input SS waveforms, the output spectrum of the slew-enhanced devices remained fairly constant; only the relative magnitudes of the individual distortion products varied up and down. Increasing the input SS caused some distortion terms to increase and some to decrease, but the magnitude remained fairly constant. It is interesting to compare this behavior with the leveling off of THD observed in the THD tests at high SS conditions.
The 356 and 357 devices also did not fit on the characteristic straight line, but they suffer from a different type of problem than do the slew-enhanced circuits. These units showed only even-order distortion falling on the square-wave harmonics; no other intermodulation products were produced (as did the slew-enhanced devices). The 356 and 357 devices seem to alter the symmetry of the waveform, indicating that an asymmetric nonlinearity is in action. This theory is sup ported by other forms of tests (for example, references 31 and 38). It should be understood that the problem experienced by these particular devices is not inherent in all Bi FETs, or even other FET op-amps, by any means. The 536, an older design, had DIM levels below the resolution of our measurement equipment. Also, the TL080 (and TL071) FET device families are capable of high performance for these tests, as is the LF351 and other devices of the same families.
Devices which are capable of differing slew rates, such as the 2725 and 301A, show DIM performance which improves as device SR is increased. In an experiment to examine the effects of open-loop bandwidth [4, 6, 7, 8, 9, 10, 14] and the degree of feedback as design criteria for low DIM, several specific tests were performed. The results of these are the spectrum plots shown in Figs. 21 and 22.
Figure 21 shows comparative DIM performance for two different op amps for conditions of a 10V p-p output and a 30-kHz band limit (SS=1.6V/uS). The 0.8V/uS device (a 741) clearly shows strong DIM, but the 10V/uS device (a 536) shows a spectrum which is indistinguishable from the input.
Open-loop bandwidth of both devices is less than 20Hz, feedback is nearly 100 dB at low frequencies, and gain-bandwidth is 1 MHz.
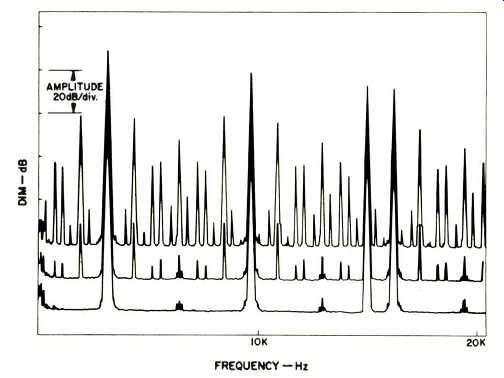
Fig. 22--Comparison of DIM performance for a 2725 adjustable slew rate opamp
operated as a unity gain inverter with input signal slope of 3.2V/uS. Top
curve is SR of 0.5 V/uS; middle is 1.6 V/uS; bottom is 5 V/uS.
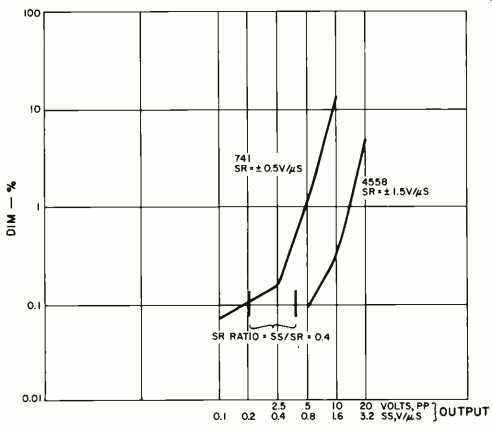
Fig. 23--DIM vs. output level and signal slope for two devices operated
as unity gain inverters with BL= 30 kHz.
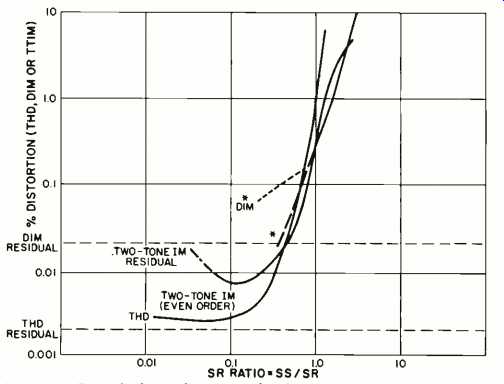
Fig. 24--Correlation of test methods, various forms of distortion vs. signal/device
SR ratio for a 741 with SR = 0.5 V/uS. (*Dotted line on the DIM curve results
if the even order harmonics of the square wave are counted in the distortion
computation. This is very difficult to do since an extremely high quality
square wave generator is required. The proponents of this test recommend
ignoring these components and measuring only the distortion resulting from
the intermodulation between the sine and square waves, in which case a pattern
similar to the dashed line results.)
Figure 22 shows a performance comparison for 20V, 30 kHz (3.2 V/uS SS) band limit conditions, with slew rates adjusted to 0.5, 1.6, and 5V/uS, using the 2725 device. It is clear that DIM is reduced as the SR is increased above that of the SS (or stated another way, as SS/SR is lowered). For these conditions, device open-loop 3-dB bandwidth is for all cases less than 200 Hz, and feedback is nearly 100 dB at low frequencies.
It seems apparent from these tests and others made that the sine-square test performance is strongly affected by SR just as are THD and IM. There appears to be no directly measurable or obvious sensitivity to open-loop bandwidth.
Gain-bandwidth product and loop gain affect DIM performance, as they do THD and IM, in that they affect how close to slew limit one can work before distortion rises.
A further demonstration of how DIM behaves in a manner similar to THD and IM performance is contained in Fig. 23.
These data are based on the common condition of a 30-kHz band limit, but with DIM plotted versus output amplitude.
To show the similarity, two different SR devices are used, 0.5 and 1.5V/uS. At low signal levels DIM is at a very low level; as the output signal level is increased, DIM shows a rapid rise, similar in behavior to THD and IM, as the SR ratio approaches unity.
Comparison of Test Methods
If the three test methods used are compared on a common base, it is possible to see a definite common pattern in their behavior, which is done in Fig. 24, where the horizontal axis is normalized in terms of the ratio of the SS to the SR of the device. By this means, it is possible to see just how the various forms of distortion behave as the device slew capability is taxed, and also to indicate the relative sensitivity of the three test methods.
The THD method shows the widest dynamic range of the three methods and gives the highest percentage distortion at a unity slew-rate ratio, 1 percent. The anomalous low-level slope for the TIM test is due to our detection of some second-order low-level nonlinearities in the 741 tested. This produced a second harmonic of the square wave which we were able to detect in the output spectrum. Since the TIM distortion number is normalized to the 15-kHz sine-wave amplitude, and the square-wave fundamental amplitude is 12 dB larger, the distortion shows up a factor of four larger than it should. Our experiences with the equipment available for these tests was that it was very difficult to detect SID with the sine-square test at signal slopes less than 1/2 that of the device SR (see Fig. 20).
Unfortunately, there is a serious problem with the sine-square test method that is not totally equipment related, one which became apparent after evaluating some of the best opamp circuits. The problem concerns amplifier distortion products which are coincident with the even-order distortion products of the square-wave generator. Theoretically, a square wave should consist only of odd-order harmonics of the fundamental frequency. Practically, every generator will have some slight asymmetry in its square-wave output, which creates small but definitely measurable amounts of even-order distortion. Typical amounts for a general purpose lab square-wave generator are 50 to 60 dB down from the fundamental. Thus, if one were measuring a very good amplifier that had only low-level distortion products falling on the even-order square-wave harmonics, the true distortion of such a case would be masked by the generator, and therefore unmeasurable. The conclusion could then be erroneously drawn that the amplifier was free from transient intermodulation distortion, when in fact the amplifier was producing small amounts of distortion below the threshold of measurement.
One might point out that an amplifier producing distortion products coincident with the square-wave harmonics should also produce other intermodulation products of comparable magnitude, ones that could be readily measured. This simply was not the case in our tests and can be easily demonstrated by testing an asymmetric device such as a 356 or a 530A. Both of these amplifiers show the pattern of only even-order square-wave products, even at the most severe SS TIM test (10V/uS). To accurately measure these two devices, a square-wave generator with even-order products down at least 90 dB is required. In our series of tests, this was realized by carefully monitoring and adjusting the symmetry of our square-wave generator at periodic intervals. Only when the generator's even-order distortion was reduced to these low levels did we begin to see differences between the best op-amp circuits that typically had only even-order distortion products. The magnitudes of these even-order products for the best circuits were as low as only 0 to 6 dB greater than the generator residuals, and in many cases required detailed comparison of the input and output spectrum over several runs to verify that the products were, in fact, actually there.
The two-tone difference IM test is much more sensitive to even-order distortion than the sine-square test. For example, where it was difficult to detect distortion in the 356 with the sine-square TIM test, the IM test found it easily (Fig. 19). It is possible that a two-tone IM test designed to look for odd-order products would show superiority for finding odd-order distortion products. The main attraction of the TIM test is that it allows a quick qualitative look at an amplifier's performance.
THD evolves as a very desirable test method, as it is not only sensitive, but equipment for it is common. However, when a limited bandwidth circuit is being evaluated, some form of IM test becomes necessary.
Listening Tests
IC op amps from the group subjected to the above electrical tests were auditioned in a listening test [33] to assess the degree of correlation between the various forms of electrical distortion and audible defects. These tests were done in mono, in an inverting test amplifier configuration similar to Fig. 9. To sensitize the test for SID, however, the test device was preceded by a preamp to drive it to near full-scale output (and so, maximum SS) with program material. The full scale output was then scaled down and level matched with the original input to within ±0.2 dB. A-B tests were then con ducted on each IC to determine audible degradation. Source material was a variety of phonograph records, using a moving-magnet cartridge.
The results of this test indicate that not only can SID be detected audibly, but also suggest that the ear is apparently sensitive to levels of distortion lower than 1 percent. The results of these tests are summarized in Table II, which also indicates the relative quality weighting.
Before discussing these results, it is highly important that the reader appreciate the basic fact that these listening tests and the quality levels they indicate for a given SR are referred to 10V peak levels. One cannot generally assume these quality levels as absolute, as operation of given (fixed SR) device at other output levels will change the working SR ratio. As a necessary result, distortion will change accordingly, i.e. improve in going to lower levels or degrade in going to higher levels (for those devices capable of higher levels).
The above effects are, of course, simply due to the level-dependent property of SID; it is worst at highest SS or highest SR ratios. It is for this reason that the operating parameters associated with each test device are given here in several different terms, so as to avoid confusion. What the reader is most interested in, of course, is what parameters of a device are necessary to achieve a given quality level.
In terms of the reproduction observed, "A" level quality is that indistinguishable from the source on the most difficult high frequency program material. In general, devices of over 4V/uS slew rates fit into this category. Exceptions were some (but not all) slew-enhanced devices and the asymmetric devices. Quality levels B and C are degradations of a some what subtle nature, as noted. Quality level E and portions of D are distorted in a sense which is gross or obvious.
There appear to be two broad categories of audible SID, one which can be associated with the approach of slew limiting, Category I, and one in which slew limiting actually occurs, Category II.
Category II distortion will occur relatively infrequently on normal program material if the device slew rate is above 0.5V/uS. However, Category I distortion is possible in many instances, and adjectives used to describe it have often been seen in print.
Since the quality levels just described are for the devices and associated slew rates operated at ±10V output levels, some means of relating this to more general conditions is desirable. If the SR for each quality level is divided by the operating voltage level, it can be normalized to a required SR/V figure. This is simply the SR required per peak volt of output to attain a given quality level. For example, "A" quality level was observed for devices which achieved 0.4V/uS/V (or more) performance. This requires a 4V/pS device for 10V (peak) operation or a 0.4V/uS device for 1V (peak) operation.
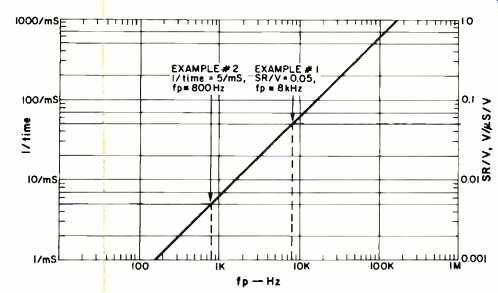
Fig. 25--Relationship between SR/V (1/time) and fp.
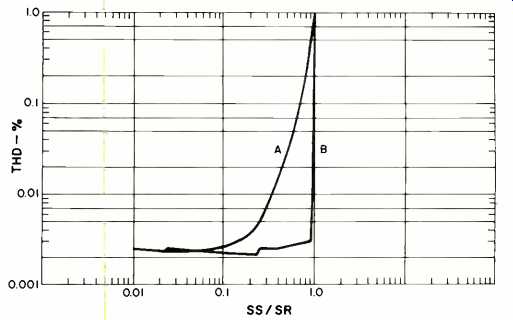
Fig. 26--Comparison of SID for low and high feedback conditions.
The parameter SR/V is related to a power bandwidth, which can be calculated as
fp=(SR/V)(10^6/2 pi) (19)
where fp is in Hz, and SR/V is in V/uS/V.
As can be calculated from (19) or the table, a 0.4V/uS/V SR/V level corresponds to a 64 kHz power bandwidth.
Some authors [62] have expressed the parameter of SR/V in units of 1/time (which may or may not appear to be simplified to the reader). A power bandwidth can also be calculated from this parameter as
fp=("x"/mS) 1/(2 pi) (20)
where fp is in Hz, and 1/time is in 1/mS (x is the variable).
These two relationships (19, 20) are graphically summarized in Fig. 25, with either parameter as an input.
The general observation which can be made from Table II is that obviously distorted reproduction begins to be noticed (level E) at an SR/V level of 0.05V/uS/V, or a power bandwidth of less than 8 kHz. This is plotted as Example 1 in Fig. 24. Other researchers conducting listening tests have arrived at a corresponding distortion level threshold in terms of 1/time, at a level of 5/mS [62] (or 0.005 V/uS/V), which equates to an 800-Hz power bandwidth (example #2).
The level dependence of SID has caused much confusion as to where and when a given SR is a limiting factor. The reader should understand that a 5V/ NS amplifier SR (for example) will most likely not be a limitation for a preamp output, but may be critically so for a power amplifier. The difference is in the voltage swings the two types of amplifiers are called upon to produce without distortion.
As an illustrative example, if we assume a 1.5V power amp sensitivity for full output, this equates to roughly a 2V peak level from the preamp. To produce a 2V peak level in terms of the highest performance of Table II, the 0.4V/ uS/V guide line implies a device SR of 0.4x2=0.8V/pS. This level of performance is met by many devices, for example the popular 4558 or 4559, at 1.5V/ uS.
For the power amplifier, an example of 100W into 8 ohms, this equates to a voltage of 40V peak. Applying the highest performance level again of 0.4V/uS/V, the SR required is 16V/ uS or more.
Hopefully, the above discussion illustrates how SR must be related to operating voltage level to predict quality. It should be appreciated that an SR number quotation by itself is relatively meaningless, if it is not related to operating level.
Also, another point which should be made is that performance simply does not continue to dramatically increase with greater SR, once sufficient SR has been obtained. For a preamp output, for example, if an SR of 5V/ uS is more than sufficient to meet any possible operating condition, 50V/uS may not improve operation in practice and may well represent a meaningless numbers race.
As pointed out in reference 33, the listening tests of this research are basically the subjective observations of one individual and should not be construed as a result applicable to all situations.
Table 2--Listening test results (referred to full output of ±10 V).
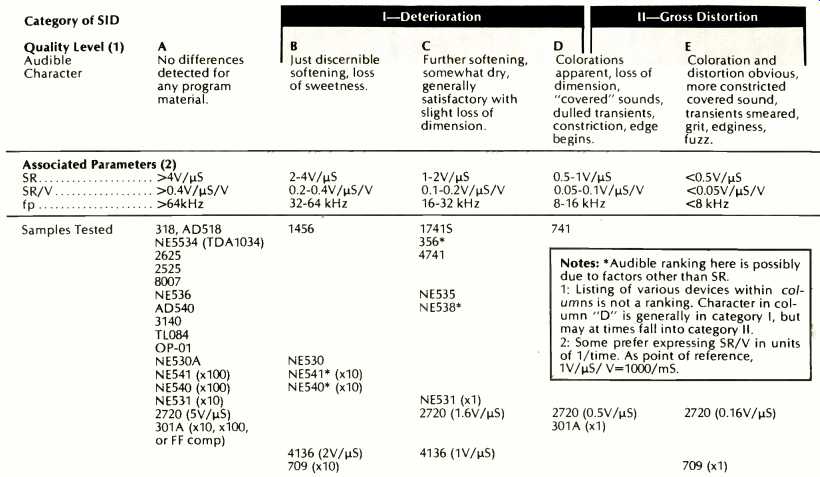
Notes: *Audible ranking here is possibly due to factors other than SR.
1: Listing of various devices within columns is not a ranking. Character in column "D" is generally in category I, but may at times fall into category II.
2: Some prefer expressing SR/V in units of 1/time. As point of reference, 1V/µS/ V=1000/mS.
Summary of Test Results
Some sensible guidelines for amplifier selection now begin to emerge from this series of tests. The primary one is speed, which is to say that faster amplifiers are generally better.
There are two basic aspects to speed, bandwidth and slew rate, and in general they tend to go up together. It can be stated that raising an amplifier's gain-bandwidth product (or unity-gain frequency) is usually desirable [27, 28, 29, 30, 31].
The reason is that at any given frequency (neglecting d.c. and very low frequencies) the loop gain of the amplifier will be higher and more feedback-related distortion reduction will take place, which lets one work closer to the device SR (and, of course, reduces other distortions as well).
It has also become apparent that higher SR is generally better, even for equal bandwidth, but some caution is required here. Since slew rate is determined by the dynamic range of the (usually) nonlinear input transconductance amplifier, it is important that high slew rate not be achieved at the expense of linearity.
The slew-enhanced devices, such as the 535 and the asymmetric 356, are examples of amplifiers which violate this premise. These devices are inherently incapable of performing as well as devices with more linear overall transfer characteristics. Emitter degeneration used in an input stage is an excellent example of a technique that allows higher SR [20, 21, 24, 47], while at the same time linearizing the input stage and extending its dynamic range. The 1456 or 318 is a good example of this type of amplifier; FET differential input types, which by their very nature have low transconductance, are also excellent (provided they are symmetrical). A good example of this type of topology is the TL080, TL071, or the LF351 series.
To restate these design criteria, we primarily want an amplifier which is linear for large input signal (AV) levels, and importantly, one which can deliver relatively large currents to the compensation capacitance [24]. This gives us high SR and a highly linear input dynamic range, which allows large error signals. Secondly, we would like this amplifier to have as high a unity-gain bandwidth as possible, so that when we apply feedback, the HF loop gain will be as high as possible for distortion reduction. The loop gain determines how close we can operate to slew limiting before distortion begins to rise (as it inevitably will, in a practical circuit).
Some previously discussed design criteria for low TIM, such as the use of low open-loop (d.c.) gain and a high open-loop pole frequency (two), do not appear to be fundamentally necessary conditions for low TIM [33, 34, 45, 47], given an SR> SS.
From the above considerations, it seems useful to suggest a new form of SR criteria for audio circuits. From the four series of tests (THD, IM, sine-square, and listening), this would be a criterion which specifies a minimum SR with regard to the maximum output voltage level in use. Our criterion is "The circuit, including all possible loading conditions, should possess a (symmetrical and unenhanced) slew raze of 0.5V/uS (minimum) to 1V/uS (conservative) per peak output volt." Application of this simple criterion will result in negligible SID, either electrically or audibly, if the slew rate is symmetrical (± 20 percent) and the input stage has a linear transfer characteristic (constant transconductance, unlike slew-enhanced types).
Inasmuch as the above criterion is a stringent one, and in view of some conservative operating conditions, some qualifiers could be added. In general, this criterion specifies an fp of 80 kHz, which is four times the generally accepted audio bandwidth of 20kHz. The reasoning behind this is the rise in distortion with the onset of slewing, sometimes described in the literature as "soft TIM" [7, 8]. Figure 26 illustrates this effect in curve A, which is the THD performance of a 741 on a normalized scale of SR ratio. As can be noted, appreciable distortion exists at ratios as low as 0.25 (or two octaves below fp) [33, 60].
Curve B is for a heavily fed-back amplifier, using a high gain bandwidth IC. As can be noted, distortion is at measurement residual levels right up to the point of actual slew limit (this has been referred to as "hard TIM" in the literature).
Obviously, in the case of B, less derating is necessary, since there is virtually zero distortion until actual slew limit. however, inasmuch as most practical amplifiers will show some distortion prior to slew limit, the 80 kHz fp is intended to guarantee a 20-kHz distortion-free bandwidth (for all output levels). Of course, for less than high performance uses, the criterion can be derated as the user sees fit.
This criterion is perhaps most applicable to amplifiers where the user does not have total control over performance parameters, such as SR, bandwidth, and input dynamic range (and/or linearity). For such applications, it can be useful as a guiding selection criterion, for example with IC types.
When one has design freedom from the ground up, and can optimize all operating parameters, other design approaches can be more useful. These are discussed in the final part of this series, which includes a design process to guarantee non-slew-limited performance.
(Source: Audio magazine, Jul. 1979)
Also see:
An Overview of SID and TIM--Part I (Jun. 1979)
An Overview Of SID and TIM-- Part III: Analysis and Design of Amplifiers for Minimum SID (Aug. 1979)
= = = =