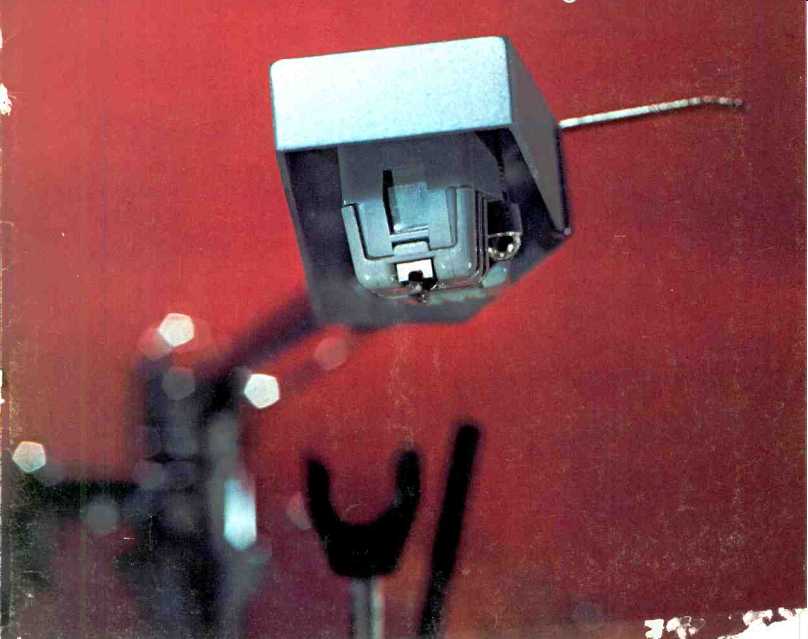
By C. R. Anderson and P. W. Jenrick [Shure Bros., Inc., Evanston, Illinois.
From a paper presented at the 41st AES convention. ]
AFTER THE EVOLUTION of almost a century, phono pickups have now reached a high standard of performance but two conflicting requirements are still limiting factors. What are these requirements? First, the stylus tip must remain in firm contact with the groove wall, and secondly, the force used must be low enough to reduce record wear. There are two frequency ranges involved-low frequencies where the mechanical compliance of the moving system limits the groove amplitude that can be traced and at high frequencies where tracing distortion and reflected mechanical impedance of the moving system both limit groove acceleration. Tracing distortion has long been considered a serious problem, but in the last five years or so pick-ups have been developed with vastly improved tracking abilities.
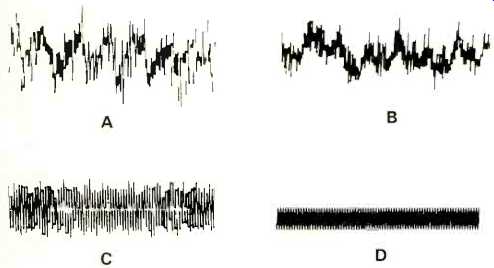
Fig. 1--Samples harpsichord, and signal, 10 kHz at of instrumental waveforms:
A, chimes; B, C, orchestral bell. D is an STR 100 test 5 cm/sec peak.
Severe high frequency transients occur quite often in musical material. Sounds of bells, harpsichords, cymbals, and even human voice sibilants contain a high frequency overtone structure that establishes the character of the sound. Figure 1 shows oscillograms of material taken from commercial records with a 10,000 Hz 5 cm/sec test band for comparison. It can be seen that the transients are of short duration and the signals are highly complex. When a phono cartridge mistracks such material, the sound becomes "rough," "harsh," and "shattered." The character of the sound is degraded by the introduction of low and mid-frequency noise. This is shown quite clearly in Fig. 2, which is a one-third octave analysis of an orchestral bell note. The fundamental pitch is 1800 Hz and the third and fifth harmonics are seen at 5400 and 9000 Hz respectively. The dotted lines show what happens when mistracking is induced by reducing the stylus force. The harmonic structure is still unchanged but the bell is almost drowned in a sea of noise!
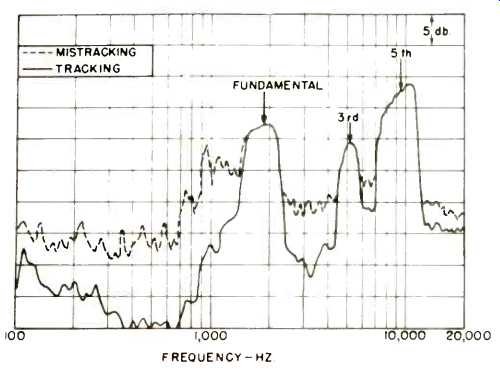
Fig. 2--One-third octave analysis of orchestral bell note.
How are pick-ups tested or evaluated in their performance on complex signals containing transient peaks? Present methods include harmonic distortion measurements, IM tests using the CCIF standard, and listening tests using various recorded sounds. All of these are open to objections: THD measurements are affected by the harmonic structure extending past the high frequency pass-band of the system and it is not that easy to record high level signals for the long periods necessary.
The CCIF IM test uses two high frequencies of equal amplitude and detects the difference frequency. It has the advantages that the spurious products appear within the pass-band and the ratio of peak-to-average signal is lower than the THD method, but it is still difficult to make such IM test records.
Finally, subjective listening tests are useful enough for rough comparisons but are not really reliable for accurate measurement. So new methods were sought which would give meaningful evaluations. One solution is the use of a repetitive transient signal-in other words, a modified tone burst. Figure 3 shows the basic arrangement. The signal from the oscillator is passed through a synchronous tone-burst generator which switches at the zero crossing of the sine wave, passing 8 cycles and blocking 32 alternately. Figure 4 shows the output signal at X and it can be seen that it is rich in harmonics of the repetition rate, which is 1/40th of the oscillator frequency, Fo. When this signal is passed through the one-third octave filter centered on Fo, most of the low frequency components are removed giving the results shown in Fig. 5. The signal has a 25 percent duty cycle so it can be recorded at high peak levels without difficulty. This recorded signal can now be used to evaluate pick-up distortion in several ways: 1. By listening to changes in the repetition rate component as signal intensity is changed; and 2. By observing the entire output or the repetition rate component on a 'scope, and 3. Analyzing by filter or spectrum analyzer. Figure 6 shows what happens when the signal is so distorted that the positive and negative portions are unequal and the low frequency components reappear.
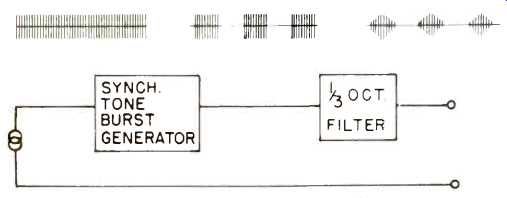
Fig. 3-Generation of test signal.
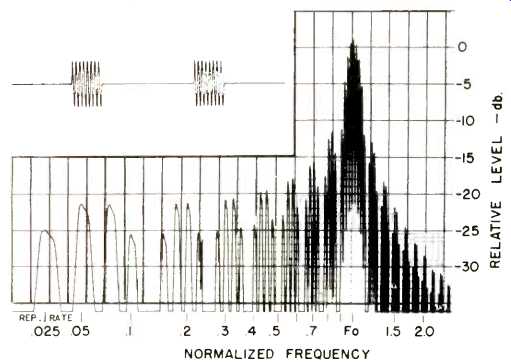
Fig. 4-Analysis of rectangular tone burst.
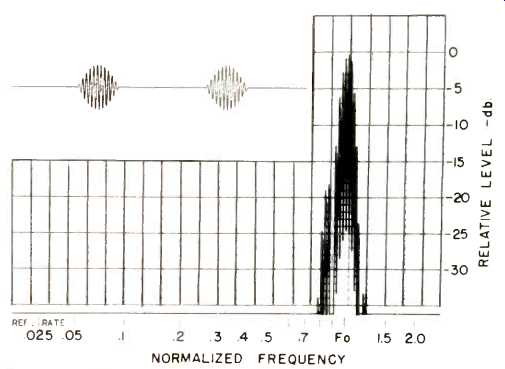
Fig. 5-Analysis of filtered tone burst (test signal).
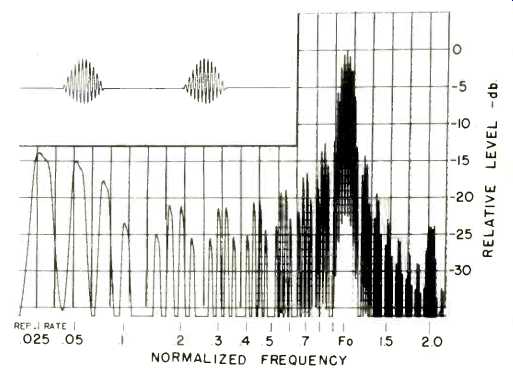
Fig. 6--Analysis of distorted test signal.
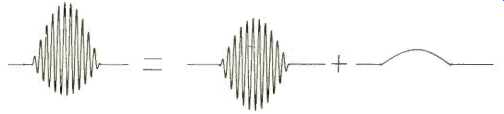
Fig. 7-Pictorial analysis of distorted test signal.
Figure 7 is a pictorial analysis of a distorted test signal which can be separated into an undistorted signal A to which is added a bump B which appears at the repetition rate. This bump has the fundamental frequency of the repetition rate plus a series of harmonics. The test signal and high frequency transients met with in recorded music both react in the same way when distorted. Both produce strong in-band frequency components which are readily detected. But, of course, the test signal is well defined and repeatable. The greatest significance of the test signal is derived by analyzing the spectral components. The low frequency components appear at the repetition rate since the pick-up only mistracks near the maximum velocity of the transient. This "repetition rate distortion" is a reliable index and it can be defined as follows:
Drr = Vrr / VFo X 100%
Where
Drr = repetition rate distortion in percent,
Vrr = voltage at repetition rate (Fo/40) as measured using a wave analyzer with a 3 db bandwidth of 30 kHz, and
VF o= voltage at oscillator frequency Fo measured using a wave analyzer with a 3 db bandwidth of 1 kHz.
If this distortion figure is plotted against modulation velocity for a constant tracking force, the mistracking point of a pick up can be easily determined. Figure 8 shows a distortion plot made with a 10.8 kHz tone burst recorded at four velocity levels. Each of the three curves represents the distortion measurements of the pick-up over the available velocity range for a given tracking force. At point A the pick-up is maintaining good contact with the record groove, and the low distortion is partly residual and partly due to a little tracing distortion which is modified by indentation. At point B, the pick-up is just beginning to mistrack and this instable condition fluctuates with small warps and other defects in the record and so on. The spectral analysis is shown in Fig. 9 where the low frequency components are seen. Compare this with Fig. 5.
At point C, the pick-up is mistracking quite severely and the distortion has increased to 3 percent.
One useful feature of this test record is the fact that it can be played at a high speed to increase peak velocities. For instance, a velocity of 11 to 22 cm/sec at 33 1/3 rpm increases to 15 to 30 cm/sec at 45 rpm. The frequency also increases with the same ratio, making the test even more severe. Typical results are shown in Fig. 11, where two cartridges, the Shure M55E and the V-15 II, are compared at different peak velocities. The M-55E shows a tracking stylus forces, the MSSW reaches a tracking threshold of 14 cm/sec at 8 kHz, while the V-15 II does not begin to mistrack until nearly 30 cm/sec at 1.8 kHz is reached.
The test signal can also evaluate distortion caused by stylus wear and this is shown in Fig. 12. Note that the bi-radial stylus shows the lowest distortion.
Finally, acknowledgements are due to James Kogen, Vice President of Engineering, and to B. Jakobs, Chief Development Engineer, for their valuable suggestions and interest in this project.
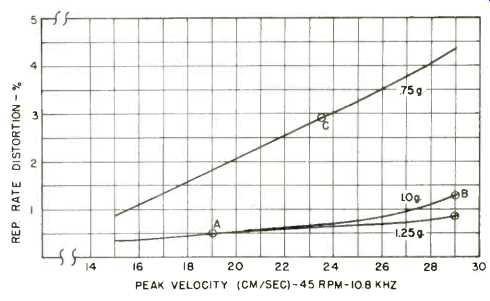
Fig. 8-Shure V-15 II distortion characteristic.
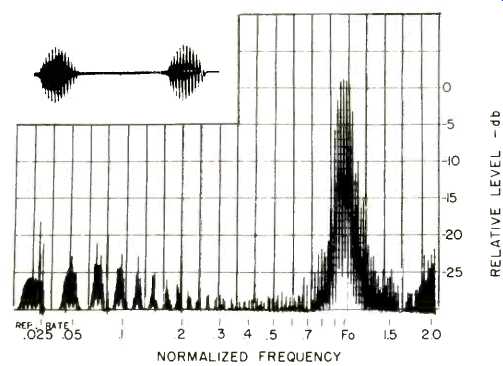
Fig. 9-Analysis of marginal tracking pick-up signal.
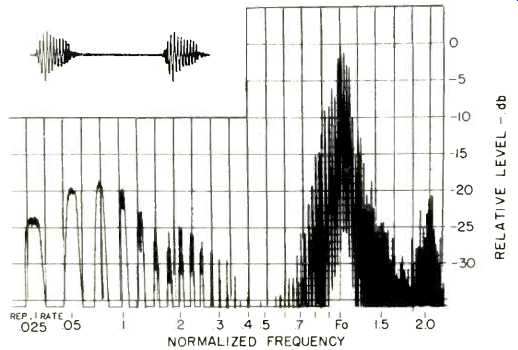
Fig. 10-Analysis of mistracking pick-up signal.
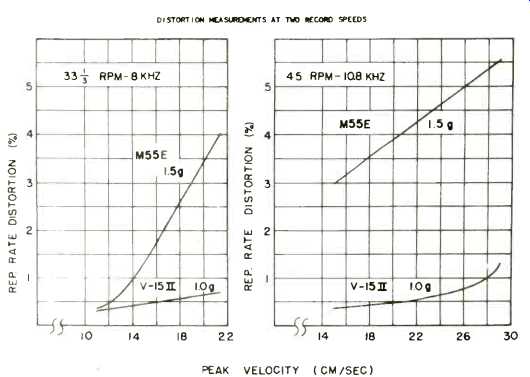
Fig. 11--Distortion measurements at two record speeds.
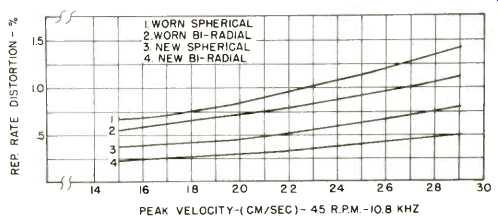
Fig. 12--Distortion characteristic (tracking) of various stylus radii.
References
I. C. R. Anderson, J. H. Kogen, and R. S. Samson, "Optimizing the Dynamic Characteristics of a Phonograph Pick-up," J. Audio Eng. Soc., Vol. 14, p. 145, 1966.
2. J. G. Woodward and R. E. Werner, "High Frequency Intermodulation Testing of Stereo Phonograph Pick-ups," J. Audio Eng. Soc., Vol. 15, p. 130, 1967.
(Audio magazine, Aug. 1972)
Also see:
A New Concept in Diamond Syli (Aug. 1972)
Understanding Phono Cartridges (Mar. 1979)
Phono Cartridge Q's and A's--Mainly for Beginners (Aug. 1972)