By Michael Lampton and Lee M. Chase
THE LOUDSPEAKER is, to many people, the most mysterious part of the modern sound reproducing system. Each year, a few manufacturers introduce "totally new" loudspeaker systems and claim extraordinary performance achievements; often, they boast of applying new principles unknown to their competitors. In fact, the fifty-year-old electrodynamic loudspeaker is capable of excellent performance, but a speaker system (the loudspeaker and its enclosure) does have limitations. One purpose of this article is to remove the mystery of loudspeaker design and show just what the design limitations are. Another purpose of the article is to dispel a number of untruths which have grown up in this field: that a bigger woofer is always better; that a sealed enclosure always outperforms a vented enclosure (it is, in fact, a special case of the vented design); that a bass-reflex should always be tuned to the free-air resonance of the loudspeaker. A third purpose of this article is to provide the reader with some definite, quantitative engineering data in the form of graphs, which can be applied to existing or planned loudspeaker systems as a guide to their improvement.
II. The Theory of Loudspeaker Performance
In this section, we'll take a look into the theory of "direct radiator" (hornless) electrodynamic loudspeakers. A more complete treatment is given in the Appendix and in the references.
The theory of the frequency response of a loudspeaker can be boiled down to one simple formula:
In this formula, r_em represents the driving power of the magnet and voice coil; this factor is constant with respect to frequency. The quantity r_rad is the so-called "radiation resistance" which describes the useful acoustic load on the cone's motion; it increases as the square of the frequency until the frequency reaches the speed of sound divided by the cone's diameter. At higher frequencies rd becomes approximately constant. Finally, z represents the total mechanical impedance of the speaker's moving parts.
The important thing to remember about z is that, throughout the speaker's frequency midrange, z is proportional to the frequency. So, its square is proportional to the square of the frequency, and the response throughout the midrange is flat! This happy cancellation of the f2 factors, then, requires two conditions:
(1) rd must vary as f. As we have seen, this condition is met at low and medium frequencies; it fails at high frequencies.
(2) z must vary as f. This is termed "inertia controlled motion (see ref. 1) and is a hood approximation at the middle and high frequencies. It fails at low frequencies.
Due to these requirements, a loudspeaker has two limitations to its response: at the high end, requirement #1 fails; at the low end, requirement #2 is not satisfied.
The high frequency limitation occurs as a result of the short wavelengths of high frequency sounds. The wavelength corresponding to a frequency f is given by X = c/f where c is the speed of sound, 343 meter/sec or 1130 feet/sec. A 1000 Hz tone thus has a wavelength of about one foot. At frequencies high enough that the wavelength is smaller than the loudspeaker's cone, sound is not radiated in all directions (as it is at lower frequencies) but becomes strongly beamed in the forward direction. Furthermore, the total amount of sound generated starts to diminish at increasing frequencies, owing to the radiation resistance losing the battle against the steadily increasing inertial impedance. ( Olson [ref. 4] describes some ingenious ways around this problem in his discussion of wide range loudspeakers.) Since these problems set in at above about 1000 Hz for 12-in. speakers, tweeters are usually employed which are designed to cross over in the neighborhood of 1 kHz. Tweeters are designed according to the same rules which govern woofers; the dimensions, of course, come out much smaller owing to the higher operating frequency.
The low-frequency limitation on loudspeaker performance is not due to a wavelength effect. It is due instead to the forces acting on the loudspeaker's cone which are not inertial.
These include things like the speaker's suspension stiffness, the electro-dynamic driving forces, and above all the pressure of the air in the speaker's enclosure. Each of these quantities can, to some extent, be minimized, and in designs where extreme low frequency response is required, it is essential to minimize all of them. There are, unfortunately, practical limits to these force-reducing measures. For example, very high compliance loudspeakers have very flabby suspensions which are prone to causing distortion and bumpy response resonances; weak electrodynamic drive will cause low overall efficiency and hence distortion and voice coil heating problems; and to achieve low enclosure air-compression forces requires the use of very large enclosures. As a result, the design of loudspeaker systems is a process of making compromises between three basic quantities:
(a) the volume of the enclosure, V,
(b) the efficiency of the system, E,
(c) the low frequency cutoff, f_c.
It has been shown (ref. 9) that any sort of enclosed loudspeaker system (air suspension, bass reflex, folded horn, or what-have-you) can be assigned a figure of merit, which represents the capabilities of that type of system with regard to this three-way compromise. The figure of merit is simply:
figure of merit = E/fc^3 V
where E is the loudspeaker's midrange efficiency. The useful feature of this figure of merit is that its value doesn't depend upon how small or large or efficient a system of a given type is; it depends only on the type and on certain details of its tuning. With E measured in percent, f_ in Hertz, and V in cubic feet, the values of the figure of merit for some popular loudspeaker types are given in Table I.
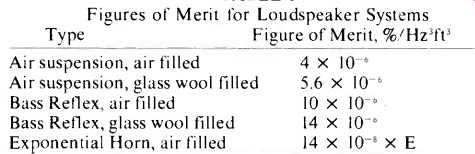
TABLE I Figures of Merit for Loudspeaker Systems
From the table, we note that an exponential folded horn can show as good a figure of merit as a reflex design, if its efficiency is kept high enough (70% or more). Horns have an additional advantage with respect to low distortion; however, they are much more difficult to construct than the other systems listed in the table. In the event that a high figure of merit is not needed, an air suspension system is a practical alternative; such systems are very easy to build since no tuning is required. In the remainder of the article, we'll concentrate on the design of bass-reflex systems.
In Fig. 1, we show the range of possible compromises between the three basic design quantities listed above. Here, we have assumed a figure of merit of 10x 10^-6 which represents the performance of which a properly tuned bass-reflex system is capable. An additional 40% improvement is possible, which can be obtained by filling the enclosure with loosely packed glass wool; this has the effect of making the enclosed air more compressible and is equivalent to a 40% increase in effective volume (for details, see section V on tuning). We now have some idea of what the capabilities of loudspeakers are. At this point, we shall turn to the problem of creating a design which satisfies a set of given requirements.
III. Measurements for Design
The first step in a design procedure is to understand and measure the quantities like electrodynamic drag and suspension stiffness which are sprinkled so liberally throughout the previous section and the Appendix. Many of these quantities are strictly under the control of the speaker manufacturer's magnet builder and cone maker; nonetheless we shall have to know their values if we are to do a good job in making the system perform well. Some manufacturers respond promptly to requests for complete data; others do not. We'll outline here how to go about measuring everything needed to evaluate a loudspeaker.
Stiffness. All that is needed to find the stiffness of a speaker suspension is a known weight and a ruler. Lay a straightedge across the front of the speaker mounting plane, and gently prop a ruler against the straightedge with the bottom of the ruler resting on the cone. Avoid any contact with the center dome of the speaker as this part is very fragile; the strong part of the cone is where the front of the voice coil is glued to the cone. Use a nonmagnetic ruler, since there is a powerful magnetic field in the vicinity of the voice coil. Read the ruler where it touches the straightedge, and then read again with a (nonmagnetic) weight resting on the cone. The stiffness, s is just the ratio of the applied force (in newtons; one newton is 102 grams) to the difference of the ruler readings (in meters). Compliance is 1/s1, and low compliance speakers have stiffnesses of 2000 to 3000 newtons per meter. High compliance speakers show stiffnesses of about 1000 newtons per meter.
BL Product. This quantity is a measure of the power of the electrodynamic motor which operates the loudspeaker. B represents the strength of the magnetic field in the gap, and L the length of the wire in the voice coil. B and L need not be separately measured. A much easier measurement, which gives the BL product, requires only a battery and a milli-ammeter. The test is carried out as described above: Read the ruler with zero current and read again with a known current on the order of 0.1 amp flowing in the voice coil. The BL product is then
BL = force/current = (cone displacement)
x s1 / I
where the current I is expressed in amperes. Small speakers typically have BL products in the range of 5 to 10 newtons per amp; large high efficiency woofers usually lie in the range of 15 to 20 newtons per amp.
Free-Air Resonance. This quantity is best measured with an audio oscillator and an a.c. voltmeter. Connect the oscillator to the voice coil and measure the voltage there with the speaker sitting face up on a table or chair. As the frequency is varied, you'll notice a large peak in the voltage and cone motion at the free-air resonant frequency. Also note the width in frequency of this peak, which is a measure of the open-circuit Q factor, Q0: Q0 = f1 /delta f2 where f1 is the resonant frequency and ¿f is the width of the resonance peak, measured at the 3 decibel down points. The quantity Qo is a measure of the suspension friction, r1, since r1 = s1/(2 pi Q0 f1). The suspension friction usually lies in the range of 1 to 3 newton seconds/meter. The free-air resonant frequency is used to find the effective mass of the cone and its air load, from the formula m, = 0.0254 s1/f1^2 kilograms. Typical values of f1 are 20 and 30 Hz for large woofers and 40 to 60 Hz for smaller wide-range speakers. Masses are typically 0.04 to 0.06 kilograms for large woofers and 0.01 to 0.02 kilograms for the smaller speakers.
Area. The piston area, A1, is the area of a circle which extends as far as the midpoint of the suspension annulus. For the usual type of cloth roll suspensions, the area of a 15-in. frame diameter speaker will be about 0.085 square meters; 12-in., 0.050; 10-in., 0.032; and 8-in., 0.018. Very high compliance speakers may have somewhat smaller effective areas for their frame sizes, due to the greater area taken up by the suspension surround.
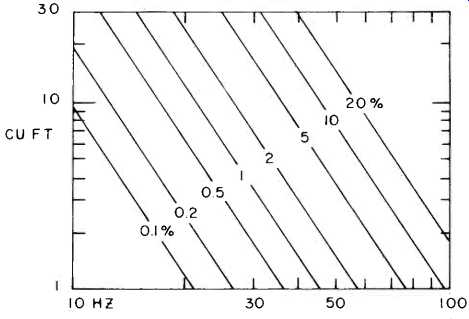
Fig. 1--An illustration of the relationship between the low frequency cutoff
(Hz), enclosure volume (cubic feet), and system efficiency (%), when the
figure of merit is equal to 10^-5 %/ft^3HZ^3.
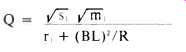
D.C. Resistance. Anyone equipped with an ohmmeter can measure the d.c. resistance of a voice coil. In systems where a crossover network is to be used, the d.c. resistance of this network must be included in R. The output resistance of a modern feedback power amplifier is usually negligible. Most loudspeakers of recent manufacture have voice coil resistances of about 6 ohms; they are called 8-ohm speakers because of the extra impedance encountered in the crossover network and the excess impedance appearing in the form of inductance at the higher audio frequencies. With the measurement in hand, several important quantities can be calculated. First, the electrodynamic drag, r, is the mechanical resistance offered by the piston when the voice coil is short circuited (or connected to a low impedance amplifier output). This quantity shows up in the equations for the response and the efficiency. It is calculated from the formula r,=(BL)2/R. Small speakers usually have values of r_em, in the range of 5 to 10 newton seconds per meter, while larger ones give 20 to 30 ns/m. The efficiency of the loudspeaker is then Efficiency = 0.0556 r_em A1^2/m1^2 percent. The short circuit Q factor of the loudspeaker is obtained from the formula Q= radic. s, radic. m,/(r_em,+r1). It is this quantity which has an extremely important effect on the choice of the optimum enclosure for a given speaker. It is a ratio of the reactances of the speaker's cone to the damping forces and so dictates the best tuning of the final design. Typical values of Q lie in the range of 0.2 to 0.5-not a large range, all considered, but as we shall see, Q is a rather critical quantity for systems in which flat response is needed.
The measurements and calculated quantities summarized above are the data needed to characterize a given loudspeaker. For purposes of comparison, we have tried to give the ranges of values found for popular speaker types. In section IV we shall discuss the enclosure and speaker requirements needed to create a system having given properties. Before doing this, however, we'll look into the properties of the enclosure itself.
Enclosure Air Stiffness. When a chamber containing air is compressed, it exerts pressure greater than its static barometric pressure on the piston doing the compressing. If the area of the piston is A,, the force per unit displacement is s2 = 142,000 A1^2/V where V is the volume of the chamber in cubic meters (a cubic meter is 35.3 cubic feet). The constant in this formula is the product of the sea-level air pressure, 102,000 newton/square meter, and the adiabatic factor for air, 1.4. In small enclosures, this air stiffness easily dominates the stiffness of the speaker suspension. Since this stiffness is an important limitation in achieving a low system-cutoff frequency, it is desirable to find ways to minimize this quantity. It is clear from the formula that a small speaker will have a great advantage in this regard, especially is the enclosure must be small. Another technique for diminishing s, is to pack the entire interior of the enclosure with fiberglass wool, which adds thermal inertia to the compressible air inside and reduces the adiabatic factor to close to 1.00. The resulting stiffness is then approximately 102,000 A1^2/V. Vent Air Mass. This mass, which we shall abbreviate as m_2, is essentially the mass density of air times the volume of the duct. Two corrections to this identification are necessary, however: first, it is necessary to take into account the fact that the piston velocity and vent air velocity occur with differing flow cross-sectional areas which requires a factor of (A, /A2)2; the other correction takes into account end effects.
The correct formula for the effective mass of the air in the vent is m2 = 1.2 A1^2 (L + radic. A2)/A2 kilograms, where L is the length of the duct in meters and A2 is its cross sectional area in square meters. This formula can be inverted to give the duct length if the desired mass and area is known: L = 0.83m_2 A_2/A1^2 - radic. A2 meters. If this comes out negative, use a larger duct cross section. If it comes out approximately zero, you don't need a duct behind the vent; just cut a hole of area A2.
Strictly speaking, careful design should also take into account the effects of resistance in the vent. This resistance arises from the acoustic radiation of the vent, and also from the viscous frictional force acting on air passing through a hole. As was pointed out by Novak (reference 5), these forces are substantially smaller than the other losses in the system and can be ignored. We recommend that all damping material used in the enclosure be kept away from the vent to keep this approximation valid.
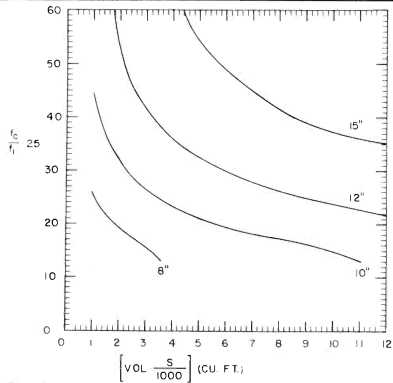
Fig. 2--These curves are used to determine the properties of a speaker that
will meet the desired low frequency cutoff and enclosure volume requirements
as shown in the design illustrations.
IV. Choosing a Loudspeaker
In this section, we shall present a straightforward method for designing a speaker system which meets requirements specified by the user. The designer will have to start by determining his specifications in the following three areas:
(a) the allowed enclosure volume, V;
(b) the required efficiency, E, and
(c) the low frequency cutoff, fc.
Cost is usually also an important limitation but it cannot be handled very well theoretically. Distortion is another quantity in this class; generally, distortion is minimized by choosing the largest diameter woofer compatible with the other design objectives.
The designer cannot independently specify all three of the parameters listed above. Specifying any two of them fixes the third, as we have seen in section II. Figure 1 provides a handy guide for reaching a satisfactory compromise with regard to these quantities. Figures 2 and 3 illustrate the detailed relationship between these quantities, in terms of the properties of the woofers capable of satisfying the design goals. By means of Figs. 4, 5, and 6, we shall give three design illustrations which show how a satisfactory woofer is chosen.
Finally, in Figs. 7, 8, and 9, we'll show how the enclosure should be tuned to provide the performance needed.
System Performance. Figure 2 illustrates how the low frequency 3 dB cutoff, fc, is affected by enclosure size. To use this curve, you must know the suspension stiffness, s and the free-air resonant frequency, f of the speaker. If, for example, the stiffness is 1000 newton/meter, then the horizontal scale reads the enclosure volume directly in cubic feet. If the free air resonance is 25 Hz, then the vertical scale reads the cutoff frequency directly in Hertz. Suppose, however, that you have a 12-in. speaker with s, =2400 n/m and f1 = 50 Hz. In addition, suppose you wish to investigate
the use of a 4-cu. ft. enclosure. Then, the cutoff frequency is found as follows: the horizontal scale point is
Vol. x s1/1000 = 4 x 2400/1000 = 9.6
From the graph for 12-in. speakers, we read off fc x 25/f1 = 24
Since fc = 50, we have f_ = 48 Hz.
Thus, the proposed system can be expected to provide smooth response down to 48 Hz. The efficiency of the system can be determined from Fig. 1 or Fig. 3. In Fig. 3, the abscissa is again 9.6; on the 12-in. speaker curve we obtain E x (s,/1000) x (25/f,)3 = 1.45, so that E = 4.8%. In this illustration we specified only one of the three design parameters (the enclosure volume) since the properties of the speaker were given. Ideally, however, we would like to use the curves to find out what speaker(s) will meet the system specifications. Furthermore, from a practical point of view we should like to have the speaker requirements come out such that the system can be built with speakers now available.
We shall adopt the rule of thumb that suspension stiffnesses between 800 and 2500 newtons/meter and free air resonant frequencies between 20 and 60 Hz are reasonable, and that speakers with values outside this range will be difficult to find.
Design Illustration #1: Deep Bass. Moderate Size. In this illustration we shall specify that:
fc = 30 Hz or less,
V = 4 cu. ft.
There are a large number of combinations of suspension stiffness and free-air resonance that will permit us to meet or exceed the requirements. First consider speakers with s1 = 1000 n/m; for these, the abscissa of Fig. 2 will be 4 cu.
ft. From, say, the 10-in. curve, we find that 10-in. speakers with
(fc/f1)x25 = 23
will meet our requirements if f1 = 33 Hz.
If f, is less than 33 Hz we shall be able to exceed the required specifications.
Similarly a 12-in. speaker with s, = 1000 n/m will enable us to exceed the requirements if f, is less than 21 Hz. (The efficiencies in these cases will be less than or equal to 1.1%.) Now consider speakers with s1 = 2000 n/m; the abscissa is now 8 cu. ft., and from the curves in Fig. 2 we learn that a 10-in. speaker with f1 below 43 Hz or a 12-in. speaker with f1 below 29 Hz will suffice. By continuing this process for various other values of s1, we can plot the acceptable combinations of s, and f, which allow the requirements to be met. Figure 4 shows the plot for this design example. Any 10-in. speaker whose specifications fall within the shaded region will permit the system requirements to be met.
Similarly, any 12-in. speaker which falls in the cross-hatched region will also meet the requirements.
By constructing such a graph, we can tell from a glance at the manufacturer's data (or our own measured data) whether or not a speaker will be satisfactory in a given application.
Design Illustration #2: High Efficiency. Moderate Bass. Let us specify for this illustration f, = 40 Hz or less, E = 5% or more.
To approach this problem, start by considering speakers with f, = 40 Hz. The appropriate point on the vertical scale in Fig. 2 will be
(fc/f1) x 25 = (40/40) x 25 = 25.
From the (say) 12-in. speaker curve, we find the required value on the horizontal scale to be 9 cu. ft. Using this value on Fig. 3, we learn that:
E x (s1/1000) x (25/f,)3 = 1.5
…so that to meet or exceed the 5% efficiency requirement, the stiffness s, must be less than 1240 newtons per meter. The corresponding enclosure volumes will be larger than 7.3 cubic feet.
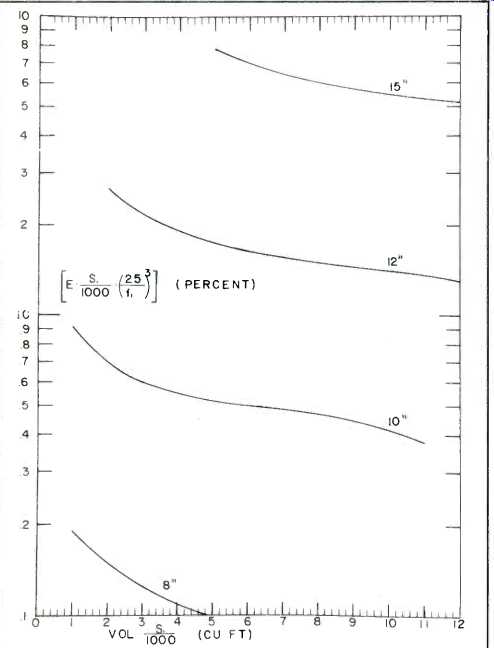
Fig. 3--These curves are used to determine speaker properties required to
meet a given efficiency specification.
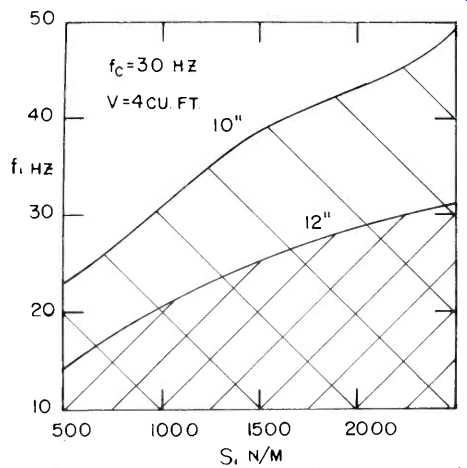
Fig. 4--The range of speaker free-air resonances and suspension stiffnesses
that will meet or exceed the requirements set forth in design illustration
1.
As in example #1, we repeat this speaker determination at other values of f,. For example, if f, = 30 Hz we find that satisfactory 12-in. speakers will have s, less than or equal to 620 n/m. By gathering other points in the same way, we arrive at the plot in Fig. 5 which allows the range of satisfactory loudspeaker parameters for this design example.
Design Illustration #3: High Efficiency. Small Size. Let us suppose that we require
E = 5% or more,
V = 3 cubic feet.
Consider first speakers with s1 = 1000 n/m.
We again use Fig. 3 to fix the needed efficiency; for (say) 12-in. speakers we have
E x (s1/1000) x (25/f1)^3 = 2.2
which is satisfied only if the free-air resonance is above 33 Hz. Similarly, if s, = 2000 n/m, then the free-air resonance must lie above 45 Hz for 12-in. speakers. Figure 6 shows the ranges of speaker characteristics which can be used in systems meeting the requirements of this design example. For all these systems, the 3 dB cutoff frequency will lie at or above 57 Hz.
Designing Your Own System. To design your own system, the following procedure should be used: I. Write down your definite requirements, following the guidelines given at the beginning of this section.
2. Construct a graph of acceptable speaker specifications, following the procedure in the appropriate design illustration above.
3. Purchase a loudspeaker which meets the requirements found in step 2.
4. Build and tune an enclosure following the procedure given in the next section.
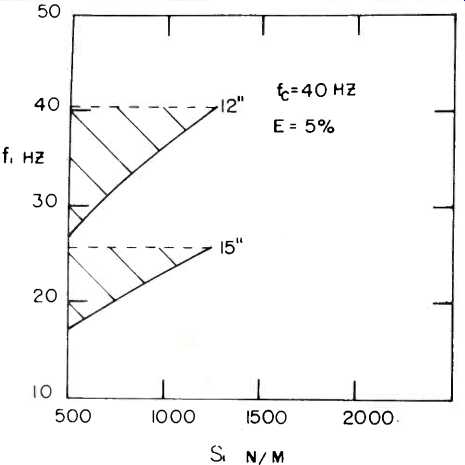
Fig. 5--The range of suspension stiffnesses requirements set forth in speaker
free-air resonances and that will meet or exceed the redesign illustration
2.
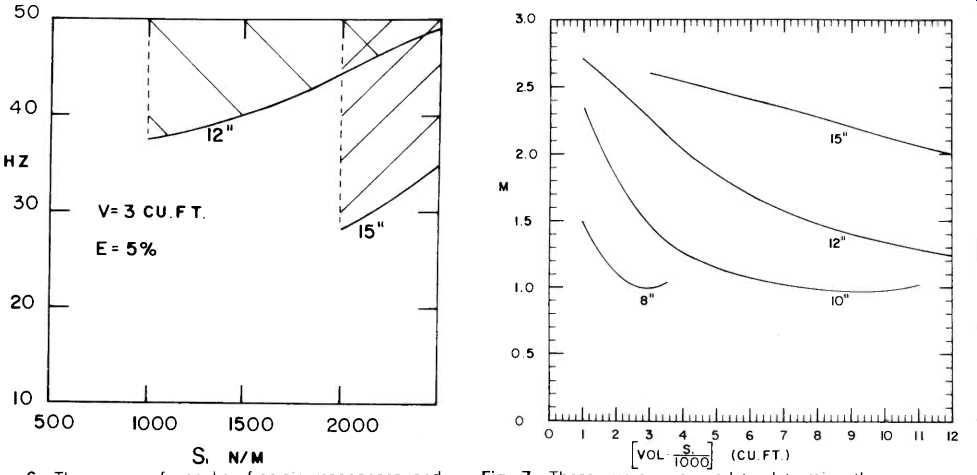
Fig. 6--The range of speaker free-air resonances and suspension stiffnesses
that will meet or exceed the requirements set forth in design illustration
3.
Fig. 7--These curves are used to determine the proper duct-to-cone-mass ratio for a specified enclosure and speaker.
V. Tuning the Speaker System
The previous section showed how to find a loudspeaker capable of delivering the required performance. In this section, we'll show how to set up the correct enclosure reactances and loudspeaker damping, so that the desired performance can be obtained. At this point it is a good idea to measure the properties of the loudspeaker you have obtained, as described in section III of this article.
Enclosure Volume. If the enclosure volume is not one of the specified design parameters, it must be obtained from Fig. 1 or 2 and from your other requirements. In our design curves, we have assumed that the entire volume of the enclosure was filled with adiabatically compressible air. However, the walls of the enclosure should be covered with a sound absorbing material such as fiberglass wool, to avoid problems with internal sound reflections in the enclosure.
This part of the interior is then approximately isothermally compressible air. The appropriate volume to use with the design curves is then Design Volume = Adiabatic Volume + 1.4 x Isothermal Volume.
Thus, a small enclosure can be made effectively larger by using more insulating material.
The actual internal volume of the enclosure is, of course, just the adiabatic volume plus the isothermal volume.
Mass Ratio. The mass ratio of a speaker system is (see ref. 7) the ratio of the effective vent air mass to the effective speaker cone mass. We shall abbreviate this ratio as M; so
m2=M x m,
where
m3 = 0.0254 x s1 /(f1)^2
The proper mass ratio M for tuning the enclosure can be obtained from Fig. 7. Since by this time you will already know the value of the loudspeaker's mass, m the proper value for m, follows from the definition of M. The actual length of the duct can be obtained from the formula given in section III; alternatively, the plot in Fig. 8 can be used provided that the area of the duct, AZ, is kept equal to the square of the duct length obtained from Fig. 8. The shape of the duct's cross section is unimportant; only the area is of concern.
Speaker Q. The optimum Q value for your speaker is an important quantity, since it governs the damping of the entire system. Too low a Q factor corresponds to too much damping and will give a system deficient bass response. Too high a Q factor means that the system is underdamped and leads to boomy bass; that is, the resonator part of the system will have more efficiency than the speaker alone, and so the output in the neighborhood of the enclosure's resonant frequency will be greater than the speaker's midrange output.
In Fig. 9 we show a plot of the optimum Q factors for loudspeakers in a variety of systems. Recall now that the Q factor of a loudspeaker is given by the formula
...where R is the total d.c. resistance in the voice coil circuit. It is likely that the Q value of the speaker you have chosen will not be the exact optimum value. Note, however, that Q is affected by the total d.c. resistance in the voice coil circuit, so that by adjusting the total resistance you have a handle on Q. The formula shows that adding external resistance in series with the voice coil acts in the direction of increasing Q from its short circuit value, i.e. in the direction of decreasing the damping and decreasing the midrange efficiency.
So, if Fig. 9 tells you to increase the speaker's Q, you need only connect an external ballast resistor in series with the voice coil to make up a total resistance given by
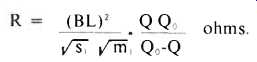
If, however, the chosen loudspeaker has insufficient damping, the total d.c. resistance must be decreased. This is a more difficult task than the previous case. A method for decreasing the total resistance by means of a negative output impedance amplifier will be the subject of a future paper. In the meantime, we recommend staying away from insufficiently damped speakers, unless the discrepancy is small (say, less than 30%). A Q error of 20% will usually correspond to a response peak in the neighborhood of two to three decibels.
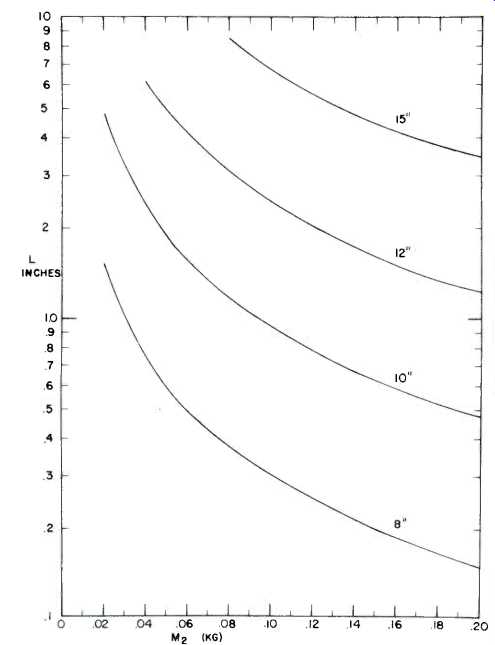
Fig. 8--Duct length for a given duct air mass is given in these curves,
if the duct area is the square of the duct length. Otherwise use the formula
given in the text.
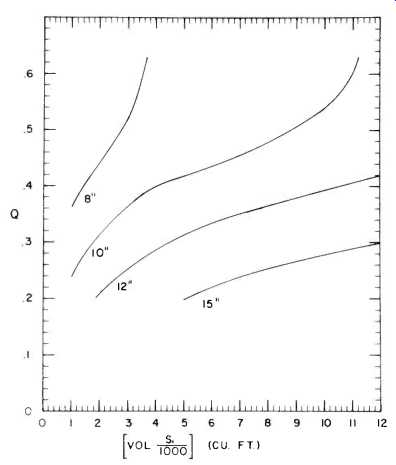
Fig. 9--Required speaker Q for a given enclosure volume and speaker suspension
stiffness.
VI. Construction Hints
Constructing a bass reflex enclosure is one of the easiest tasks that can be undertaken in the home workshop. The basic enclosure is a rectangular box. The dimensions of the box must be such that its internal volume is the value obtained above. Do not include the duct volume as part of the internal volume. The proportions of the box are relatively unimportant, provided that there is at least three inches of clearance behind the duct.
The box should be sturdily constructed of a dense material such as 3/4-in. thick plywood or particle board. Most lumber yards will cut the wood to your specified size for a nominal charge. Armed with a screwdriver, drill, and a saber saw, you can build a thoroughly satisfactory custom enclosure. Although we don't recommend it, we have built reflex enclosures in sizes up to 11 cu. ft. in the living room of a one bedroom apartment.
The joints of the enclosure must be reasonably air tight and above all must be strong. To get this strength, use 1 x 1-in. blocks, plenty of white glue, and screws at all edges. The duct and speaker are usually both mounted on the front panel. You will need a saber or keyhole saw to cut the holes for the speaker and vent. The duct, if needed, should be made of a stiff material which won't vibrate. Although stiff cardboard will often do, plywood is better.
Naturally you will want your enclosure to look as good as it will sound. We find it convenient to use plywood that has a prefinished veneer surface. Another method is to use ordinary unfinished plywood and to apply a hardwood veneer to the completed enclosure. This is not as difficult as it sounds and has the advantage that you need not be concerned about the wood's surface during the construction.
The final touch is to use a loosely woven cloth to cover the front panel.
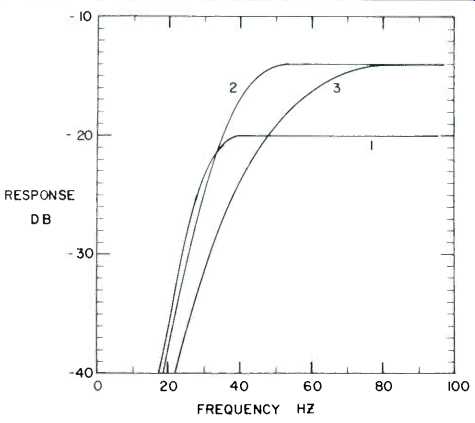
Fig. 10--Frequency response curves for the speaker systems designed in illustrations
#1, #2, and #3.
Appendix: Basic Engineering Formulas
1. Just as in electrical engineering, we shall take all alternating forces, velocities, currents, and voltages as being proportional to the (complex) quantity e'w' where "i" is the unit imaginary quantity equal to the square root of minus 1.
Also, w is the radian frequency given by 2 pi f, with f the frequency in Hertz.
2. The mechanical impedance, z, of an object is the ratio of the applied force, f, to the resulting velocity, v, of the object. The basic unit of resistance, the mechanical ohm, is one newton per meter per second. As in electrical engineering, real impedances are called resistances; imaginary impedances are called reactances. The impedance of a mass is f/v = ma/v = iwm. Similarly, the impedance of a spring with stiffness, s, is s/iw. Note the important fact that if several forces act on an object, the associated impedances add together to produce an effective impedance. We shall use this concept in discussing the motion of a loudspeaker cone subject to several types of force simultaneously.
3. An electrical conductor of length L meters, moving sideways in a magnetic field of B webers per square meter with a velocity of v meters per second, will create an induced voltage V given by the formula V = BLv volts. One weber/ meter' is 10,000 gauss.
4. A current of I amperes flowing in the above conductor causes a force on it equal to BLI newtons.
5. Power is equal to the product of a force times the velocity with which the load moves. If the load is a mechanical resistance, r, then the power p = fv = r v^2. When the load is a vibrating piston, its motion produces sound. The acoustic power generated can be thought of as being due to "radiation" resistance, with acoustic power = r_rad v^2 (i)
Later we will use a simple formula for r_rad to calculate the amount of sound radiated by a loudspeaker system. To avoid confusion, we shall use capital letters to indicate electrical quantities and lower case to indicate mechanical quantities.
6. Let's consider for our first step the electrical part of the problem: a power amplifier develops a voltage, Vo, which is applied to the terminals of the voice coil. Let the total electrical resistance of the voice coil circuit be denoted R. Then by Ohm's law, IR = Vo-V, where V, is the induced voltage caused by the voice coil's motion. Recall that this current, I, causes a force on the coil and cone equal to f = BLI, and that the cone velocity v, = V,/BL = f/z, where z, is the mechanical impedance of the cone. From these formulas, we calculate the electrical impedance of the system:
7. An important characteristic of any speaker system is its frequency response, by which is meant the frequency dependence of its acoustic power output for a constant amplitude driving voltage. When the radiation comes from the cone alone (no vent in the enclosure), we can simply apply equation (i) with the velocity given in equation (iii). Specifically, we calculate
This dimensionless number is a measure of the amount of sound radiated for a given amount of driving voltage. In the technical literature it is often referred to as "efficiency, which is something of a misnomer since the denominator is not exactly the electrical power input-it is rather the power that would be fed to a flat resistor R at the same voltage.
Because amplifiers generate an input-determined voltage, it is the response in equation (iv) that we shall be interested in.
The response is a function of frequency because r,,, and (especially) z, depend on frequency. When you have obtained formulas for these quantities, we shall be able to calculate a system's response.
Vented systems have, in addition to the cone motion v motion of air in the vent. We shall use the symbol v, to represent this motion, with v2 = (A1/A2) x vent air velocity.
The factor A1 /A2 is the ratio of the area of the cone to the area of the vent, and puts v2 on an equal footing with v2; such a definition will simplify some of the subsequent math.
Again, the response can be obtained from equation (i), but now we have two velocities which contribute to the sound and their vector sum must be used. Define the vent factor:
8. The mechanical impedance of a roomful of air, driven by one side of a piston whose area is A, square meters, is a complicated-looking sum of Bessel functions. At frequencies low enough that a wavelength is larger than the piston, however, the expression can be greatly simplified. This approximation is warranted because, as was explained in section II, direct radiator performance is much degraded at higher frequencies and must be rolled off. Thus we are primarily interested in the long-wavelength-approximation performance.
In this limit, the impedance has two terms. First, there is an imaginary term which is proportional to frequency; it represents the inertia of the speaker's air load, given by 0.576 A,' kilograms. The second term is real and is proportional to the square of the frequency; it represents the radiation resistance r_rad and is equal to 0.022 A1^2 f^2 where f is the frequency in Hertz.
9. The only remaining quantity in our equations is the mechanical impedance of the piston. This piston possesses a mass, m and is connected to the (hopefully) stationary enclosure wall by its suspension, whose spring stiffness is s2. It is also acted on by its suspension friction r1 its radiation resistance r_rad and, of course, by the pressure of the air in the enclosure. The enclosed air stiffness will be abbreviated s, and can be evaluated from the form given in section III. (V)
In the simple case of the unvented box, v2 = 0 and the impedance z, is easily obtained:

In this formula, m, includes the mass of the cone, voice coil, and the mass of the air load associated with the cone's motion.
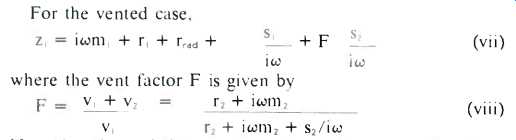
Note that the sealed enclosure is a special general formulas (v) and (vii). By comparing formulas (vi) and (vii), you will see that it is the factor F which distinguishes the sealed enclosure systems from those having a vent, i.e. from bass reflex systems. In the vicinity of the reflex enclosure's resonant frequency, the factor F becomes very large and so does z,. A large value of F indicates that most of the sound comes from the vent. It also means that, unlike the sealed enclosure case, the loudspeaker sees a high impedance at the bottom of its frequency range. It can consequently produce lots of radiated sound with only a small cone excursion. This fact explains why a well-designed reflex enclosure has less low frequency distortion than a well-designed air suspension system for the same sound output.
10. A useful quantity which describes the midrange response of a loudspeaker is its "asymptotic efficiency" which can be obtained from the above formulas in the limit that z, = iwm,:
Asymptotic efficiency = 0.0556 r_em A^2/m^2 percent. (ix)
11. All the formulas discussed above pertain to the analysis of some (perhaps hypothetical) existing system. For design purposes, however, we want to work the problem the other way: we wish to specify the performance of a system, and then find out what ingredients are required to achieve that performance. This process, usually termed synthesis, is much more difficult than analysis of a given system. A mathematical relationship between Q, S, and M has been discovered which when satisfied guarantees that the response curve will be as flat as possible for a given value of Q. (See ref. 6 and 7.) In addition, a maximally flat response curve was found to result from choosing Q=0.383, S=1.414, and M=1.414.
These findings have been verified by computer analyses of systems designed according to the guidelines presented in this article. (See ref. 8.) The results of these studies have been used in preparing the design curves in Fig. 2, 3, 7, and 9. In Fig. 10, we show computer-generated response curves for the systems arrived at in design illustrations 1, 2, and 3.
Annotated Bibliography
1. "Notes on the Development of a New Type of Hornless Loud Speaker," by Chester Rice and Edward Kellogg, Transactions of the American Institute of Electrical Engineers.
Vol. 44, p. 461, 1925. The invention of the moving-coil-and-cone loudspeaker was announced in this fascinating paper.
The authors described their invention as having many advantages over the other types of reproducers with which they had experimented, including electrostatic, throttled jet, "talking arc," and eddy current induction speakers. The need for a baffle for hornless loudspeakers was discussed, and the possibility of getting flat response from inertia-controlled pistons was recognized.
2. "The Theory of the Loudspeaker and Vibrating Systems," by Hans Roder, Radio Engineering. Vol. 16, #7, p. 10; #8, p. 21; # 9, p. 24; and #10, p. 19, 1936. Here, a thorough mathematical development of the properties of electrodynamically driven pistons is given.
3. "The Magic Voice," by C. O. Caulton, E. T. Dickey, and S. V. Perry, Radio Engineering, Vol. 16, #10, p. 8, 1936.
These authors describe how loudspeaker performance can be improved by (a) putting a back panel onto the loudspeaker's enclosure and (b) adding a vent to the resulting sealed box. Basically, then, these authors describe the invention of the bass reflex or "phase inverter" enclosure.
4. Acoustical Engineering, by H. F. Olson, D. van Nostrand, Princeton, 1957. This very important reference book gives a thorough treatment of a vast number of acoustical systems.
5. "Performance of Enclosures for Low Resonance High Compliance Loudspeakers," by J. F. Novak, IRE Transactions on Audio. Vol AU-7, #1, p. 5, 1959. In this excellent paper, Novak shows mathematically and experimentally how adding a vent to an enclosure lowers the amplitude of the cone motion at low frequencies and so reduces distortion.
6. "Loudspeakers in Vented Boxes," by A. Neville Thiele, Proc. I.R.E. Australia. Vol. 22, p. 487, 1961, and reprinted in J.A.E.S.. Vol. 19, No. 5, p. 382, and No. 6, p. 471, 1971.
In this landmark paper, Thiele analyzes bass reflex systems from the standpoint of the filter engineer. At low frequencies, lumped constant circuit theory is applicable to loudspeaker systems. A great variety of response curve shapes are derived, together with the data needed to create the actual hardware.
7. "The Theory of Maximally Flat Loudspeaker Systems," by Susan Lea and Michael Lampton, accepted for publication in IEEE Transactions on Audio & Electroacoustics. 1972. This rather mathematical paper shows that the shape of the response curve of a bass reflex system depends only on Q, S, and M and that the flattest possible curve is obtained with
Q =0.383, S=1.414, and M=1.414.
8. "Program WOOF: A Numerical Evaluator of Loudspeaker Systems," by M. Lampton, IEEE Trans. Audio & Electroacoustics, 1972. This note describes a computer program which evaluates woofer/enclosure designs.
9. "The Theory of Bounded Ripple Loudspeaker Systems," by M. Lampton, IEEE Transactions on Audio & Electro-acoustics. 1972. This paper develops the idea of the figure of merit of loudspeaker systems and analyzes the relationship between smoothness of response and the figure of merit.
(Audio magazine, Dec. 1973)
Also see:
Speaker Tests Phase Response (Dec. 1974)
Speaker Tests--Impedance (Sept. 1974)
Breakthrough in Speaker Testing by Richard C. Heyser (Nov. 1973)
= = = =