Manufacturer's Specifications
System Type: Two-way, aperiodic damped vented box.
Drivers: 7-in. (177-mm) cone woofer with 3-in. (75-mm) voice-coil and 1.1-in. (28-mm) soft-dome tweeter.
Frequency Range: Not stated; 47 Hz to 20 kHz, ±3 dB, measured.
Sensitivity: Not stated; 81 dB SPL measured at 1 meter for 2.83 V rms, averaged over range from 250 Hz to 4 kHz.
Crossover Frequency: Not stated; 2.5 kHz measured.
Impedance: 4 ohms nominal.
Recommended Minimum Amplifier Power: 50 watts per channel.
Dimensions: 15 3/4 in. H x 8 5/8 in. W x 11 in. D (40 cm x 22 cm x 28 cm).
Weight: 21 lbs. (9.6 kg) per system.
Price: $2,500 per pair; optional stands, $385 per pair.
Company Address: P.O. Box 13686, Research Triangle Park, N.C. 27709.
Dynaudio has been big in the systems market in Europe for 12 years but has only sold systems in the U.S. since earlier this year. Their U.S. lineup consists of 14 systems, extending from the Contour I Mk11 at $1,800 per pair up to the very pricey Consequence at $21,000 per pair. These are all serious high-end products, with appearance and features to match.
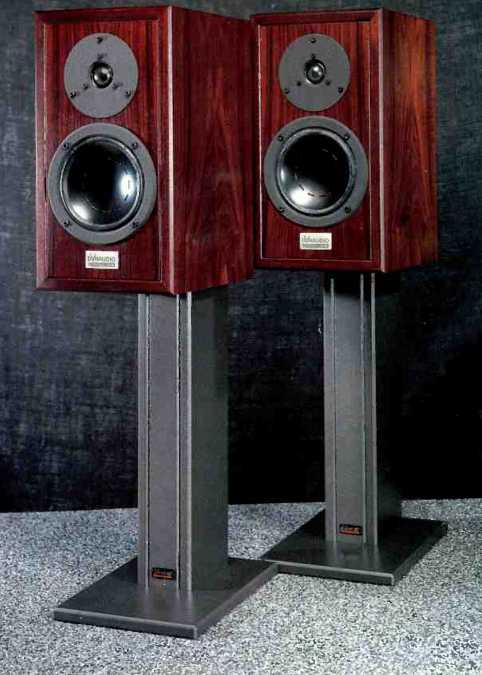
The Special One's handsome cabinet comes in matched rosewood-veneered pairs, finished on all six sides, but curiously is not supplied with a grille. (It looks great without it, however.) Both the appearance and the fit and finish of the system and components are superb. The systems were supplied to me with optional wooden stands that raise the cabinet about 19 inches (0.48 m) off the floor, which places the tweeter about 31 inches (0.79 m) high. The stands are angled so that the system axis is aimed upwards at about 2.7°, effectively orienting the tweeter axis toward the ears of a seated listener 10 feet (3 m) away. No spikes were supplied for the bottom of the stands for placement on carpet.
In addition to a standard set of gold-plated, five-way, double-banana jacks on the rear panel for input connections, the system has an additional input connector, about 1/2 inch (12.7 mm) in diameter, that is similar to a coaxial r.f. panel connector. This jack conforms to the Optional Connection System (OCOS) of precision loudspeaker cables and connectors, which is marketed by Dynaudio in Europe and by Sumiko in the U.S. The OCOS design closely matches the cable's characteristic impedance to the loudspeaker impedance, and this, it is claimed, improves sonics by minimizing the effect of the cable on the transmission of energy from amplifier to loudspeaker. Unfortunately, I was not supplied a set of OCOS cables and therefore was not able to evaluate the connection system's performance.
A design feature of the Special One that does improve its performance, with any kind of cable, is Dynaudio's use of impedance-correcting circuits to minimize the speaker system's impedance variation with frequency. This makes the system's impedance essentially resistive above 100 Hz.
With impedance correction, the system is much less susceptible to the effects of series cable resistance, which causes the voltage drive to an uncompensated system to vary with frequency. Theoretically, for a perfectly compensated speaker system, cable resistance will not cause any irregularities in frequency response but will only produce a drop in level.
The crossover of the Special One is noteworthy in that it contains 21 parts (three inductors, eight capacitors, and 10 resistors), most of which are dedicated to driver equalization and impedance correction. Dynaudio's crossover philosophy stresses first-order, 6-dB/octave designs with a single coil and capacitor in the signal path. Only film capacitors are used; the inductors are all air-core, and two of them use several conductors, with different diameters, in parallel.
This was done to improve the inductors' high-frequency operation and to decrease skin effect, which "is an important contributor to the fidelity of the system," according to the Special One's brochure. All internal connections are made with large-diameter multi-strand audiophile cable. Al though the crossover mounting board appears to be a printed circuit, it is not. The board is just a mounting surface for the components and allows all the parts to connect on the rear of the board by direct soldered connection of each of their leads.
The woofer of the Special One (a modified version of Dynaudio's 17W-75) has an effective radiating diameter of only 4.9 inches but has a huge voice-coil, 3 inches in diameter. Dynaudio claims that this large voice-coil provides a "balanced force transmission" and an ideal transfer of acceleration force from the coil to the cone, and that it contributes to the woofer's fast transient response. The large coil does provide a real increase in thermal power-
handling capacity. It also allows the ceramic magnet to actually fit inside the coil, thus creating an efficient magnet structure that is completely self-enclosed. The rear of the woofer appears very similar to that of the old Alnico speakers whose magnets were enclosed in iron pot structures.
This structure also has very low external stray magnetic fields, which would make it ideal as a speaker to be used with video systems. The woofer does not have a convention al cone and dust cap but has a shallow, one-piece, inverted diaphragm of hemispherical shape composed of "magnesium silicate loaded polypropylene." High frequencies are handled by a Dynaudio D-28 AF tweeter (it's nice to have complete specification sheets on the individual drivers of a system!), a soft-dome unit with a 28-mm diaphragm. The dome is made of a treated fabric that Dynaudio claims is free from the high-frequency break up problems associated with metal or hard plastic domes.
The tweeter's voice-coil uses hexagonal wire to maximize the amount of conductor in the magnet's air gap. It is then cooled and damped by Magnaflex, Dynaudio's own version of Ferrofluid.
Measurements
The equipment I used in evaluating the Special One's performance consisted of a Techron TEF System 12 Plus Time-Delay Spectrometry (TDS) analyzer, a B & K 4007 condenser microphone, a Crown Macro-Tech M2400 power amplifier, and various Leader general-purpose test instruments. Tests were performed at a number of locations, including my own listening room and lab and outdoors on my driveway, using elevated free-field, near-field, and ground-plane measurement techniques.
The test of system on-axis frequency response was performed at a distance of 2 meters, normal to the front baffle, on an axis halfway between the tweeter and the low-frequency driver. The input level was 2.83 V rms, which is equal to a level of 2 watts into the system's nominal 4-ohm impedance. The on-axis response was corrected to the standard distance of 1 meter for display of the data, and a tenth-octave filter was used to smooth the response.
The 1-meter, on-axis frequency response of the Special One for an input of 2.83 V rms is shown in Fig. 1. The curve, of course, was taken without a grille because none is supplied. The main feature of the curve is its low level, about 81 dB SPL (averaged over the range from 250 Hz to 4 kHz). If 2 V rms had been used instead, corresponding to 1 watt into the rated impedance of 4 ohms, the sensitivity would have been an even lower 78 dB SPL. The response exhibits a deviation of approximately ±3 dB from 47 Hz to 20 kHz; its major feature is a 5-dB peak-dip combination in the cross over range of 2 to 4 kHz. If the crossover anomaly is excluded, the response is even tighter: ±2 dB from 55 Hz to 10 kHz.
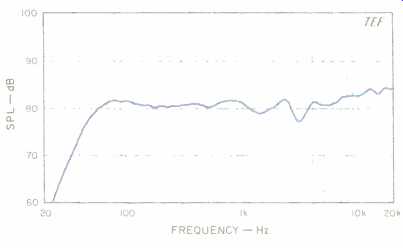
Fig. 1--On-axis frequency response. The system exhibits a significantly
low sensitivity of about 81 dB SPL for 2.83 V rms applied.
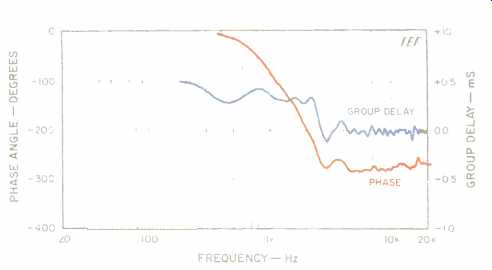
Fig. 2--On-axis phase response and group delay, corrected for tweeter
arrival time.
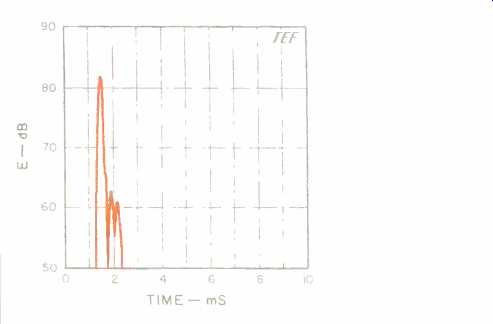
Fig. 3--One-meter on-axis energy/time curve.
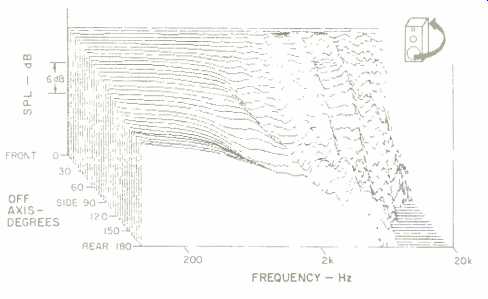
Fig.
4--Horizontal off-axis frequency response, taken from the front, around
the side, and to the rear of the speaker and normalized to the on-axis
response; see text.
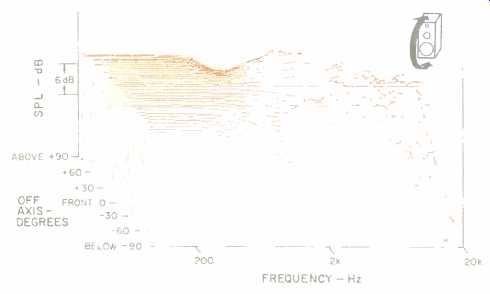
Fig. 5--Vertical off-axis frequency response, taken from below, up the
front, and to the top of the speaker and normalized to the on-axis response.
A separate test, comparing the axial response of both right and left speakers in the range from 200 Hz to 20 kHz (not shown), yielded a moderately good match of about ± 1.5 dB. The level differences were primarily due to one unit's woofer being lower in sensitivity than the other's.
Figure 2 shows the on-axis phase and group-delay responses of the system, corrected for the time arrival of the tweeter. The phase response exhibits a fairly small amount of phase rotation. about 180° between 1 and 20 kHz. The group delay indicates that the woofer trails the tweeter by a significant 0.50 mS (500 uS), which corresponds to a distance of about 63/4 inches (171 mm). This time offset represents approximately 1.25 wavelengths, or 450°, at the cross over frequency of 2.5 kHz. Some of this measured offset is due in part to phase aberrations, minimum-phase in character, which would go away if the system's amplitude were flatter in the crossover region. As Richard Heyser pointed out in his writings, use of the term "group delay" is technically correct only when applied to systems whose amplitude response is essentially unchanging with frequency (R. C. Heyser, "Loudspeaker Phase Characteristics and Time Delay Distortion, Part 2," Journal of the Audio Engineering Society, April 1969).
The crossover frequency and its phase relationships were determined by reversing the woofer leads and then noting the changes in the axial frequency response (curve not shown). If the woofer and tweeter are essentially in phase throughout the crossover range (which minimizes lobing error), the response with the connections reversed will exhibit a deep null at crossover. With the connections re versed, a dip of about 15 dB was noted at 2.5 kHz, which indicates that the crossover is at or near this frequency.
However, below crossover, between 800 Hz and 1.8 kHz, the response actually rose by about 2 to 3 dB under these conditions, indicating that the woofer and tweeter are some what out of phase in this region when connected normally. This corresponds to the shallow depression in the axial response between 1 and 2 kHz.
I further scrutinized the Special One's crossover by measuring each driver's input voltages and acoustical response while both drivers were connected to the network. The electrical measurements (not shown) indicated that the crossover was essentially a first-order, 6-dB/octave design, but the acoustic measurements revealed that the result was not a pure first-order response. (This is good, as a first-order acoustic response also has a maximum amount of lobing error because the phase of the drivers differs by 90° at crossover.) The tweeter rolled off at 6 dB/octave through most of the crossover region but ultimately rolled off at 12 dB/octave below 1.5 kHz. The woofer, however, was fairly flat up to crossover, where it rolled off at the high rate of about 60 dB/octave above 2.5 kHz: Its response dropped 30 dB between 2.5 and 3.5 kHz! The measured acoustic phase response of the individual drivers' output (driven by the crossover) established that both drivers were effectively in phase at crossover and above but rapidly went out of phase below crossover. This out-of-phase condition was the primary cause of the lobing error below crossover noted previously.
A high-level, low-frequency, sine-wave sweep revealed that the woofer's maximum linear excursion capability was about ±0.12 inch (0.25 inch peak to peak). The driver was quite capable of being driven to much higher excursion amplitudes, up to about 0.75 inch peak to peak, but with correspondingly higher distortion. Moderate dynamic offset was noted at frequencies between 80 and 140 Hz at levels of 8 V rms and higher.
The woofer had an effective radiating diameter of about 4.9 inches (125 mm). The box was quite well sealed except for its air-resistance port. The enclosure side walls were quite rigid and exhibited no wall vibrations.
The effect of the air-resistance vent was evaluated by making near-field response measurements and by running a high-level sine-wave sweep to check the effect of the vent on the displacement of the woofer. Near-field measurements were made on the woofer with the vent open and closed. This disclosed that the vent reduced the woofer's output by an average of about 1.5 dB over an octave centered at 60 Hz. A near-field measurement of the vent revealed that it had a bandpass response characteristic which peaked at 60 Hz at a level about 15 dB below the woofer's output and then rolled off at about 6 dB/octave above and below 60 Hz. The high-level sine-wave sweep revealed that the vent reduced the cone's displacement by a maximum of about 20% at 60 Hz.
These measurements are consistent with conventional vented-box operation: The woofer's displacement and output are reduced at box resonance while, at the same time, maximum sound energy is radiated from the vent. The major difference here is that the vent contains damping material which acts as a resistance to the flow of air. The high amount of damping changes the vented-box response into a quasi-closed-box response. The overall response, rather than rolling off a' 24 dB/octave below cutoff like that of a standard vented box, rolls off initially at 12 dB/octave like a closed-box system and then at 18 dB/octave far down below cutoff. The vent's output also rolls off initially at 6 dB/ octave on either side of box resonance rather than the vented box's 12 dB/octave.
Damping the vent gives a vented-box system many of the advantages of a closed box. For one thing, the system's roll-off becomes more gradual below cutoff, affording better transient response and superior subsonic control of cone displacement. Above cutoff, however, the system retains some of the vented box's displacement and distortion-reduction capabilities. A full vented-box alignment for this woofer would allow much more displacement and distortion reduction at and near box resonance but would yield much poorer subsonic control of cone displacement and poorer transient response at cutoff.
The on-axis, 1-meter energy/time response (ETC) for an input of 2.83 V rms is shown in Fig. 3. The test signal is swept over the range from 200 Hz to 10 kHz and primarily emphasizes the tweeter's response. The response is quite well behaved, with only two later arrivals some 20 dB down.
Figures 4 and 5 show, respectively, the "3-D" horizontal and vertical off-axis frequency response of the Special One. These curves were derived from measurements made at increments of approximately 5° along the major horizontal and vertical planes of the system. No additional smoothing was done on these curves except for the constant-band width smoothing that results from the TDS measurement process. These graphs are normalized and have logarithmic frequency scales. The normalization clearly shows the differences between the on- and off-axis curves, because the on-axis curve is a straight line and the off-axis curves only show the deviation from it.
The curves in Fig. 4 indicate fairly good behavior off the horizontal axis, with high-frequency coverage out to 40° off axis up to about 17 kHz. The vertical off-axis curves in Fig. 5 are also fairly well behaved but exhibit some asymmetries just below crossover, between 800 Hz and 25 kHz. Fortunately, the resulting lobing error makes the response smoother for upward rather than downward angles, thus improving the response for standing listeners. Note that the down-angle responses are at the front of this graph.
The mean horizontal and vertical on- and off-axis response curves of the system are shown in Figs. 6 and 7. These responses were derived from the previous data by calculating response averages of several adjacent curves in specific angular regions. The mean horizontal responses are shown in Fig. 6. All three curves are mostly flat and fairly smooth except for progressively more high-frequency roll-off as the angle increases. The fairly smooth horizontal responses indicate that the systems should maintain good stable stereo images over a broad horizontal listening area, but with some high-frequency loss at extreme angles. The mean vertical responses are shown in Fig. 7. Except for a slight depression between 1.5 and 3.5 kHz, the mean vertical axial response-covering positions ± 15° of the axis-is very similar to the mean horizontal axial response.
Because ± 15° includes both sitting and standing listeners, the similarity of these two curves indicates that the tonal balance of the system should change very little with changes in listener height.
The 30° to 45° mean response, also fairly smooth, has a narrow dip centered
at 2.2 kHz and a rise in the response just below crossover, in the region
from 1 to 2 kHz. The 60° to 75° mean response has a deeper notch in the
response, at 1.9 kHz, and rolls off above 8 kHz. The fairly uniform vertical
mean responses imply that the Special One should reproduce 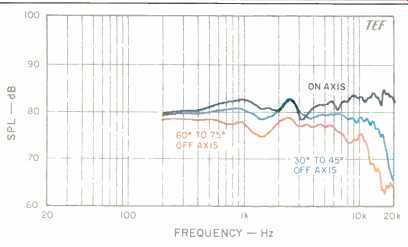 the height
information encoded in some CDs quite well.
the height
information encoded in some CDs quite well.
Fig. 6--Mean horizontal responses derived from data of Fig. 4; see text.
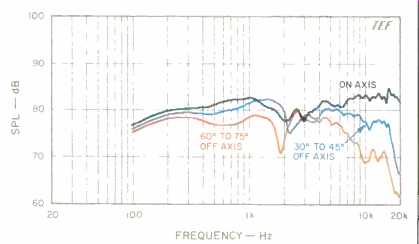
Fig. 7--Mean vertical responses derived from data of Fig. 5.
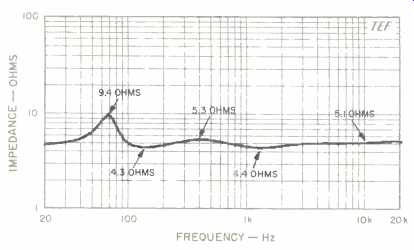
Fig. 8--Magnitude of impedance; note the logarithmic vertical scale.
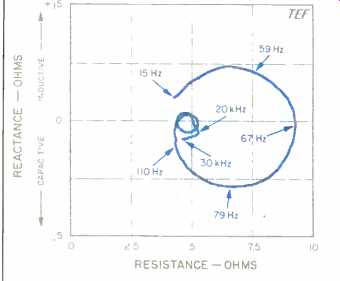
Fig. 9--Complex impedance, showing reactance and resistance vs. frequency.
Note that the horizontal and vertical scales cover only a 10-ohm range.
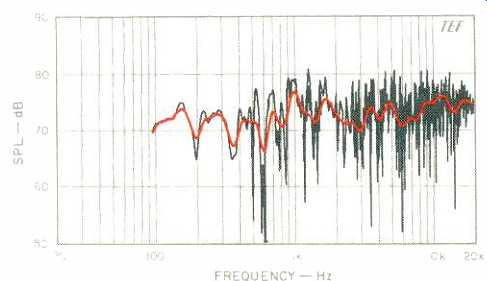
Fig. 10--Three-meter room response, showing both raw and smoothed data;
see text.
Figure 8 shows the Special One's magnitude of impedance from 20 Hz to 20 kHz. A minimum impedance of 4.3 ohms at 150 Hz and a maximum of 9.4 ohms at 70 Hz were measured. Above 100 Hz, the impedance only varied from a minimum of 4.3 ohms to a maximum of 5.3 ohms! This low variation of impedance over the whole frequency range makes the Special One quite insensitive to cable resistance.
Because the impedance changes very little with frequency, fairly high cable resistance, up to 0.3 ohm, can be tolerated before it causes peaks and dips of more than 0.1 dB in the voltage drive.
Figure 9 is a Nyquist diagram of the complex impedance (that is, a polar plot of magnitude versus phase) over the range from 15 Hz to 30 kHz. Note that the horizontal and vertical scales only cover a range of 10 ohms. Most of the activity on the graph occurs around the resistive 5-ohm point on the horizontal scale. The large circle is due to the primary closed-box resonance of the woofer, which occurs at about 70 Hz. The designers of the Special One have chosen to impedance-correct the system only above 100 Hz. The corrected range does include the very important upper bass and midrange areas of the system's response, however. The rather low impedance variation of the system indicates that it should present a very well-behaved load to any amplifier.
Figure 10 shows the 3-meter room curve of the system; both raw and sixth-octave smoothed data are shown. The system was located in the right stereo position, with the test microphone placed at ear height, at the listener's position on the sofa. The system was swept from 100 Hz to 20 kHz with a sine-wave signal at a level of 2.83 V rms, corresponding to 2 watts into a 4-ohm load. The resultant sound levels can be read directly off the graph. The parameters of the TDS sweep were chosen to include the direct sound plus 13 mS of the room's reverberation; this mimics the averaging time of human hearing. In general, the curve is fairly flat and extended except for some peakiness in the smoothed response in the upper midrange between 800 Hz and 2 kHz.
The effects of floor bounce in the upper bass and lower midrange are not much in evidence.
Figures 11, 12, and 13, respectively, show the spectra of harmonic distortion versus power level at the musical notes of El (41.2 Hz), A2 (110 Hz), and A4 (440 Hz). These curves indicate the level of harmonic distortion generated by the system with the application of a single-frequency sine wave at power levels from 0.1 to 100 watts (-10 to + 20 dBW, a 30-dB dynamic range). The power levels were computed using the rated system impedance of 4 ohms.
The curves were run by successively increasing the sine-wave input level in 1-dB increments. At each power level, a swept spectrum analysis was done over a frequency range covering up to the fifth or sixth harmonic. Two precision 1-dB/step attenuators were used in the setup, one in the send path and one in the receive path, to ensure accurate power-level steps. The receive attenuator provides a constant fundamental level to the spectrum analyzer so that distortion percentages can be directly read off the plotted data scales.
Figure 11 shows the El (41.2-Hz) harmonic distortion data. The non-harmonically related spikes, at lower power levels, are due to background noise in the measurement setup and were not generated by the loudspeaker. At lower power levels, the second and third harmonics are primarily evident, with the second harmonic higher; at higher power levels, the fourth, fifth, and sixth harmonics join the lower ones. At these higher levels, the third harmonic predominates and reaches a level of 67% at 100 watts. The second harmonic reaches its maximum of 37% at 10 watts and then, curiously, decreases to a measure of 5.6% at 100 watts. The high levels of third harmonic indicate that the suspension is symmetrically running out of excursion capabilities in both directions, while the high second harmonic indicates a one sided nonlinearity.
Even though the system was generating quite high levels of harmonic distortion at 100 watts, I was impressed by its ability to sound undistressed at these high levels. The speaker overloaded quite gracefully and did not generate any of the nasty extraneous sounds that many other woofers generate when overloaded. Note that this system generates roughly 95 dB SPL at 1 meter with an input of 100 watts at 41 Hz.
Fig. 11-Harmonic distortion products for the musical tone E1 (41.2 Hz). Even though the distortion measured quite high at 100 watts, the system was not generating any audible "distress type" sounds, so the output did not sound as bad as the high levels of distortion would suggest.
Fig. 13-Harmonic distortion products for the musical tone A4 (440 Hz).
Fig. 12-Harmonic distortion products for the musical tone A2 (110 Hz).
The A2 (110-Hz) harmonic data is shown in Fig 12. The graph illustrates that only the second harmonic was significant over most of the power range. The second harmonic increases gradually with power, reaching a fairly high level of 19.5% at 100 watts. As before, even at 100 watts, the system was not making any bad noises, even though severely overloaded. As in the previous graph, the nonharmonic, random information seen in the plot was not produced by the speaker but by background noise and other uncontrolled effects in the test setup.
The A4 (440-Hz) harmonic measurements are shown in Fig. 13. As in Fig. 12, the predominant distortion is a low amount of second and third harmonics with negligible amounts of higher orders. The second harmonic, which is somewhat obscured by the fundamental bleed-through at the left of the graph, did not exceed 0.3% at any power level. The third harmonic measured only 0.6% at 100 watts but reached an intermediate peak of 1.5% at 3.16 watts.
This harmonic exhibited strange behavior, jumping up from negligible distortion at the 2.5-watt step to 1.5% at 3.16 watts. I repeated this test on both systems and got essentially the same result. I have no explanation for this behavior, but fortunately the distortion was quite low in either case.
Figure 14 shows the IM distortion on a 440-Hz (A4) tone created by the simultaneous reproduction of a 41.2-Hz (E1) tone of equal input power. The distortion gradually rises with power, reaching a high level of about 46% at 100 watts. The first-order (f2 ± f1) and second-order (f2 ± 2f1) side frequencies predominated in this power range. The distortion was quite high because the rather small woofer handles all frequencies up to 2.5 kHz, including both frequencies of this intermodulation test.
Fig. 14--IM distortion on 440 Hz (44) produced by 41.2 Hz (E1) when mixed in one-to-one proportion.
Fig. 15--Maximum peak sound output, measured at 1 meter on axis, and corresponding maximum peak input power levels.
The effect of gain for a typical room is shown below 200 Hz on the output curve. At 630 Hz and above, the peak power was limited by the test amplifier's clipping at 8.5 kW into 4 ohms.
Though the speaker is quite low in sensitivity, it can reach the quite commendable level of 120 dB SPL above 300 Hz.
Figure 15 shows the system's short-term peak-power in put and output capabilities as a function of frequency. The tests were run by exercising the system with a high-level, shaped, 61/2-cycle, sine-wave tone-burst signal generated by the Crown M2400 power amplifier configured in the bridged mode. The test signal covers a third-octave band width with a time duration that increases as the frequency goes down. The duty cycle of the test signal is low enough so that the long-term thermal characteristics of the speaker under test are not exercised.
The test consisted of determining the maximum peak input power-handling capacity and maximum peak output sound pressure levels, in the range from 10 Hz to 20 kHz, at all the third-octave center frequencies. The peak input power was calculated by assuming that the measured voltage was applied across the rated 4-ohm impedance.
The test sequence consisted of determining how much of the burst signal could be handled by the speaker, at each frequency, before either the output sounded audibly distorted or the acoustic output waveform appeared distorted, whichever occurred first. At each frequency, the maximum peak input voltage and the corresponding generated peak output sound pressure level at 1 meter were recorded.
Dynaudio actually implements a test similar to my peak power test. They measure the frequency response of a speaker dynamically, using tone bursts applied at various power levels. The technique is explained in a Dynaudio white paper which describes a series of tests actually run on the tweeter of the Special One (a D-28 AF). These tests show that the frequency response of the tweeter, measured dynamically, changes very little for peak levels from 1 to 1,000 watts.
The maximum peak electrical input power-handling capacity of the Special One, as seen in Fig. 15, rises fairly smoothly with frequency until about 600 Hz, where the peak limit of the power amplifier was reached at about ± 180 V. Assuming the rated system impedance of 4 ohms (the actual impedance is somewhat higher), this is a power level of about 8,000 watts! The slight roll-off in input power above 10 kHz is due to the amplifier's high-frequency peak power limitations.
Below 100 Hz, however, the input power handling drops rapidly to 15 watts peak at 40 Hz and to 2 watts at 25 Hz (and all lower frequencies) before linear operation is exceeded. As stated before, even though these low-frequency power ratings are quite low, the system could handle considerably more power with increased distortion but without sounding stressed.
The upper curve in Fig. 15 shows the maximum peak sound pressure levels the speaker can generate at a distance of 1 meter on axis for the levels shown in the lower curve. Also shown on the upper curve is the "room gain" of a typical listening room at low frequencies. This adds about 3 dB to the response at 80 Hz and 9 dB at 20 Hz. (See the Dahlquist speaker review in the August 1990 issue for more information on room gain.) Above 400 Hz, the speaker can generate very substantial peak levels, about 120 dB SPL. (That's about as high as any speakers I have evaluated using this test.) This means that even though the sensitivity of the Special One is quite low, it has a correspondingly higher input peak power-handling capacity, which more than makes up for its decreased sensitivity. The maximum output drops quite rapidly below 100 Hz, however, falling at the rate of about 50 dB/octave between 25 and 50 Hz. With room gain, a single system can generate fairly clean peak levels in excess of 110 dB only above 120 Hz. At 40 Hz, the level drops to 90 dB and at 25 Hz is an essentially unusable 73 dB SPL.
Fortunately, a pair of these systems operating with a mono bass signal will be able to generate levels some 3 to 6 dB higher in these ranges. However, one can offset the subjective effects of the low output at low frequencies by boosting the input to the speakers in this range. As mentioned, the system is capable of much higher maximum output if one can accept the resultant distortion, and the ear is quite tolerant o' distortion at low frequencies. The Special One's woofer is different from most in that it overloads quite gradually when driven beyond its linear range and can generate significantly higher low-frequency output but with increased distortion. Dynaudio's specification sheet for the 17W-75 woofer used in the Special One rates the linear excursion of the driver at 0.22 inch (5.5 mm) peak to peak and the maximum excursion at a healthy 0.75 inch (19 mm) peak to peak, some 3.5 times higher! Woofers typically have maximum ratings only about 1.5 to 2 times higher than their linear ratings, which means that their distortion rises much more rapidly when their linear ratings are exceeded.
Use and Listening Tests
Listening was conducted in a room which has dimensions of approximately 15.5 x 27 x 8 feet (4.7 x 8.3 x 2.4 m); it is furnished as a normal living room and has wall-to-wall carpeting. Source driving gear included an Onkyo Grand Integra DX-G10, a Rotel RCD855, and Meridian 206 CD players; a Krell KSP-7B preamp; a Krell KSA-200B solid state power amplifier, and Straight Wire Maestro speaker cables and interconnects. As noted, I did not have access to OCOS speaker cables and so was not able to evaluate the Special Ones using the OCOS input jack. As in the past, most of my listening was done before the measurements were made.
The Special Ones' lack of front grilles had its down side:
My youngest boy poked in one system's tweeter dome with his fingers. I carefully popped the dome out with a straight pin, and the system fortunately did not suffer any ill effects. This is one minor advantage of a cloth soft-dome tweeter over a metal hard-dome unit.
Most of my listening was done with the Special Ones placed at my usual source position, which is well out in the room, about 6 feet (1.8 m) away from the short rear wall, and separated by 8 feet (2.4 m). This left a spacing of about 4 feet (1.2 m) from the side walls. All the listening was done with the speakers mounted on the supplied wooden stands.
The systems were aimed horizontally at my normal listening position so that I was on the speakers' axis. Listening took place on the sofa, about 10 feet (3 m) away.
My initial listening was done using a B & K demo disc (Bruel & Kjaer Pro Audio, CD-4090). I was quite impressed with the Dynaudio speakers' ability to sound very similar to my reference systems. Excluding very deep bass, I some times found myself favoring the Special Ones over my reference systems. The Ones were slightly brighter on vocal sibilants, as demonstrated on the first track (Little Feat) of the B & K sampler. Imaging was always sharply focused when the selection required it, as in Julianne Baird's tracks (3 and 13). On the pink-noise track, the systems essentially passed the stand-up, sit-down test; there was only slight midrange coloration when standing up. Horizontal high-frequency coverage was quite adequate and smooth, with no hot spots.
Very low-frequency capabilities were assessed by playing the third-octave, band-limited pink-noise tracks on the B & K disc. The playback level was set using the 20-, 25-, and 31.5-Hz tracks so that when I listened from close up, the systems were just below the audible overload point at these frequencies. Back at the listening position on the couch, I found that at that level a single system was only audible when playing the 40-Hz and higher bands. With both systems operating in mono, I could hear the 31.5-Hz band but with minimal level. When the level was raised, the lower frequencies did seem to become audible, but the high-frequency distortion components seemed to predominate. Note that band-limited pink noise is quite demanding because of its high crest factor; the Special One handled steady-state signals (such as sine waves or sustained organ pedal notes) much more effectively, generating fairly adequate levels. Moving the systems closer to the rear wall corners improved the low bass but at the expense of the upper bass and mid-frequencies. The acoustic bass on the Tuck and Patti selection (track 12), which contains low end more in the Special One's range, was reproduced very evenly, with very little overemphasis of individual notes. On the very demanding organ arrangement of "Pictures at an Exhibition" (Dorian DOR-90117), the Special Ones did surprisingly well on the high-level pedal notes; intermodulation distortion sounded fairly low. However, to reproduce the heavy pedal notes at 0:51 to 0:56 of track 2 without high subjective distortion, the speakers could be turned up only to 85 dB on the sound level meter's "C" scale.
I initially had some reservations about the Special Ones due to their low sensitivity, but now that I have used them for a while, my reservations are gone. With an amplifier of adequately high power, the systems can generate very respectable levels at all frequencies except very low bass. I played several selections, monitoring the output at the listening position with my sound level meter's "A" and "C" scales and the corresponding amplifier peak output voltages with a peak-responding voltmeter. On Stravinsky's "Symphony of Psalms" (track 8 of the Klavier Sampler, KCD 1990), the massed vocals in the finale, which were reproduced very cleanly, generated 91 dBA on the meter's slow scale from a peak input of 37 V (340 watts peak into 4 ohms). The quite clean and realistic playback of the horns on track 14 of the same disc generated 96 dBA on the fast scale (loud!) with peaks of 57 V (810 watts peak). If one used an amplifier of more modest power, maximum levels would be somewhat lower. However, these measurements do show that the Dynaudio speakers won't take a back seat to most other systems if a powerful enough amplifier is used. For the Special Ones, there is essentially none of the usual trade-off of output capability for small size, only the inevitable trade-offs of higher power requirements and somewhat lower bass output.
The Special Ones reproduced the delicate high-frequency sounds on track 6 of David Chesky's Club de Sol album (Chesky JD33) with much smoothness and realism. (This is one of my favorite CD tracks for contemporary non-classical demo purposes.) On Bob's Diner (dmp CD-471), the vocals on track 4 were reproduced with no trace of harshness. The cymbal crashes at 0:33, 0:37, and 0:40 on cut 7 were very clean; overall, the track had good dynamics and ample low-end underpinning. On track 12 of Reference Classics: First Sampling (Reference Recordings RR-S1CD), the harpsichord was rendered very realistically and the distinctive, sharp attack sound of the plucked strings was conveyed very well.
On demanding program material, the Special Ones presented an uncolored, quite open, neutral sound. Extended listening did not diminish my enjoyment of them. The small size of the systems, coupled with the vertical orientation of their drivers, contributed to very precise stereo imaging and unambiguous lateral source positioning. The Special Ones had smooth response in the upper bass, and the quality of the reproduced male voice was quite natural and not tubby.
Except for the very low bass, the Special Ones can keep up with the best systems. Adding a quality subwoofer and an associated high-level crossover to the Special Ones could give you a very high-quality, audiophile-grade satellite system that would not take backtalk from many other systems regardless of cost.
Are the Special Ones for you? At $2,500 a pair, the Special Ones are definitely premium priced. Like fine wine, however, the higher price may be acceptable to those whose wallets allow and who desire a very accurate, good looking, high-performance small system with many audiophile qualities.
-D. B. Keele, Jr.
-----------------------
(Source: Audio magazine, Dec. 1990)
Also see: