Gain of 1000 or 10,000, calibrated noise bandwidths including “A” weighting, and a low noise figure with low and high source resistances facilitate accurate measurements of noise and sub-microvolt signals.
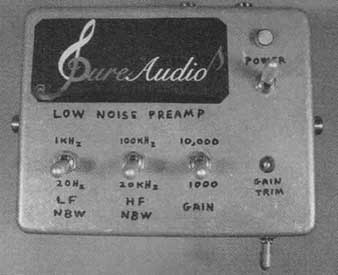
PHOTO 1: Low-noise preamp.
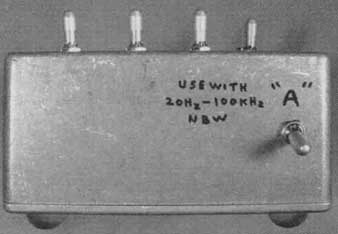
PHOTO 2: Front.
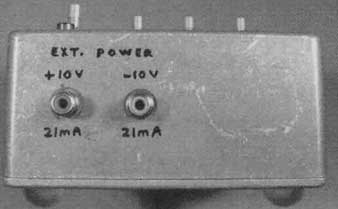
PHOTO 3: Rear.
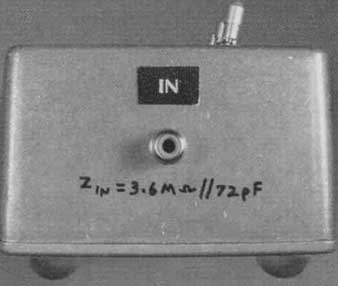
PHOTO 4: Left side.
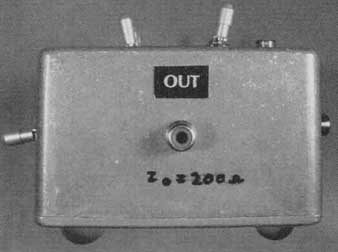
The preamp as shown in Photos 1-5 (above) is in a Hammond 1590C box (4.72” x 3.70” 2.07”), which is tightly packed inside (not shown) with the circuitry on a solid copper ground plane board. I recommend the larger Hammond 1590D (7.38” x 4.70” x 2.05”), Digi-key HM154.
The circuit (Fig. 1A) uses a low-noise dual (paralleled) JFET (Q1), the Linear Systems LSK389B in a feedback configuration with the low- noise AD797AN opamp (U1) for the input s This provides very low input voltage noise (about 1nV _/ Hz density, 148nV 20Hz - 20kHz noise, 112nV “A” weighted), negligible current noise, and very stable gain (100 = 40dB).
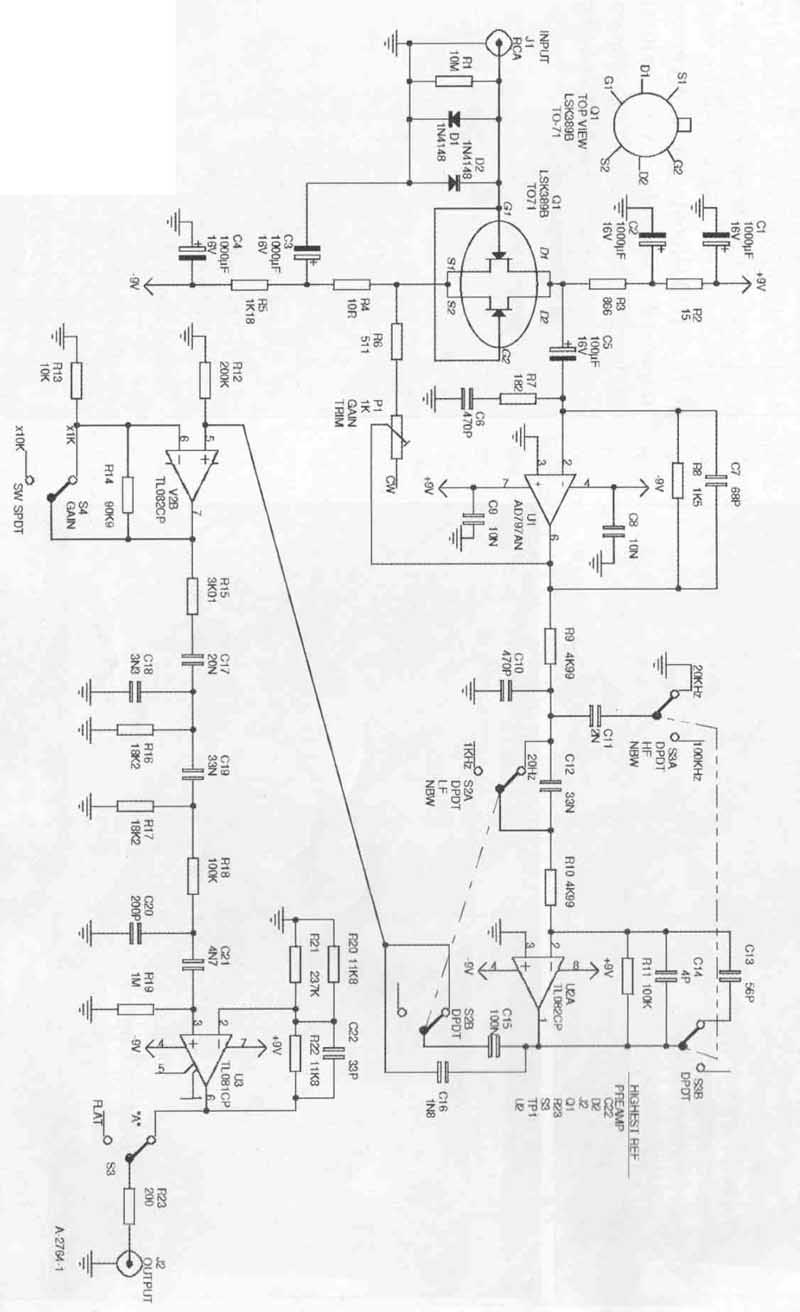
FIGURE 1a: Low-noise pre-amp schematic.
EQUIVALENT NOISE BANDWIDTH
Table 1 shows the noise bandwidth (NBW) of several common low and highpass filters. NBW means the LF or HF cutoff of an ideal “brick wall” filter that would, with white noise input (constant power per Hz BW), output the same total noise RMS voltage as the actual filter being considered.
The preamp has the following NBW selections:
1. LF points of 20Hz or 1kHz.
2. HF points of 20kHz or 100kHz.
3. “A” weighting: when used with the above NBW switches in the 20Hz - 100kHz positions, the response is within +0.5, -0.8B of the standard curve shown in Fig. 6.
The gain at 1kHz is within ±0.1dB of that with the “A” weighting switch off.
“A” weighting is used in signal/noise ratio (SNR) measurements because it’s a good approximation to our low-level hearing response. The 1kHz LFNBW selection, like “A” weighting, greatly attenuates 60/120Hz AC line hum, but unlike the “A” curve, the pass band response is flat. Since 1kHz is only 5% of the audio band, the measurement (with fairly flat noise spectra) is close to 20Hz— 20kHz total noise voltage, and is useful when there’s significant hum contamination. The 100kHz HFNBW selection is provided when a fiat audio response is needed, such as for spectrum analysis.
GAIN
With gain set to 1000 (60dB), micro-volts in become millivolts out. With the preamps maximum output of ±7.2V peak, this allows a maximum sine wave of 5.1V RMS. But with typical (Gaussian) noise, 2.4V RMS is the maximum without significant error-producing peak clipping. So with gain of 1000, the maximum noise input is 2.4mV RMS.
The gain setting of 10,000 (80dB) allows for the most sensitive noise measurements. The preamp’s own “A” weighted input noise of 112nV RMS then outputs 1.12mV, which can be accurately measured on a true-RMS meter such as the Fluke 189 ($500) or the much less expensive older Fluke 8010A. Noise levels lower than the preamp’s own noise can be calculated by RMS subtracting it out.
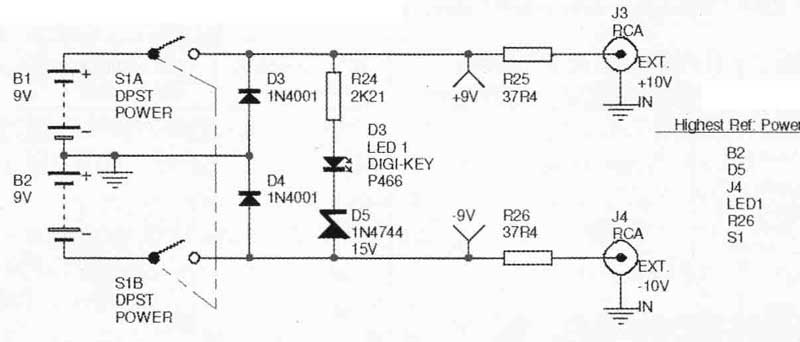
FIGURE 1B: Power supply schematic.
GAIN STABILITY AND NBW VERIFICATION
I connected a precise 1000:1 attenuator to the input, consisting of a series 99.90k and shunt 100.001k resistive divider, then set the gain with this attenuator to unity The preamp’s switches were set to gain = 1000, LFNBW = 20Hz, HFNBW = 100kHz, “A” weighting off. The pre amp’s gain at 1kHz was then set to 1000 ±0.01% (±0.0009dB).
Gain change versus supply voltage was +0.037dB per volt. Temperature drift was —0.035dB/°C. Warmup change from 10 seconds to 10 minutes was —0.007dB. Note: After power-on, it takes six seconds for the bias caps to sufficiently charge.
The frequency response plots in Fig. 2 show the effects of the LF and HF noise bandwidth switches.
CIRCUIT
The input is DC-coupled to the JFET gates for lowest noise. D1, D2 protect the JFETs from static discharge, and so on. If an AC-coupled input is desired, I recommend a 100nF 630V film capacitor. I use one installed in a shielded cable assembly, for noise measurements on circuits (such as power supplies) having more than ±100mV DC (the maximum allowable without a blocking cap). The series lO0nF cap increases the preamp’s 20Hz — 1kHz noise floor by about 0.4dB.
Input impedance is 3.6Mf This capacitance is low for a JFET input because the drain signal sees the “virtual ground” of U1’s inverting input, thus eliminating Miller effect. R7, C6, and C7 ensure HF stability of U1 and the JFET/opamp feedback loop (U1 has a GBW product of 110MHz). R8 provides DC stability of U1.
For lowest noise and spurious pickup, R1, D1, D2, and C3 should have their ground terminals connected to a chassis ground lug on the input jack J1. The output of U1 has a gain of 100 (40dB) re the input, and a —3dB BW of about 10Hz to 500kHz.
SECOND STAGE
U2A has a gain of 10 (20dB). Switches S2 and S3 select the LF and HF rolloffs corresponding to the selected LF NBW and HF NBW. C15 and C16 also remove accumulated DC offsets.
THIRD STAGE
U2B has a flat response and selectable gain (by S4) of 1 or 10, for an overall preamp gain of 1000 or 10,000.
“A” WEIGHTING
The circuitry from U2B output to U3 output is based on that used in the article “Noise Meter Amp”, but with higher impedances allowing smaller caps, and some tweaking. I selected R21 for a 1kHz gain match (±0.02dB) re the “flat” position of S5. Depending on “A” network component tolerances, you might need a different value for R21 (and possibly R20) if you want fractional dB accuracy.
POWER SUPPLY
Figure 1B shows the simple dual 9V alkaline battery supply used. The relatively high current drain of ±21mA results in a battery life of about 10 hours. Of course, higher capacity NiCd, NiMH, or lithium ion/polymer batteries can be used. The specified blue LED, with R24 and D5, serves as a low-battery indicator, extinguishing when the batteries discharge to 8.5V.
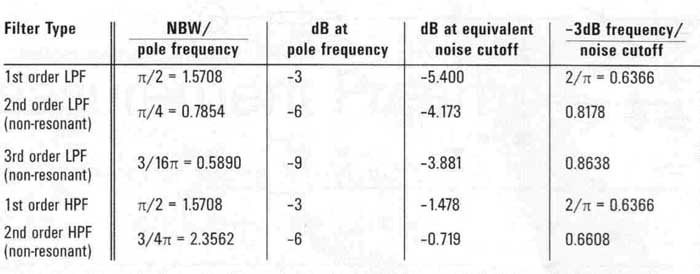
TABLE 1: Noise bandwidth of several non-resonant filters (multiple poles
at the same frequency). NBW = equivalent noise cutoff frequency, low or high
cut.
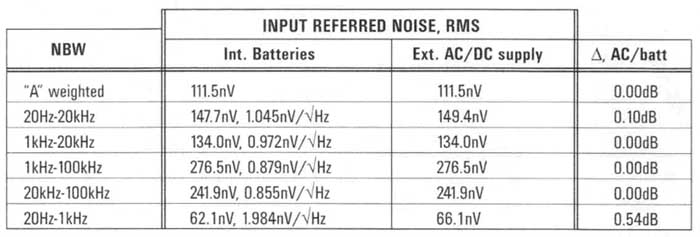
TABLE 2: PREAMP INPUT NOISE.
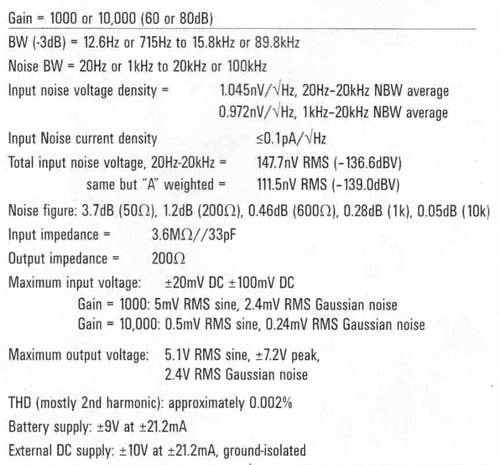
TABLE 3: PERFORMANCE DATA.
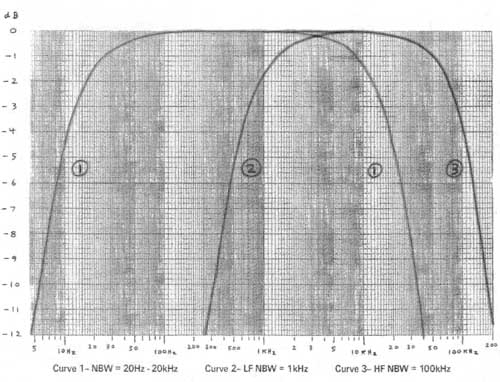
FIGURE 2: Frequency response. 1—NBW = 20Hz-20kHz, 2—IF NBW = 1kHz, 3—HF HBW
100kHz.
EXTERNAL SUPPLY
An AC line powered ±10V supply can be used if it’s ground-isolated. Table 2 shows the preamp’s input-referred noise with its batteries or an external LM317/ LM337 regulated supply having about 40uV RMS integrated 20Hz — 20kHz noise. Note that the maximum preamp noise increase (0.54dB) is in the 20Hz — 1kHz band. With “A” weighting or a 1kHz LFNBW, the line-supplied pre amp noise increase was less than 0.01dB.
An external ±10V supply has another useful feature: while normally used with the battery switch Si off if this is on with the external DC supply, the battery voltages will charge, if needed, tending toward the ±9.2V that is produced with out batteries. This is completely safe, despite the “Do Not Charge” warning on 9V alkaline batteries. I’ve recharged these often over many years, provided that the current and voltage are safely limited, as they are here with regulated ±10V applied. The equilibrium level of 9.2V is safely less than the 9.6V typical of a new “9V” alkaline battery. I haven’t had one battery explode in over 15 years. But I know, “there’s always a first time”—if you’re concerned, keep S1 off when using external power.
POWER SUPPLY REJECTION RATIO
I injected 100mV RMS at 60 and 120Hz into the 10V supplies (using a transformer). With the preamp gain at 1000, and 20Hz — 20kHz NBW, the output ripple from the positive supply was 50.4mV (60Hz) and 13.0mV (120Hz). From the negative supply, the output ripple was 7.3mV (60Hz) and 1.0mV (120Hz). The op amps have excellent PSRR, but not the single-ended JFET input!
The worst-case PSRR (positive sup ply at 60Hz) is thus about 2, or 6dB, re the output with gain of 1000. This agrees with the lowest row in Table 2, where RMS subtracting the 20Hz — 1kHz noise voltages yields 22.6nV RMS input-referred line ripple. Not bad for an AC line powered supply; 22.6nV is 194.5dB below the all-surrounding 120V AC. 194dB is the brightness ratio of two light-bulbs, one at 3” from your eyes, the other one at the distance of the moon!
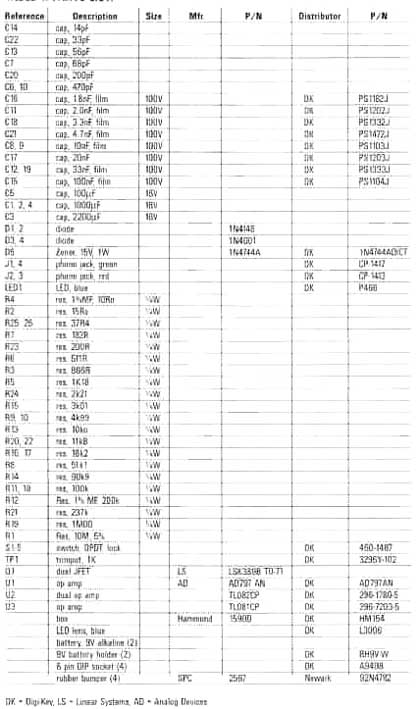
TABLE 4: PARTS LIST.
WHAT’S WRONG WITH CONVENTIONAL NOISE MEASUREMENTS?
Nothing’s wrong with the numbers plot ting noise density (e.g., nV_/Hz) versus frequency. The problem is that such plots don’t express the perceived level and spectrum, because of three factors:
1. Conventional spectrum analysis uses a constant bandwidth; nV/ means the RMS noise in a 1Hz BW. On such a graph, white noise is flat. However, you don’t hear this way, but rather on a log frequency basis; e.g., per octave, ½ octave, and so on. On such a spectrum graph, white noise has a constant upward 3dB/octave slope, and sounds “hissy”.
That’s why pink noise—with its constant power per octave sounding like a steady ocean wave noise—is used. On a constant BW plot, pink noise (sonically misleadingly) has a constant downward 3dB/octave slope.
So, the reasonably “white” spectrum of many audio components (similar to this article’s preamp), fairly flat on a per-Hz basis above 1kHz, has that “hissy” sound, heard mostly in the higher frequencies where the ear is most sensitive at the (you hope) quiet levels of component noise.
2. A linear dB (log voltage) vertical scale would be in accordance with your hearing.
3. The “A” weighting curve (for low-level sounds) further emphasizes (perceptually) the mid-treble range; the “A” curve peaks at 2.5kHz, like your low- level hearing (Fig. 6).
For phono preamp design, the audibility of the amplified cartridge plus preamp input noise is modified by a fourth factor, the RIAA curve. Fortunately, this strongly attenuates the higher frequencies.
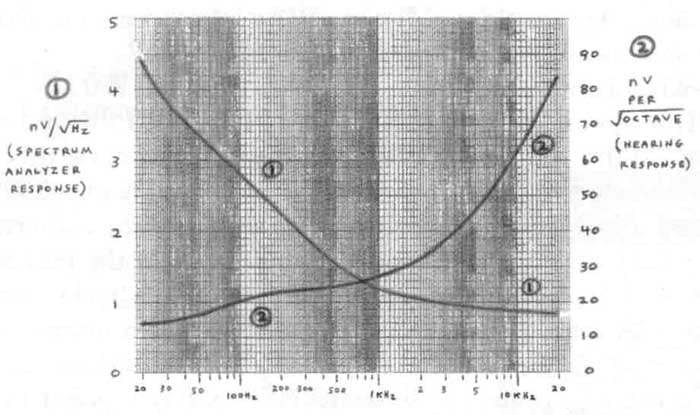
FIGURE 3: Input noise density spectrum. Integrated 20Hz-20kHz 147.7nV RMS
= —136.6dBV. 1—nV’ (spectrum analyzer response), 2—nV per _/ octave (hearing
response).
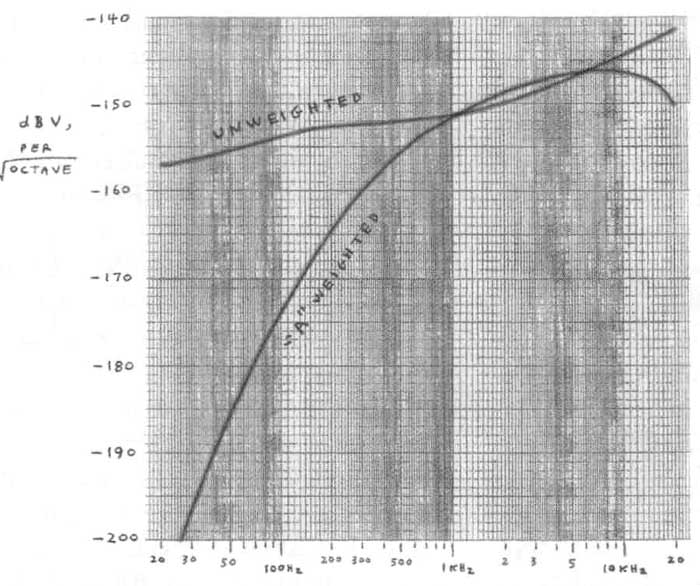
FIGURE 4: Input noise, per-octave basis. Unweighted (1) 20Hz-20kHz = 147.7nV
RMS = -136.6dBV. “A” weighted (2) 20Hz—20kHz = 111.5nV RMS = —139.0dBV Delta
= 2.4dB.
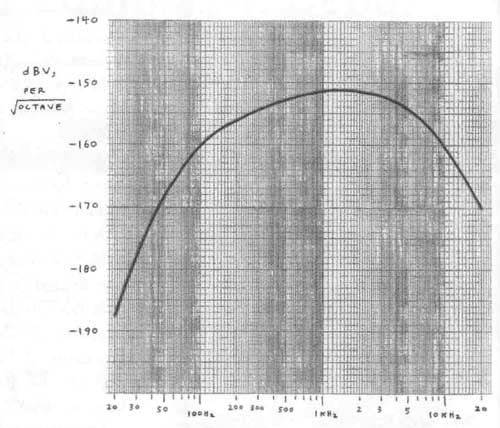
FIGURE 5: Input noise, per-octave basis, with “A” weighting and RIAA curve.
20Hz-20kHz noise = 67.4nV RMS = -143.4dBV delta = -6.8dB re unweighted and
no RIAA curve.
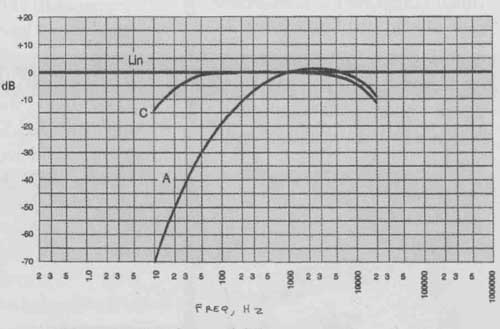
FIGURE 6: “A” and “C” weighting curves.
NOISE SPECTRA OF THIS PREAMP WITH AND WITHOUT THE ABOVE FACTORS
Figure 3 shows the unweighted input noise density spectrum. Curve 1 is conventionally plotted, using nV_/Hz. Curve 2 shows the same data, but with constant per-octave analysis, the way you hear. Above 1kHz the nV_/Hz density is flat within 3.1dB p-p (reasonably “white”); the per-octave curve reflects this as an exponential rise.
The unweighted noise curve in Fig. 4 shows this as an upward slope approaching 3dB/octave from 1-20kHz. But applying “A” weighting (for low- level sounds) with the dB scale of Fig. 4 shows the noise spectrum as you hear it. It broadly peaks around 6kHz. Note that “A” weighting reduces the integrated 20Hz — 20kHz noise level by only 2.4dB, whereas some components might show an 8dB or so reduction.
This has nothing to do with the per- octave analysis; noise power is noise power no matter how it’s (accurately) measured. To see why the reduction here is only 2.4dB involves the following:
1. The “raw” (nV_/hz spectrum in Fig. 3 curve 1 has a strong LF rise below 1kHz. With the log frequency scale, this appears to affect half the spectrum. But 1kHz is only 5% of the 20kHz audio (and noise) BW. That’s why the audio band averaged noise density is only 1.045 nV_/Hz, about the level at 2kHz. The “A” curve mostly attenuates below 1kHz (Fig. 6), again affecting only 5% of the audio band.
2. Notice in Fig. 6 that at the peak frequency f 2.5kHz, the “A” curve is 1.1dB higher than the flat (“Lin”) reference for loud sounds. Apparently, this reflects the ear’s maintaining high sensitivity from 1-5kHz down to the quietest audible SPL. In any case, with noise having strong 1-5khz content (such as white or near-white noise), you can see that the “A” weighting curve doesn’t reduce the overall noise level much.
3. Often, the significant “A” weighting reduction of a component’s “noise” is due to that “noise” containing significant 60/120Hz power line hum (and harmonics). When you’re considering nano-volts of noise per Hz BW, it doesn’t take much discrete-frequency hum to dominate the raw measured noise + hum power. But, of course, the hum, being of low frequency and (you hope) low level compared to the audio signal, is greatly attenuated by the “A” curve (28dB at 60Hz, 17dB at 120Hz) and by your low-level hearing.
THE RIAA CURVE INFLUENCE
Figure 5 shows the preamp’s input noise spectrum when all four appropriate factors are considered: per-octave hearing, linear dB (logarithmic) hearing, the “A” curve, and the downward-sloping RIAA curve. Note that here the noise has a broad peak around 1.5kHz, with strong LF and HF attenuation. Consequently, the perceived noise reduction is 6.8dB with regard to the raw input noise.
Therefore, with a typical near-white input noise distribution above 1kHz, the phono preamp’s output SNR will be about 6.8dB better than the raw input noise level would indicate. Phono pre amp designers, remember that number! (I just built one, the “LP797”; that number is close.)
For non-RIAA components, the SNR improvement is about 2.4dB.
MEASURING PERCEIVED NOISE LEVEL
1. Connect the preamp to the component or circuit under test with, of course, shielded cable. Because the preamp input is DC-coupled, make sure the tested device has no more than ±300mV DC offset. (You can use a series 100NF blocking cap, but this increases preamp LF noise by about 0.4dB.)
2. Connect the preamp’s output to a true RMS AC voltmeter capable of reading down to at least 1mV. (With less sensitive meters you can use a post- amp, provided it’s flat from 20Hz to 40kHz.)
3. Set the preamp’s switches to 20Hz LFNBW, 20kHz HFNBW, and gain to 1000.
4. If the meter reads less than 200mV RMS, you can increase the gain to 10,000 without saturating the preamp’s output.
5. Divide the measured voltage by the pre amp gain; this is the component’s un weighted 20Hz — 20kHz noise output.
6. Switch the “A” weighting on, and set the HFNBW to 100kHz (this makes the response flat to 20kHz before the “A” filter, ensuring accurate “A” response). Divide the measured voltage by the preamp gain; this is the component’s “A” weighted noise. The ratio of the component’s maximum undistorted signal output to this noise in dB (20 times the log of this ratio) is the “A” weighted dynamic range. Using the component’s nominal signal output (e.g., 1V RMS, 0.775V RMS, and so on) results in the “A’ weighted SNR.
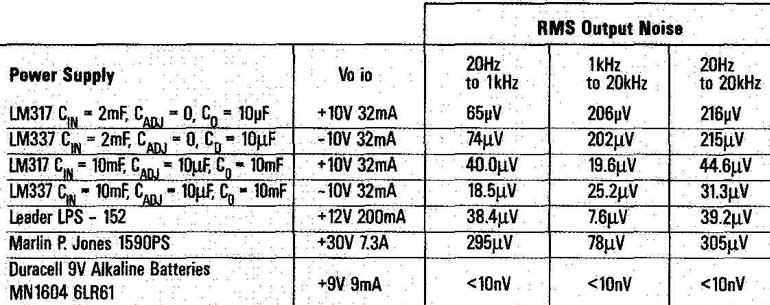
TABLE 5: MEASUREMENT POWER SUPPLY NOISE.
VERY LOW NOISE MEASUREMENTS
With any component having at least 20dB gain, its amplified input noise will override this preamp’s input noise, so that the preamp won’t significantly contaminate the measurement. The pre-amp’s 20Hz — 20kHz integrated noise is 147.7nV RMS on the proto unit, but it’s subject to the LSK389B noise. The datasheet says 0.9nV_/Hz typical, 2.5 maximum. I recommend using a DIP socket for Q1 so you can screen several JFETs for lowest noise.
In any case, noise levels below the preamp’s own noise can be calculated by RMS subtraction:
1. Measure the preamp output noise while connected to the component under test.
2. Connect a shielded and shorted RCA plug to the preamp input, and again measure its output noise.
3. RMS subtract the two readings. For example, suppose the output with the component is 1.935mV and with the input grounded it’s 1.477mV (the proto unit with gain of 10,000).
Then square the 1.935, subtract 1.477 squared, and take the square root of the result: 1.250mV. Dividing this corrected output by the gain of 10,000 (used in this example) gives the component’s noise, 125nV RMS, corrected for the preamp’s own noise.
POWER SUPPLY NOISE MEASUREMENTS
Table 5 shows the noise of several DC power supplies, using the 100nF blocking cap cable. Noise from 20kHz — 100kHz (not shown) was much lower than audio band noise, except for the Marlin P. Jones unit (a 30V, 20A switching supply); switching at 100kHz, the 20kHz - 100kHz noise is 670 RMS.
The noise of the 9V alkaline battery was unmeasurable (with this preamp); it was no greater than the uncertainty of 10nV RMS.
============
also see: