|
|
The renovation of an H.H. Scott 222C integrated amplifier is truly a labor of love and incorporates up-to-date components.
Stereo 48-watt Integrated Amplifier 20-wpc (RMS); years manuf'd: 1961-1963; cost: $165; 11 tubes: (4) 12AX7, (2) 6U8 or 7199 (Split-load phase inverter), (4) 7189, (1) 5AR4
Note that this project is not a restoration of the Scott 222C, which would take it back to its original condition, because there have been vast improvements in components— especially capacitors—since this 222C was built. I wanted to take advantage of any available improvements. I realize this may be heresy to anyone desiring the “classic sound” of this amplifier. Fortunately, there are still a large number of Scott 222A through 222D units available
My own choice was based on cosmetic condition, because new electronic components are readily available, while high-quality front panels are not (IMAGE 1). Some of the descriptions in this article refer to the 222C and 222D schematics. You should download them from the H.H. Scott web- site because they are not reproduced here.
If you decide to do your own restoration or renovation, you should prevent damage to your front panel by removing it before you start. First remove the eight knobs by loosening their set screws. Next, remove the hex nuts for the controls and switches with a ½" hex wrench. Place masking tape on the surface of the wrench that faces the panel to prevent any scratches.
If you intend to do any further testing, label the various control functions on the aluminum front sub-chassis near the controls and switches. Remove the front panel and wrap it in bubble wrap for protection until you finish all the work. The rear and interior views of the 222C that I purchased are shown in IMAGEs 2 and 3.
PRELIMINARY CHECKOUT
My first step was to test all the tubes with my Eico 667. The four 7189 output tubes were the original Telefunkens. The two 6U8 tubes had no identifying marks left on them. The two 12AX7 preamp tubes were Raytheon Uniline, and the two phono stage tubes were ECC83 types. The 5AR4 rectifier had no markings. All tubes were well within the green range on the Merit meter.
After removing the bottom plate, I noted a few cracked solder joints, and that the 4-ohm tap of the channel A output transformer wasn’t soldered at all. It’s hard to believe the factory checkout would not have caught this error, so it may have been worked on in the past. The tube chart sticker on the bottom was also in error, showing 7591 octal output tubes (used in the Scott 299C and LK-72), indicating that this was not the original bottom plate.
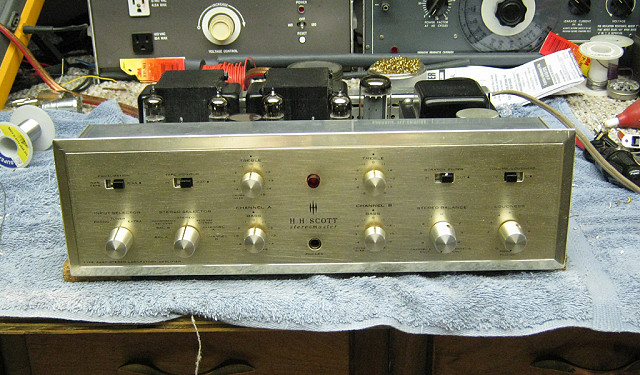
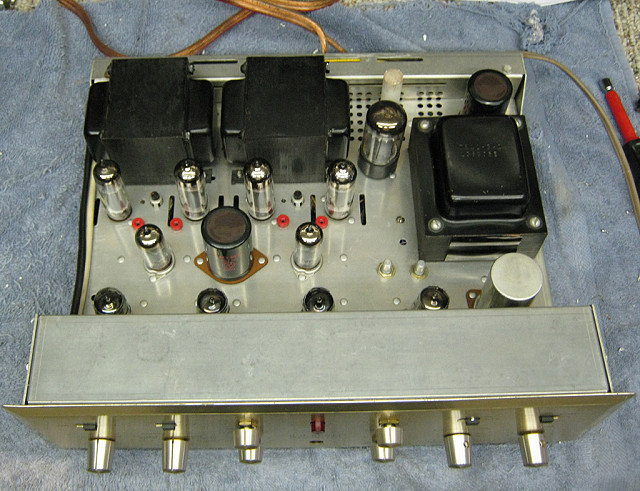
IMAGE 1a, 1b: Front and top-front view of 222C.
The two 150k resistors for the 6U8 pentode screen voltage divider networks had been slowly melting into the wax coating on the 0.25 screen bypass caps. I found the green lead of the 6.3V AC filament winding connected to the pin 3 cathode ground of one of the output tubes. This connection was not shown on my 222C schematic, but it is on the schematic for later Scott units such as the 222D and 299D.
Next, I slowly brought the 222C up to power with a Variac while monitoring the B+ voltage and the —50V DC bias supply. I soon found that the Siemens full-wave selenium rectifier was open. This is a common problem with tube equipment of this vintage.
Not wanting to go any further without output tube grid bias, I replaced the selenium unit with a 6A 200 PIV silicon bridge rectifier. Now the bias supply voltage was just a bit low at —48V DC. The heaters for the four 12AX7 tubes are connected in series with the rectified DC bias supply winding, and they began to glow after I replaced the selenium rectifier.
I used my shock hazard tester to see whether there were any issues with leakage or insulation failures (there weren’t). Next, I measured all the DC supply voltages that were listed on the schematic. I found some of them were quite high.
This can be explained in part by the slightly higher AC mains voltage we have today—120V versus the 117V that is listed on the rear panel. But most of the voltages I measured were much higher than the 2.6% higher mains voltage would produce. I have listed my measured voltages in Table 1.
I was also surprised that the plate and screen voltages listed on the 222C schematic for the 7189 output tubes exceeded the maximums listed in the RC-30 RCA Receiving Tube Manual. From 1939 to 1957 the Radio Manufacturers Association (R used the Design-Center Rating System (DCRS) for receiving tubes that factored in all expected variations in AC line voltage and parts tolerances.
The 7189 maximum Pd of 12W, plate voltage of 400V and screen voltage of 300V, used the DCRS. The Radio Electronics Television Manufacturers Association (RETMA) changed the ratings requirements to the Design-Maximum Ratings System (DMRS) some time in 1957. This specified the maximum tube voltages and currents that were to be used, and did not allow for any expected variations. The equipment design engineers were now expected to calculate and apply all the anticipated variations in line voltage and parts tolerances for their new equipment designs. The schematic for the 222C Rev 0 is dated 19 July 1961, so it would have come under the DMRS.
After 1957, many tube manufacturers added an “A” suffix to existing tube designs, and published higher maximum ratings that conformed to DMRS. According to the Sylvania Receiving Tubes Technical Manual 14 Edition (reprinted by Audio Amateur Press), the ratings for the 7189A are 13.2 Pd, 440V plate and 400V screen. Even allowing for higher DMRS maximums, it appears to me that some of the 1960s equipment manufacturers pushed the tube ratings quite hard. Perhaps there was the audio equivalent of the 1960s automotive horsepower race going on in the auto industry. Recall that in 1982 the Federal Trade Commission (FTC) imposed the continuous audio power rating system on a hi-fi industry that had contrived purely fictitious market-driven ratings such as “peak music power.”
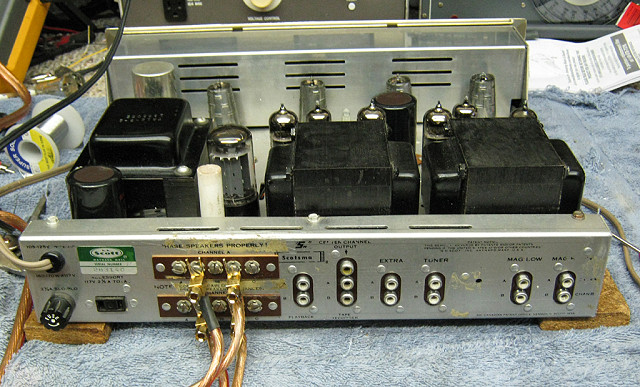
IMAGE 2: Rear view of 222C.
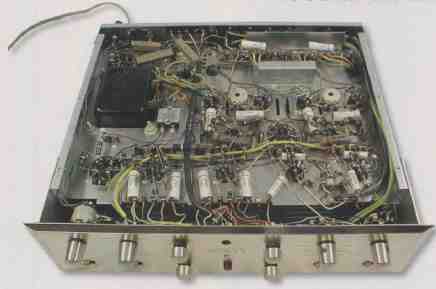
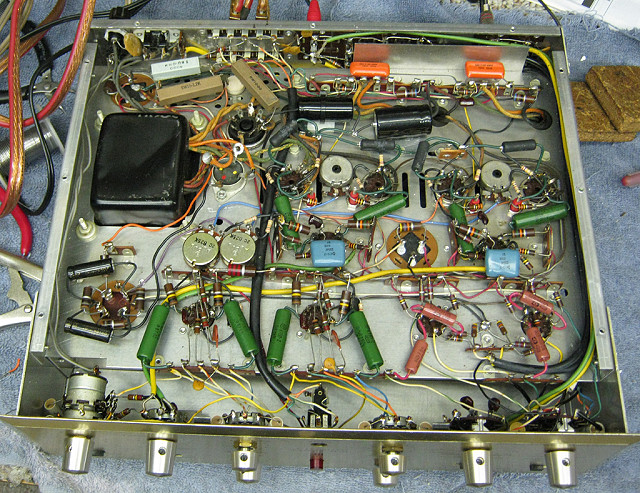
IMAGE 3a, 3b: Interior views of 222C.
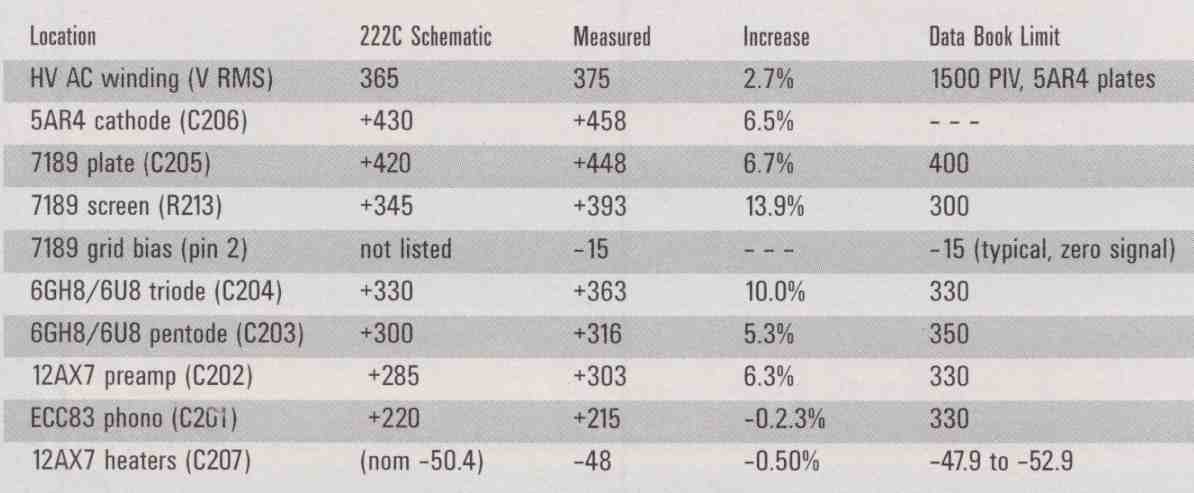
TABLE 1: DC VOLTAGE MEASUREMENTS VS. SCHEMATIC (SCOTT 222C).
A computational analysis of the current draw for each stage using the resistances and voltages listed on the 222C schematic defies Ohm’s Law and makes no sense. Even allowing for a low 5,00011/volt shunt impedance for the vintage mechanical volt meters of the time, the voltages just don’t compute.
The B channel 6U8 amplifier/phase inverter tube had plate voltages well below that indicated on the schematic, even al lowing for the specified ±15% tolerance. Swapping the two tubes from side to side caused the problem to follow the tube. A replacement RCA 6U8A brought the voltages at both tubes in line with each other (so much for that 6U8 in-the-green tube tester reading). A check with an oscilloscope showed the three can-type quad filter capacitors were pretty well shot, al lowing noticeable power line hum.
IMAGE 4 shows the AC ripple voltage at the plate and screen grid supplies (10V/cm) with no input signal. I needed to build a 1M-ohm discrete resistive 10:1 attenuator for my oscilloscope because a conventional 10:1 scope probe such as the Tektronix P6006 or HP-9060 is limited to 300V peak. The 7189 plate supply ripple was 13Vpp, the screen voltage ripple was 11.6Vpp, and the 6U8 triode supply ripple (not shown) was 1.2Vpp. Further along the series RC path, the supply voltage ripple was less than 0.3Vpp.
So far, so good—no smoke, flames, or other major problems. I pulled the two 6U8 tubes and set the DC balance pots in accordance with the 222C Operating Manual. While the channel A adjustment was reasonably near the center of its pot, I could not achieve a null on channel B even with the pot at its extreme rotation.
INITIAL LISTENING TEST
I connected the 222C into my stereo system and set the balance and tone controls to neutral. I connected my NHT Super-One satellites (nominal 8-ohm) to the 8-ohm taps. Then I connected the 222C center channel output (this is a resistor—summer derived from the output transformer 16-ohm taps) to my subwoofer amplifier and hoped for the best. Fortunately, the sub amplifier has its own volume control, because the center channel output signal level was way too high, and 60-cycle hum drowned out any bass. Similarly, the phono stage hum also made it unusable.
I connected my CD player to the Extra input, and disconnected the center channel from the sub.
There was a noticeable hum with my ear to the speakers (higher in the right channel), independent of the loudness control set ting, but it wasn’t excessive from my listening position. The SuperOnes are reasonably flat down to 57Hz, so I don’t yet under stand why they wouldn’t show the same excess hum that the subwoofer produced. I started a CD playing and left the room to allow the 222C to fully warm up.
After half an hour, I returned to do some serious listening. I could get all the volume I needed with the loudness (volume) control at 1 o’clock.
The treble was edgy and slightly exaggerated, and the bass was flabby and rolled off. The soundstage and imaging were quite good, but otherwise I wasn’t all that impressed. When I moved the speakers to the 4-ohm taps, there was a noticeable loss of treble and midrange detail, but the bass response was a bit tighter.
Except for the hum problem, I would place the sound on a par with many modern solid-state mid-fl consumer receivers—certainly not in the same league as the better tube amplifiers I have auditioned, such as the Manley Stingray, the Audio Electronic Supply AE-25, or Assemblage ST-40. But, for an amplifier of its age, de signed and built more than 40 years ago, it acquitted itself reasonably well. I intend to see whether I can make it much better.
MEASUREMENTS—ORIGINAL UNIT
Because I was still undecided as to whether to remove the 5AR4 and replace it with silicon diodes (they were used in the Fisher equipment of that era), I settled on a test to measure how long the amplifier tubes would be exposed to cathode stripping during heater warm-up. Figure 1 shows that it takes over 8 seconds after power- on for the 5AR4 to begin producing high voltage, and almost 14 seconds before there is any audio output. Based on this, I decided to retain the 5AR4. To illustrate just how limited the reservoir cap energy storage was, upon shutdown the B+ voltage dropped to 75V in 20ms and was down to zero in less than one second.
Figure 2 shows the amplifier AC line inrush current, which I recorded with a 100:1 ratio current transformer. The CT secondary burden consisted of a 1-ohm resistor whose output was processed by a precision full-wave rectifier op-amp circuit. This results in both the positive and negative AC half-cycles appearing as positive voltages, making it easier to trigger the scope so it wouldn’t miss the first half-cycle. The scaling factor is 10m V/amp.
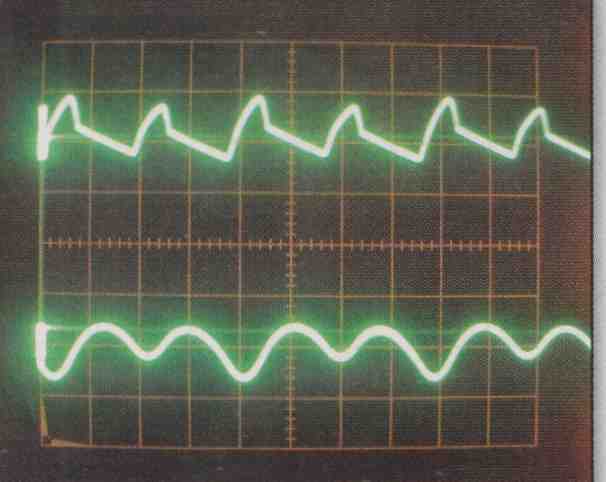
IMAGE 4: AC ripple voltage at the plate and screen grid.
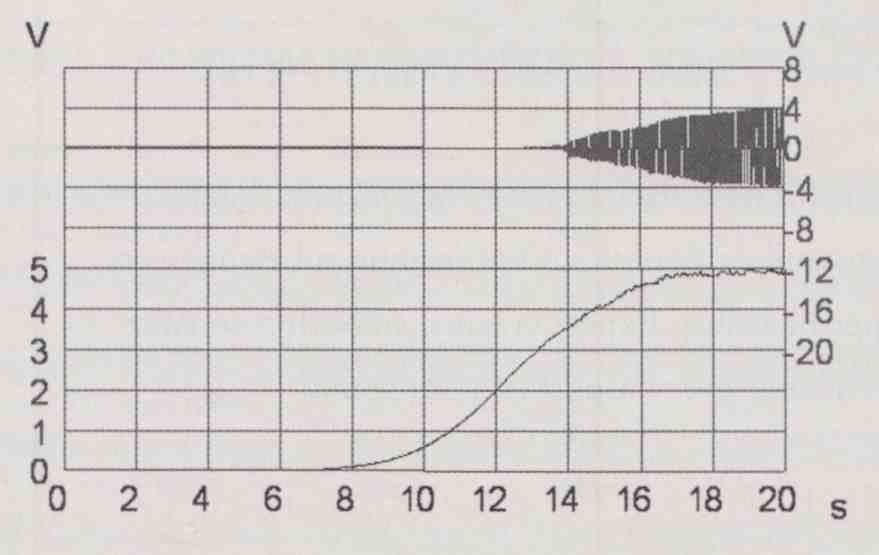
FIGURE 1: Initial B+ warm-up and audio output.
The initial magnetizing inrush (first half-cycle) reached 3.22A. The inrush magnetizing current has a high 3rd harmonic content and will vary depending on the exact point on the line voltage sine wave at which the voltage is applied to the transformer. The next half-cycle jumped to 7.5A peak as the low resistance of the cold tube heaters was referred to the transformer primary It must be reducing the life of the heaters while subjecting the power switch to higher than rated current.
The 4th and 6th peaks are 4.42A and 3.26A. In between are lower peaks, showing the offset current that occurs while the AC line current “erases” the minor hysteresis loop that the transformer iron operates in due to the initial offset current. I switched the scope to a longer time base (not shown) and found it took about 3 seconds for the peak current to settle down to just under 1.5A.
I operated the Scott 222C at 5W/channel into 80 for 1 hour with a 1kHz signal into the Extra inputs. Distortion settled down to 0.46% after 45 minutes as shown in Fig. 3. Note that I measured with the loudness, balance, and tone controls at 12 o’clock and an 80 load, unless otherwise noted. Due to the apparent problem noted during the initial checkout in Channel B (right), only Channel A (left) test data is presented here. All the test data is summarized in Table 2.
The output at the speakers using both the line inputs (Tuner and Extra) and the phono inputs preserve normal polarity. The Tuner, Extra, and Tape Playback input impedances measured 875k Channel A and 882k Channel B. The non-selected line input jacks are shorted to ground. A ground is placed at the grid of the second section of the phono preamp tubes when Mag Hi or Mag Low are not selected.
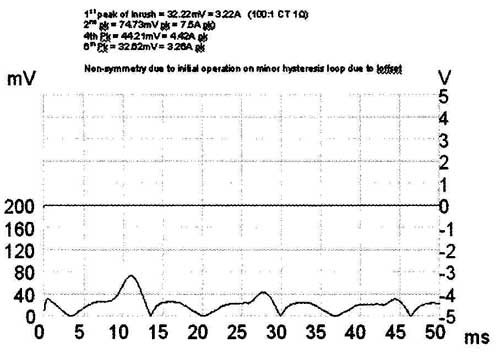
FIGURE 2: AC line inrush current.
The Tape Recorder outputs for both channels are connected directly to the selected line input. The phono Mag Low input impedances were 48k1 (A) and 49k6 (B). There is no discrete shunting capacitance, so any input capacitance is supplied by the shielded cable, and the grid-cathode and Miller-effect grid-plate capacitances. The Mag 1 High input impedances were 158k (A) and 160k (B), reflecting the added nominal 100k series resistors. The phono stage output impedances measured at the Tape Recorder output jacks were 13k9 (A) and 14k1 (B) at 1kHz.
PHONO STAGE
I made the phono stage measurements using the Mag 1 Low inputs. The Tape Recorder line output load for all tests was 100k (Scott recommended 200k). This is the input impedance of my distortion test set, and points out one of the problems in testing vintage equipment—the test equipment can load down the high impedance audio circuits. The distortion for both phono channels was extremely high due to the presence of 60Hz hum.
The RIAA specification requires that phono preamp THD+N remain below 1% with an input of 50mV at 1kHz. For the same reason, I could not measure the cross talk performance from 100Hz to 20kHz. A spectrum of the hum and noise from the Mag Low input is shown in Fig. 4. The 60Hz component is -26dB (5%).
Accordingly, I limited my phono measurements to frequency response with a test signal level into my inverse RIAA net work that produces 10mV at 1kHz at the Mag Low input jack. This is equivalent to a cartridge with an output of 10mV at 5cm/sec recording velocity (2mV/cm/sec sensitivity). Typical vinyl records are recorded at 5cm/sec maximum, while the RIAA specification allows a maximum recording velocity of 25cm/sec (50mV at 1kHz). Gain at 1kHz, 10mV input was 32dB, which is well below the usual 40dB.
Figure 5 shows the RIAA equalization error relative to 32dB (solid line), with 1kHz the 0dB point. The RIAA accuracy varied -4.9dB to +1.7dB from 10Hz to 20kHz. It actually follows quite closely the IEC 9/76 LF rolloff curve shown in the curved dotted line. The two channels varied from each other by a maximum of 0.8dB at various points on the curve (not shown). The RIAA and NAB resistor and capacitor equalization networks reside in flat encapsulated ceramic hybrid circuit assemblies.
The input overload for visible output clipping was reasonably generous at the lower frequencies: 17.7mV at 20Hz and 65mV at 1kHz. The RIEAA requirements at these two frequencies are 5.42mV and 50mV, respectively. The overload capability fell short of the RIAA-required 477.SmV at 20kHz, allowing only 177mV before hitting 1% THD.
LINE INPUT AND POWER AMPLIFIER SECTIONS
The 222C produced 2V RMS (0.5W) output into 80 at the 80 tap with a 0.5V RMS 1kHz sine wave into the Extra input jacks, at a loudness control setting of approximately 1 o’clock. Unity gain at the same load condition occurred at a loudness control setting of approximately 11 o’clock. Loudness control tracking between the two channels with a 0.5V input signal was within 0.1dB to 4W output, where it diverged to 0.8dB at 10W. There was an audible discontinuity near the maximum CW (clockwise) rotation on the right channel, and the volume jumped quite high when the loudness control was turned fully CCW (counterclockwise).
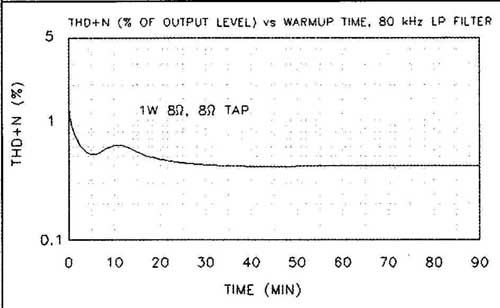
FIGURE 3: THD vs. warmup time.
The frequency response from the 222C Extra Input to the top of the loudness control is shown in Fig. 6 with the tone controls set as flat as possible. For reasons that I’ll explain later, I also show a SPICE-generated frequency response for the Scott 222D preamp, which has a different high- pass filter circuit on the front end.
The range of response modification by the tone controls is shown in Fig. 7. Note the effect of the preamp input high-pass filter at the low frequency end of the bass control boost range. The scratch filter produced —1dB treble cut at 5kHz and —7dB at 20kHz as shown by the dash-dot line with the tone controls Set as flat as possible (the “flat” curve)
The effect of the loudness contour (with the tone controls again flat and the loudness control at 9 o’clock) is shown with a dashed line. The loudness contour is designed to operate at low volume levels where the ear is less sensitive to the upper and lower frequencies in the audio band. The loudness contour boosts the audio levels at those frequencies as the loudness (volume) control is turned down. The loudness contour tap in the 222C is at 18k5 above the low end of the 500k loudness control. When the loudness control is turned up, the loudness Contour has little or no effect because the loudness control wiper is far away from the contour tap.
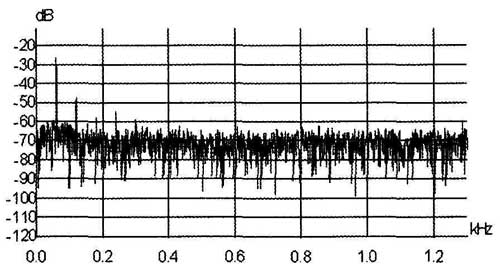
FIGURE 4: Spectrum of hum and noise, phono in to tape rec out.
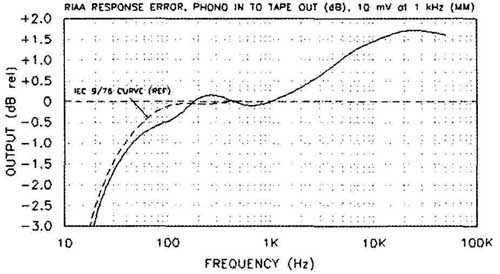
FIGURE 5: RIAA equalization response error.
Figure 8 shows the THD+N vs. frequency for the preamp section of the 222C from the Extra input to the top of the loudness control. I engaged the test set 80k1-Iz low-pass filter to limit the out-of- band noise. The solid line is with the bass and treble controls set flat. The dashed lines are with the bass and then the treble control set to maximum.
Notice the steep drop at 60Hz and the smaller drop at 120Hz where the distortion test set notch filter has removed the AC line hum components from the distortion residual. THD+N at the 60Hz notch is only 0.12%. Clearly, there is much room for improvement in the power supply.
At full-volume, the amplifier is sup posed to reach rated power at less than 1.5% distortion with a 0.5V RMS line input. Even using a relaxed 3% THD criterion, the 222C fails to reach rated power above 10kHz with an 81 load (Fig. 9).
The problem appears to be with the power amplifier section, because there is a fair amount of headroom in the preamp (top curve). I measured the preamp THD-FN at the top of loudness control, so it includes the input HP filter and the tone controls, which were set flat. Above 3% THD there was a noticeable scoop-out at the peak of the preamp sine wave.
The overall 222C frequency response from the Extra input to the 8-ohm tap at 1W is shown in Fig. 10, with the tone controls set as flat as possible. I also plotted the response for 4-ohm and 8-ohm loads on the 4-ohm and 8-ohm taps. A resistive load of 4-ohm on the 4-ohm tap showed particularly poor response, with the —3dB points at 1.2kHz and 13kHz with dips and peaks along the way. otherwise, the 222C met the specified response.
There is a slight lift in response between 2kHz and 10kHz with an 8-ohm load on the 8-ohm tap. From this response data, I calculated the output impedance of the 4-ohm tap of the 222C to be 1.95-ohm at 20Hz, 0.85-ohm at 1kHz, and 1.08-ohm at 20kHz. The output impedance of the 8-ohm tap is 2.10-ohm at 20Hz, 1.37-ohm at 1kHz, and 1.67-ohm at 20kHz.
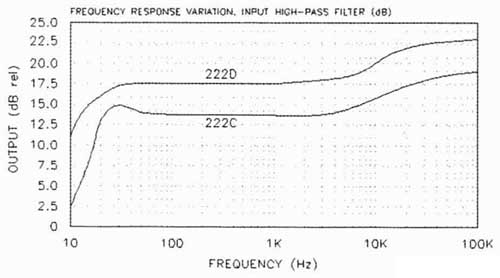
FIGURE 6: Extra input frequency response
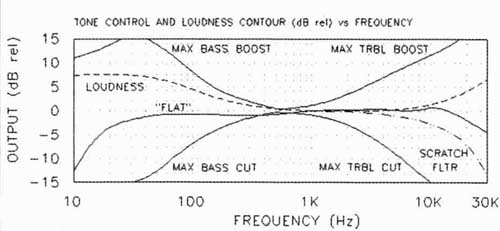
FIGURE 7: Tone control modifications to frequency response.
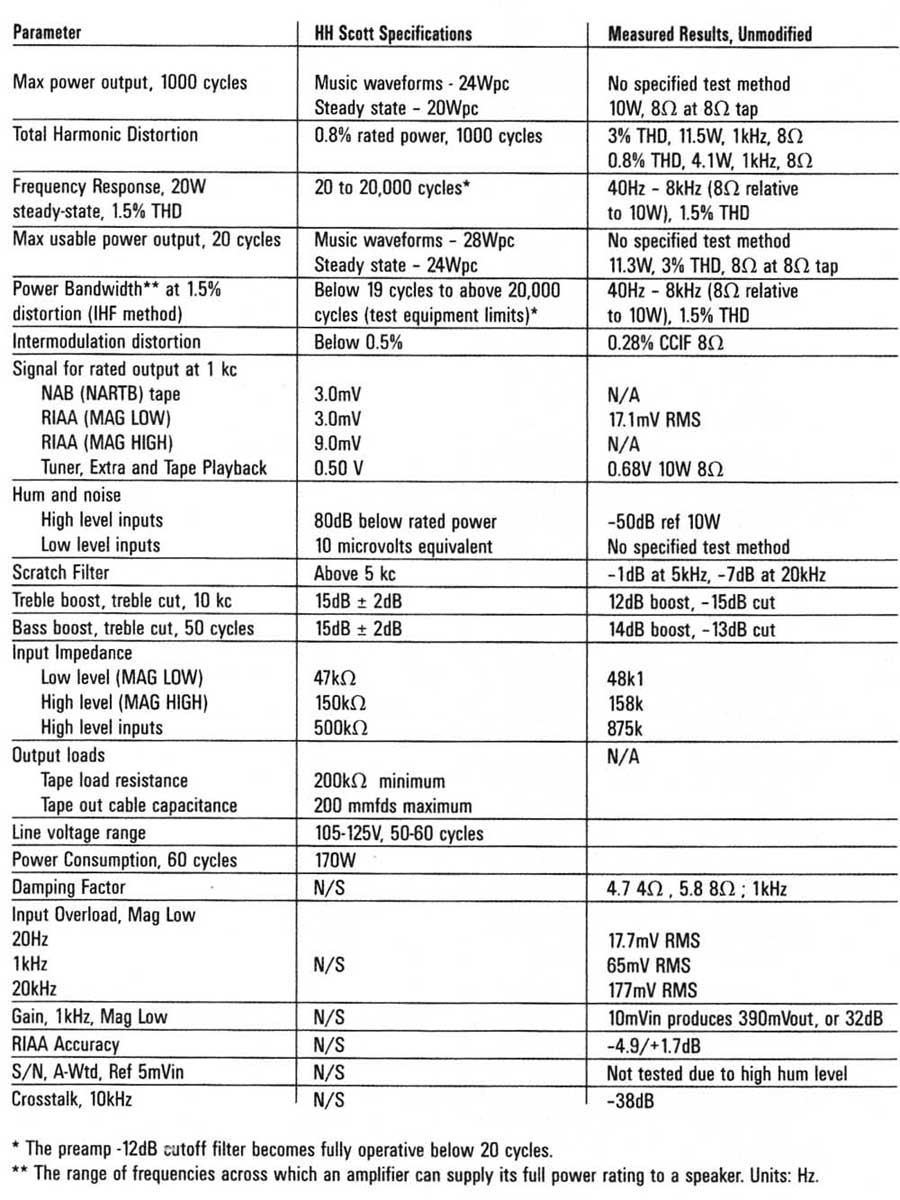
TABLE 2 MEASURED PERFORMANCE (CHANNEL A, ORIGINAL 222C): HH Scott Specifications;
Measured Results, Unmodified
The response into the speaker load showed the amplifier to be particularly sensitive to the speaker impedance changes with frequency. Damping factor is less than 10 across the entire audio band. Below 30Hz you can readily see the effect of the sharp cutoff (-12dB) high-pass preamp input filter used in the 222C. There was no noticeable problem driving a complex load of 8-ohm paralleled with a 2p.F cap (8-ohm tap). It followed the 8-ohm resistive load at the 8-ohm tap curve through 18kHz, beyond which the response was slightly extended (dash-dot line).
Dennis Colin made a good suggestion to perform THD testing with a loudspeaker As part of my measurements, I connected one of my NHT SuperOne satellites to the Channel A speaker terminal through 6’ of 12-gage Monster speaker cable. The impedance (solid line) and phase (dashed line) of the SuperOne vs. frequency is shown in Fig. 11.
The overall THD+N vs. frequency into various load/tap combinations is shown in Fig. 12. The distortion reaches its 0.2% minimum at the frequency that coincides with the maximum impedance of the loud speaker load. The dips in distortion at 60Hz, where the distortion test set notch filter removes the contribution caused by power line hum, is less pronounced than with the preamp alone in Fig. 8.
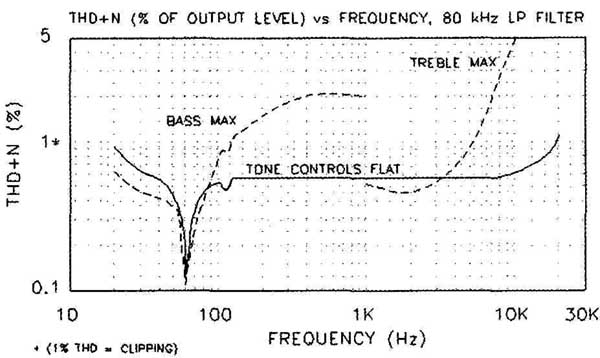
FIGURE 8: Extra input/preamp THD+N vs. frequency
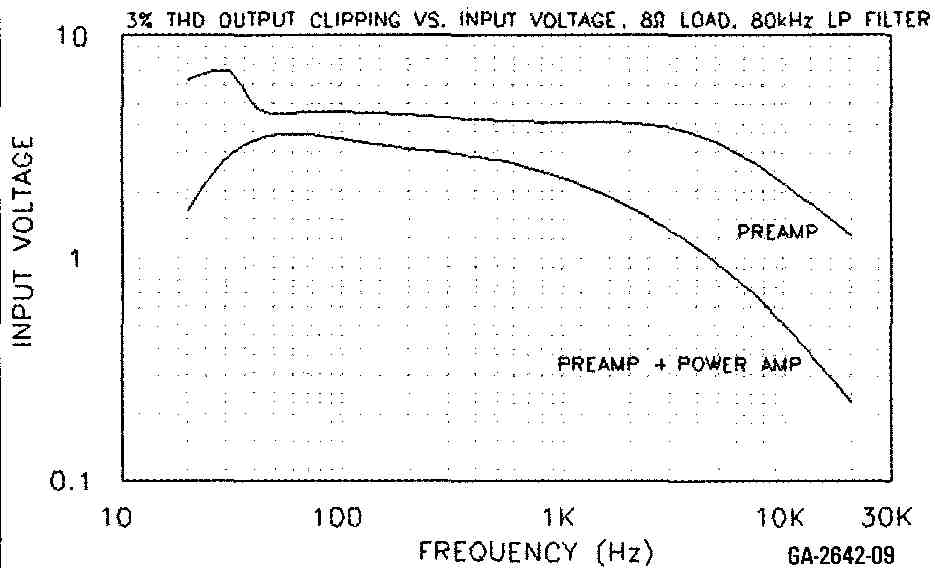
FIGURE 9: Output clipping vs. extra input voltage.
Figure 13 shows THD+N vs. output power at 1kHz into various load/tap combinations, with the test set 80kHz low-pass filter engaged. The maximum specified 1.5% distortion occurs well below the specified maximum rated power. Even relaxing the clipping point to 3% THD did not produce rated load.
Using a 1kHz signal driving both channels, Channel A 3% THD clipping occurred at 12.8W into 4-ohm, 4-ohm tap and 11.5W into 8-ohm, 8-ohm tap. The clipping was asymmetrical with the negative half-cycles clipping first. The maximum output voltage into the loudspeaker load was 11.8V RMS. As you can see in Fig. 11, the actual speaker impedance at 1kHz is just over 16-ohm with very little phase shift.
The power available at 20Hz and 3% THD+N (8-ohm, 8-ohm tap) was 11.3W. At 20kHz I measured just 5W into 8-ohm at 3% THD+N. After these tests, the power transformer and output transformers were fairly warm. My test bench 60Hz mains voltage was 120V AC.
Output hum and noise with the Extra input shorted and the loudness control at maximum was 16mV RMS of 60Hz hum. There were 640mV RMS of output hum with the Mag Lo phono input selected, and it didn’t decrease with the Mag Low input shorted.
Channel crosstalk (Table 3) measured —51dB at 1kHz and -38dB at 20kHz at the left output with the right input terminated with 600D. It was even worse from L-R, with only —21dB at 20kHz. Because no tubes except the rectifier are shared between the two channels, I assume the crosstalk occurs through the power supply and by capacitive coupling in the wiring, switches, and controls.
The distortion residual for 10W into 8-ohm at 1khz is shown in Fig. 14, where distortion reads about 1.5%. The upper wave form is the amplifier output signal, and the lower waveform is the monitor output (after the THD test set notch filter), not to scale. This distortion residual signal shows a series of low order harmonics and some asymmetry. Figure 15, the distortion residual with the NHT speaker load, shows a bit smoother residual waveform, but with a more pronounced asymmetry. The opposite-going peaks at the zero crossings may be the speaker back-emf across the relatively high amplifier output impedance.
The spectrum of a 50Hz sine wave at 1W into 8-ohm is shown in Fig. 16, from zero to 1.3kHz. The THD+N measured 0.73%, with the 2nd, 3rd, 4th, 5th, and 6th measuring -43dB, -60dB, -77dB, -76dB, and -78dB, respectively.
The calculated THD based on these harmonics is 0.72%. There are several significant artifacts of the power line at 60Hz (-54dB), 120Hz (-63dB), and at 180Hz and 240Hz below the -70dB line.
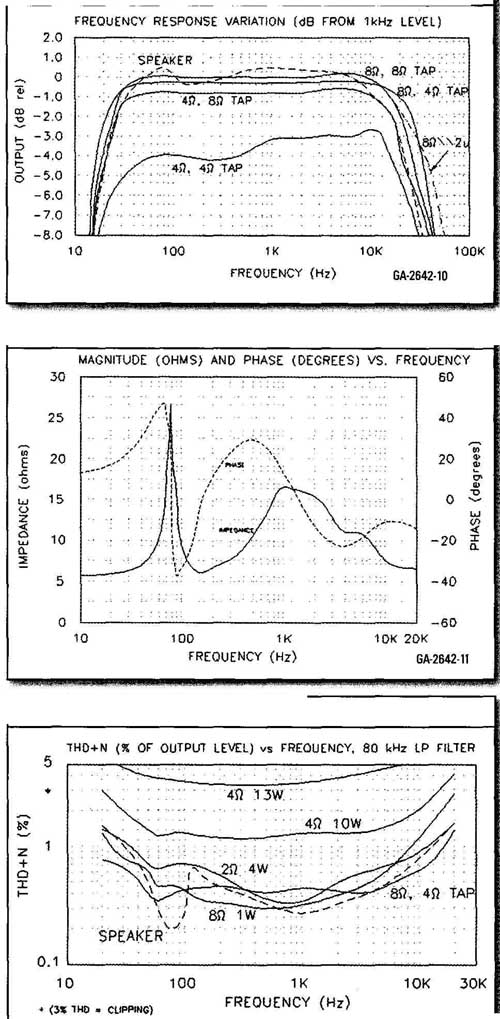
FIGURE 10: Overall 222C frequency response. FIGURE 11: NHT SuperOne impedance
and phase. FIGURE 12: THD vs. frequency.
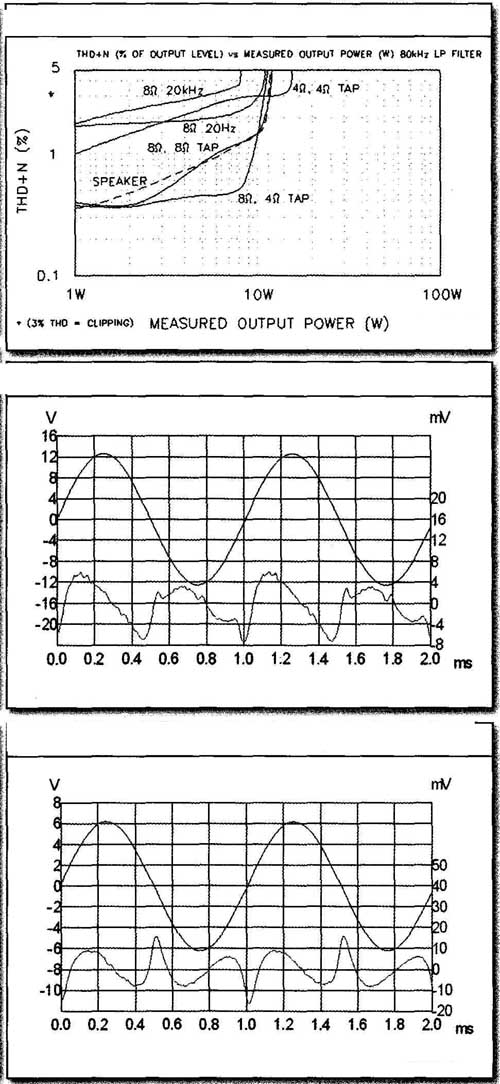
FIGURE 13: THD+N vs. output power. FIGURE 14: Residual distortion, 10W 8-ohm
load. FIGURE 15: Residual distortion, loudspeaker load.
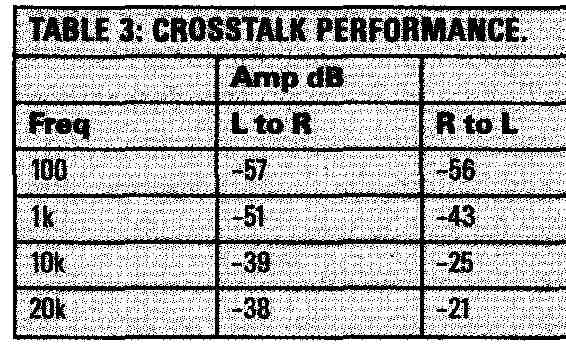
TABLE 3: CROSSTALK PERFORMANCE
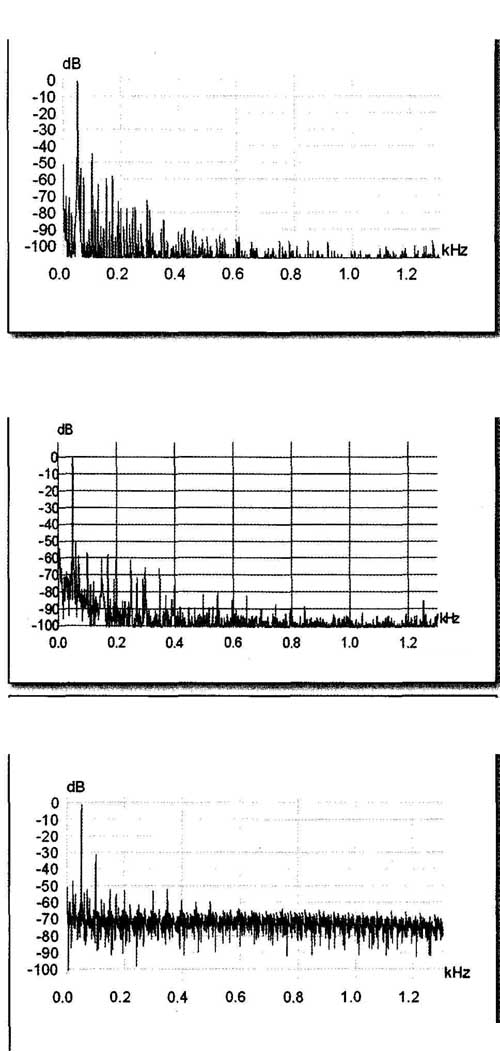
FIGURE 16: Spectrum of 50Hz 1W sine wave, 8-ohm load. FIGURE 17: Spectrum of
50Hz 4V sine wave, speaker load. FIGURE 18: Spectrum of 50Hz 10W sine wave,
8-ohm load.
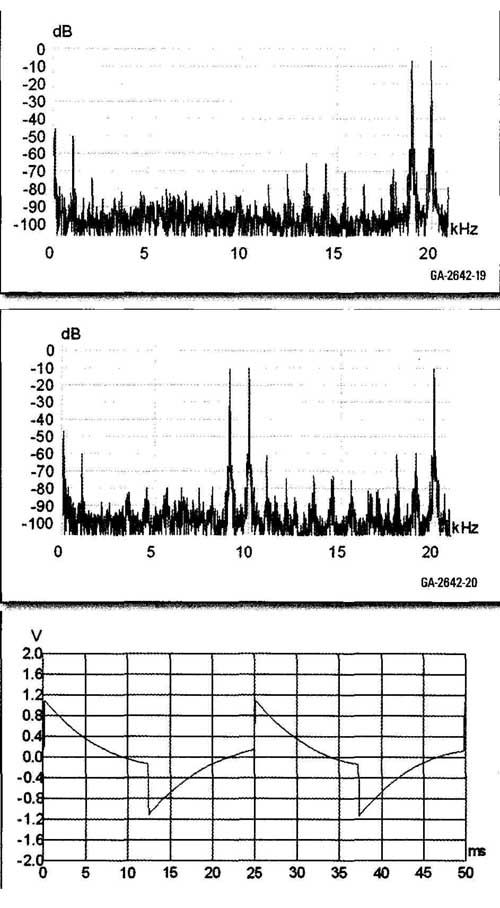
FIGURE 19: Spectrum of 19kHz + 20kHz intermodulation signal. FIGURE 20: Spectrum
of 9kHz +10.05kHz + 20kHz intermodulation signal. FIGURE 21: 40Hz square
wave response, 8-ohm.
More troublesome is the presence of significant intermodulation products between the 50Hz test signal and the 60Hz power line. These are spaced every 10Hz through Out the spectrum, and have a noticeable real-time interaction at 300Hz, which is the 5th harmonic of the power line and the 6th harmonic of the 50Hz test signal. Repeating the spectrum into the loudspeaker load (Fig. 17) shows similar results, but with a rise in the noise floor below 200Hz. The speaker impedance at 50Hz is just about 8-ohm, with a phase shift of +40 Increasing the output power to low (Fig. 18) raises the entire noise floor to about —70dB, where the THD+N measures 7.2%. The second harmonic is a high —32dB (2.5%).
Figure 19 shows the 222C’s output spectrum reproducing a 12Vp-p combined 19kHz + 20kHz CCIF intermodulation distortion (IMD) signal into 8 The 1kHz IMD product is 0.28% and the 18kHz product is 0.035%. There are also lots of interposing products in between. Repeating the test with a multi-tone IMD signal (9kHz + 10.05kHz + 20kHz, Fig. 20) produced a picket fence of IM products with four odd and even order products of -60dB (0.1%).
The 2.5Vp-p square wave into 812 at 40Hz showed a significant amount of tilt and leading phase shift (Fig. 21) as a result of the steep HP filter in the preamp section. The 1kHz square wave (Fig. 22) is fairly well behaved with a slight peak at the leading edge, possibly coinciding with the slight rise in frequency response between 5kHz and 10kHz in Fig. 10.
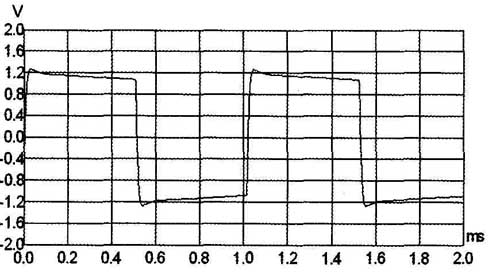
FIGURE 22: 1kHz square wave response, 8-ohm.
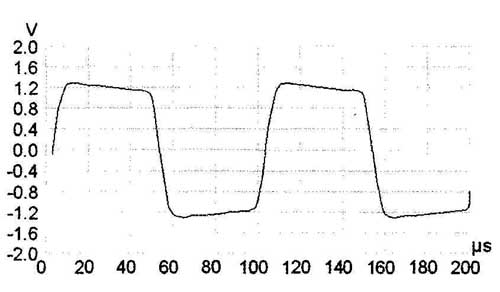
FIGURE 23: 10kHz square wave response, 8-ohm
The rounded square wave response and phase shift at 10kHz into 8-ohm in Fig. 23 substantiates the high-frequency rolloff characteristic shown in Fig. 10. The same square wave signal into an IHF speaker load (Fig. 24) shows a bit less peaking at the leading edges. I used the IHF load because I didn’t want to expose the NHT tweeter to the high energy content of the square wave high-frequency harmonics.
Adding 4-ohm in parallel with the 8-ohm load produced the 10kHz response shown in Fig. 25. The leading edge is peaked and there is some scoop-out in the center. Looking at these last three square wave responses with the spectrum analyzer (not shown) indicated that the only difference was in the magnitude of the 2nd and 4th harmonics (20kHz and 40kHz). The IHF load had the lowest (—50 and —48dB), followed by the 8-ohm load (-45 and —46dB), then the 8-ohm paralleled with 2uF (—30 and —37dB), respectively.
Say goodbye to the original unit. Next (part 2) I’ll begin removing and replacing parts, components, and wiring.
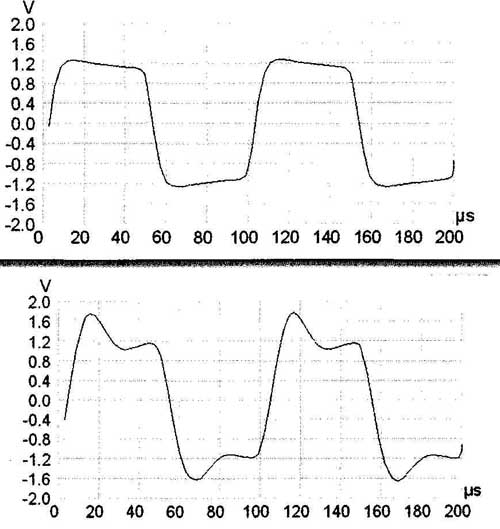
FIGURE 24: 10kHz square wave response, IHF load; FIGURE 25: 10kHz square wave
response. 8-ohm/2uF
REFERENCES
1. “Scott 222 and LK48 Amps. Sweet Sounds for a Song,” Charles Kittleson, Vacuum Tube Valley, Issue 13.
2. In 1924, the Associated Radio Manufacturers (ARM) was formed, and was renamed Radio Manufacturers Association (RMA) in the same year. In 1950, RIVIA became Radio Television Manufacturers Association (RTMA), and in 1953 was renamed Radio Electronics Television Manufacturers Association (RETMA). And in 1957, RETMA became the Electronic Industries Association (EIA). Electronic Industries Association was changed in 1997 to Electronic Industries Alliance.
3. "Cathode Stripping,” Eric Barbour letter, audioXpress , p. Feb/05.
4. “The case for more testing,” Dennis Colin letter, Stereophile, June 2004, p. 11.