Every receiver requires that the tuned circuits be correctly adjusted for its optimum operation. Since it is always possible for a resonant circuit to be thrown off its proper resonance by a number of factors, either an inductive or a capacitive component is made variable, so that the proper resonant point can be maintained. The process by which the circuits are adjusted to the proper resonant state is called alignment.
Alignment is the most important factor in the servicing of receivers, because a receiver will function perfectly only when it is correctly aligned. The knowledge of alignment for receivers dates back to the time of t-r-f- sets. However, as the years advanced, especially with the coming of the superheterodyne receiver, the alignment procedure became more involved and also more necessary. So far as a-m super heterodyne receivers are concerned, the methods of alignment are fairly standard with a few variations existing. The a-m superheterodyne receiver is quite old - about 25 years -- and in the course of time a number of changes and improvements have been made, which of course warranted different alignment methods. At present the a-m superheterodynes are more or less standard in design and, therefore, the alignment method is somewhat standardized.
With FM the situation is very different. Frequency-modulation receivers have been on the market only about eight years, and remarkable advances have been made during this time. That there exist at least three different types of FM detector circuits in commercial FM receivers is only one factor in the continual progress of FM design. As is natural in all systems, other factors, such as alignment, have to keep in step with the new improvements. This means constantly changing methods of alignment, although each essentially produces the same result, namely the proper functioning of the receiver.
In this Section we will discuss the two basic methods of FM receiver alignment which are being used today, namely, the meter and visual methods. Before we analyze them, let us review our basic knowledge of general alignment theory.
Facts About Alignment
In a-m receivers the method of alignment most universally used is the meter method. An output meter is placed across the speaker voice coil or from the plate of the output tube to B- or ground, and a modulated signal is fed to the receiver. Each of the i-f stages is first aligned to give maximum output on the meter. Afterward, the oscillator and r-f stages are also aligned for maximum meter output.
Throughout the alignment the meter remains in the same position, and in this manner the alignment procedure is facilitated. Where no meter was available, alignment of a-m sets has been made by ear, depending only upon the maximum output of the speaker. In aligning the i.f.'s the signal generator is connected to the signal grid of the converter or mixer tube, and its frequency setting is held throughout at the i.f.
The r-f and oscillator alignments are somewhat different in that the signal generator is loosely coupled to the input of the set. This coupling may be made either through a low valued capacitor and then directly to the external antenna lead, or it may be inductively coupled by putting a few turns of wire connected to the generator output around the antenna coil or loop, whichever is used. In all of the stages, alignment is made by varying either the capacitance or inductance of the tuned circuit in question.
From this brief analysis of the usual a-m alignment procedure, we see that we are primarily concerned with the use of two instruments, namely the signal generator and the output meter. Once the meter is placed in position, all that is done is to place the signal generator in different positions in conformity with the usual procedure. Most manufacturers' service data specify the i-f, oscillator, and r-f settings of the generator for this type of alignment. However, certain facts considered accepted practice in alignment are usually so well known that they are very seldom mentioned For instance, in a-m alignment the volume control is usually set at the maximum volume position and the signal generator should use as weak a signal as will cause registration on the output meter. The signal generator should, if possible, have its ground lead connected to the B- of the receiver in question through a capacitor of about 0.25 uf.
A visual method of a-m alignment which has been found to be much quicker and more accurate than the meter method is also used. When originally instituted, this method involved the use of a "wobbulator" and an oscilloscope. Through the use of the wobbulator, an FM signal could be obtained and the i-f response curves could be seen on the scope. This method was not used to any great extent, because the system never really advanced to the point where it could be put to much use by the radio serviceman.
In FM receivers the alignment procedure is rather different because of the detector circuits and the frequency range involved. Both a meter method of FM alignment and a visual method are used widely today.
The meter method of FM alignment is the more popular, chiefly because of the high price and non-availability of certain test equipment needed for visual alignment. Manufacturers of test equipment realize the great amount of time saving and the greater accuracy involved.
in the visual alignment of FM receivers and are designing new types of FM signal generators and oscilloscopes that will be priced for the average radio serviceman.
The visual method of alignment for FM receivers is by far the quicker and more accurate of the two. The importance of this alignment procedure is further emphasized by FM receiver manufacturers, who are including the method in their service notes as an alternate means of alignment. One of the main reasons this alignment method is so very suitable is that we are dealing with an FM receiver and for visual alignment we also need an FM signal generator. This generator, which produces a true FM signal with a variable frequency deviation, provides a quick and accurate means of alignment, as will become evident later.
METER METHOD OF FM ALIGNMENT
Since the meter method of FM alignment was the first to find extensive use we will discuss it first. In the discussion of this method, as well as the visual method, we will first deal with detector alignment, as most manufacturers suggest starting with this circuit and working backwards, as with an a-m alignment. However, this is not a necessity, because the detector can be aligned last. Since the trans former involved in the different detector circuits is tuned to the i.f., detector alignment can be considered as a stage of i-f alignment. These detector stages of FM receivers are responsible for making FM alignment so different from that of a-m receivers.
Since the limiter works with the discriminator detector circuit, it will be discussed in conjunction with this detector; although the limiter system also can be considered as the last part of the i-f amplifiers. After the detector stages we will discuss the i-f alignment and then follow with the oscillator and r-f sections in the same order as in a-m receiver alignment.
The only essentials for the meter method of FM alignment are a signal generator which will cover the FM band and, also, the i.f. and a microammeter which also can be used as a voltmeter by adding a high resistance in series with it. The generator does not have to be frequency or amplitude modulated but simply has to generate an r-f signal.
Discriminator Detector Alignment
Alignment of the discriminator means that the discriminator trans former is actually being tuned to its proper i-f resonant points. The observation of correct alignment for this stage is made by placing the meter across the output circuit of the discriminator in a certain manner and then adjusting the proper controls. To understand this alignment procedure, a typical discriminator circuit is illustrated in Fig. 8-1 in conjunction with the limiter stage preceding it. We already know from the discussion on discriminators in Section 7 that when the discriminator transformer is properly tuned to resonance and the ...
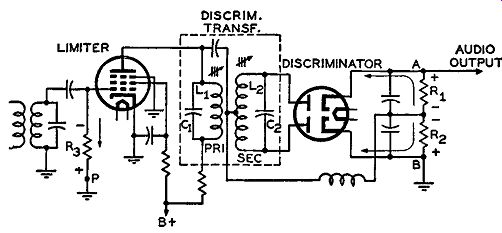
Fig. 8-1. Aligning the discriminator consists of tuning the transformer,
L1-L2, to the proper i-f resonant points. A high-resistance voltmeter,
a vacuum-tube voltmeter, or a zero-center meter is used as the indicator.
... incoming signal is equal to this resonant frequency, there will be no output across resistors R1 and R2, that is, between points A and B. This is so because the currents flowing through the diodes and, hence, through the individual load resistors equal each other, flow in opposite directions, and cause equal voltage drops across each load resistor. Alignment of the discriminator is based upon this fact.
In aligning this transformer the primary circuit tuning adjusts the linearity of the discriminator response. The exact balance or symmetry of the response is determined by the secondary. The manner in which the circuit of Fig. 8-1 is aligned is as follows: The signal generator is placed at the grid of the limiter tube and set to the i.f. of the receiver.
If a high-resistance voltmeter, preferably a vacuum-tube voltmeter, is available, place it across either one of the load resistors R1 or R1, preferably R2, since one end of this resistor is grounded, If only a microammeter is available, put a high valued resistor in series with it and connect this arrangement across either load resistor. With either one of these connections made, the output of the signal generator should be made just high enough so that a decent reading is seen on the meter. A certain polarity of voltage exists across R1 or R2 which is determined by the current flow in the diodes. Since current flows from cathode to plate, the potentials that exist across R1 and R2 are as indicated in Fig. 8-1. When connecting the meter across R1 or R2 the potentials across each should be observed.
With these preliminary connections made, adjust the variable component in the discriminator primary circuit first; in Fig. 8-1 the inductance L1 is varied. Upon proper tuning, the maximum reading on the meter indicates proper alignment of the primary. To insure that the proper point has been reached, it is good practice to "rock" the coil slightly back and forth, hitting on either side of the maximum deflection point, and gradually decreasing the swings until the maximum value is reached. This assures greater accuracy in tuning.
The next step is to align the discriminator secondary. With the generator set exactly as in the former alignment, take the meter previously used and connect it across the complete discriminator load, namely from point A to B. Next, tune the discriminator secondary inductance (as in Fig. 8-1) until a zero reading is obtained on the meter. This indicates that the secondary is properly tuned. Since most voltmeters have a zero scale reading that is difficult to approach be cause it is at the bottom of the scale, a zero center type meter is the best type to use for the secondary alignment as well as the primary.
This type of meter is similar to a galvanometer in that on one side of the zero mark the readings are positive and on the other side, negative. The zero output point can be quickly and accurately found by a rocking method such as that discussed for the primary circuit. Such a zero center meter is also perfect for the primary alignment, as we do not have to worry about polarity hookup and we can depend on any maximum reading. In using such meters, knowledge of how much voltage can be registered is important, because such meters are very sensitive and can be easily damaged. However, there are some meters with provisions for varying the sensitivity.
Since the secondary is tuned last, there may be a possibility that the linearity of the response is not true to form. A quick check of this is to choose a number of frequencies within the 75- khz peak deviation range on either side of the i.f., and to check the voltages across both load resistors. The i.f. plus 40 khz should give the same amplitude of voltage from A to B as the i.f. less 40 khz. The voltages although equal in magnitude should be opposite in polarity. A number of such points should be chosen for an over-all check on linearity, and, if they do not check closely, the primary should be retuned.
Limiter Alignment
The alignment of the limiter system which employs only one stage is quite easy. It is based upon the fact that, when the limiter i-f transformer ( which is the last i-f transformer) is properly tuned to resonance, the maximum input signal will appear on the grid of the limiter. By the nature of the potentials on the limiter tube, maximum grid current then will flow through the grid bias resistor. This maximum current flow is used in aligning the limiter stage, as well as the rest of the i-f stages.
In dealing with a single limiter, the signal generator is placed at the grid input to the last i-f stage preceding the limiter and still tuned to the i.f. of the receiver with an unmodulated signal. The meter should be placed in the grid circuit to record the point of maximum current flow. The best instrument to use is either a simple d-c micro ammeter or sensitive milliammeter which should be placed in series with the grid resistor between the low side of the resistor and ground.
This is indicated in Fig. 8-1 where point P indicates that the ground connection of R3 should be opened and the ammeter inserted. In connecting the meter remember that, due to the direction of current flow, the potentials on R8 are such that the top or grid side is negative with respect to ground. This means that the positive terminal of the am meter should be connected to ground and the negative terminal to the resistor. To be on the safe side, a milliammeter should be used to record the current flow, but if the value of grid leak resistance is high, a microammeter can be used. If one is not sure which meter to use, it is best to start with a milli-ammeter and then, if the current reading is too low, to change over to a microammeter.
If a vacuum-tube voltmeter or some sort of high-resistance volt meter is available it, too, can be used satisfactorily. This voltmeter is placed across the grid leak resistor and, since maximum current will flow at the proper alignment, a maximum voltage drop across the grid resistor will be the result. If the voltmeter used has a very high input resistance or if some high valued isolation resistor is used in series with the meter, it can be connected to the grid of the limiter and the grid return which may be B- or ground. Care should be taken to use a high-resistance voltmeter, because a low-resistance voltmeter will produce an additional load on the circuit and, possibly, throw the resonant tuning of the transformer off its true peak frequency point.
Some limiters employ two grid resistors, one of them usually a much smaller value than the other. This arrangement makes it possible to use a low resistance voltmeter without mistuning the circuit. If such a second resistor is present, it is safer, no matter which type of volt meter is available, to connect the meter across the low valued resistor.
If two grid resistors are present and an ammeter is to be used, the meter should still be placed between ground and the bottom of the last resistor, with the same observance to polarity.
After the meter arrangement is decided upon, the output of the signal generator, which is tuned to the i.f., should be the minimum necessary for a reading on the meter. This preliminary adjustment for a low input signal makes sure that the limiters do not start to saturate.
For if they do the tuning adjustments will be very broad and it will be difficult to find the true resonant position of the i-f transformers.
With this in mind, first the secondary of the last i-f transformer is tuned for a maximum reading on the meter, and then the primary is tuned. If tuning the secondary swings the needle of the meter way up, indicating that the transformer was quite off resonance, the output of the signal generator should be cut down to a point where the meter will just indicate deflection. After the signal generator's output is thus diminished, the primary of the last i.f. should then be tuned for a maximum reading. As in the alignment of the discriminator, a rocking method should be used for accuracy in finding the resonant points.
If two limiter stages are employed, we have to consider the type of coupling between the stages. Slightly different procedures of alignment are followed for the tuned and the untuned, such as the R-C or impedance coupled, types. With untuned coupling between the limiter stages, place the meter in the grid circuit of the first limiter in any manner previously described. The signal generator should then be placed at the input to the last i-f stage similar to the single-stage limiter circuit, and the alignment then proceeds in the same manner.
When the coupling between the two limiter stages is tunable, the meter is placed in the grid circuit of the second limiter rather than the first. The signal generator is then placed at the grid input to the first limiter. Alignment is secured by adjusting the tuned circuit between both limiter stages for maximum output on the meter. After this adjustment the meter should remain in the second limiter grid circuit, and the signal generator should remain connected to the grid input of the last i-f stage with the frequency still set at the i.f. Then the tuned transformer circuit preceding the first limiter stage is similarly aligned for maximum readings on the meter in the second limiter grid circuit.
It should be remembered that, in the alignment of all types of limiter circuits, the output of the signal generator should be kept as low as possible consistent with maintaining a readable deflection on the meter. This same rule should be followed in the i-f alignment.
IF Alignment of Receivers Employing the Limiter Discriminator
The meter method of i-f alignment is quite simple -- if all the i-f transformers are single peaked. For the i-f alignment, which immediately follows the limiter alignment, only the signal generator is re- moved and placed in another position. The indicating meter remains in the position it had during the limiter alignment. Up to this point all the tuned stages following and including the last i-f transformer have been aligned. If a set contains three i-f transformers, not including any transformer between cascaded limiters, the third transformer is the first unit aligned. Consequently, the second i-f transformer is the next one to be aligned. To do this, the signal generator is placed at the grid input of the i-f amplifier preceding the second i-f transformer, or at the signal grid of the mixer tube. The output of the generator is still kept at a minimum, and the frequency tuned to the same unmodulated i.f. The second i-f transformer is then aligned, starting with the secondary first and the primary last, for a maximum deflection of the meter in the limiter circuit.
After this stage is aligned, the generator is moved (if necessary) to the r-f input section of the mixer or converter tube and still tuned to the same i.f. The meter still remains in the limiter circuit, and the first i-f transformer is similarly aligned for maximum reading on the meter. This finishes the i-f alignments. With the meter and generator in the aforementioned position, a quick over-all check on the complete alignment thus far can be made by connecting a vacuum-tube voltmeter or, preferably, a zero center voltmeter across the complete discriminator load. The voltmeter should read zero at this output frequency from the generator, and the grid meter a maximum. By changing the frequency on either side of the i.f. by the same fixed amount and noting the meters we can determine the accuracy of the alignment.
The discriminator load meter should read the same voltage on either side of the i.f. but of opposite polarity. The limiter grid meter should also read the same value on either side of the i.f., but the polarity remains the same. A number of such plus and minus off-resonant frequency i.f.'s should be used for a more complete over-all alignment check on the i-f and limiter-discriminator circuits.
In their service notes many manufacturers consider the i-f and limiter alignment in an over-all procedure. For example, the indicating meter to be used is placed in the proper limiter grid circuit, the signal generator output is connected to the r-f grid input of the converter or mixer tube, and the frequency is adjusted to the i.f. of the receiver. With these two instruments remaining in position, the very last i-f transformer, including any between two cascaded limiters, is aligned first for maximum output reading. The other i-f transformers are then aligned, working from the back to the front of the receiver in the same manner. The signal generator's output should always be kept at a minimum for reasons previously mentioned. The reason for such a quick alignment method is that manufacturers assume that the receiver, if mistuned, cannot be too far off alignment. However, for over-all accuracy in the meter method of alignment the former method is definitely recommended.
The i-f alignment just discussed is quite easy and simple to under stand. The simplicity is primarily due to the fact that all the i-f trans formers were single peaked, and the maximum reading point at the meter indicated that the peaks of the i.f. had been reached. In FM receivers that employ overcoupled or double-peaked i-f transformers, it is not so easy to follow the same method. The difficulty lies in the shape of the overcoupled i.f.'s response curve. If you will recall (see Fig. 7-9), the overcoupled response curve has two side peaks that are higher in amplitude than the actual resonant frequency of the trans former. In aligning such a stage, therefore, a maximum reading may indicate that one of the peaks has been reached and not the resonant frequency. It is quite cumbersome to shift the frequency setting of the signal generator in an attempt to find both peaks, so that the point of resonance can be found.
If it is known which i-f stages are overcoupled, a very simple procedure can be followed. It is known that if we load a tuned circuit with a resistance, its effective Q decreases and its over-all frequency response characteristic changes. The resistance reduces the over-all gain of the stage, but at the same time it brings down the double peaks at a quicker rate than the resonant point decreases. The effect of this loading is to produce a new response curve with a single peak which can be easily determined. Therefore, in aligning an overcoupled stage, a low valued carbon resistance, between 200 and 500 ohms, is soldered across the secondary of the overcoupled i-f transformer. The leads of the resistor should be as short as possible, so that they will not intro duce any capacitive or inductive effects which may detune the circuit.
This is important because of the high frequencies involved. After this is done, the signal generator may be placed at the grid input of the tube preceding the overcoupled i-f transformer for greater accuracy, rather than at the signal grid of the mixer tube, and the output frequency set at the i.f. of the set. The meter of course remains in the limiter grid circuit. The secondary and then the primary are adjusted for maximum deflection on the meter. This point of deflection will not be so sharp as the others because of the wide and almost level response that occurs with low Q circuits. Therefore, care must be taken in tuning the i-f transformer to make sure the peak has been reached.
Before advancing to any other stage, the resistor should be removed from the overcoupled transformer and the same alignment followed with any other overcoupled transformers. After all such transformers have been aligned ( there is usually only one overcoupled, the second i-f transformer), the rest of the i.f. is aligned as previously outlined.
At the frequency of the i.f., the loading network, due to the introduction of unwanted capacitance effects, may cause detuning in the i-f transformer. This is highly undesirable since it can be a cause of faulty alignment of overcoupled i-f stages. To keep the amount of detuning to a minimum when using loading networks for overcoupled i.f.'s, the connecting leads of the loading network should be as short as possible. Furthermore, the loading network should be arranged to offer as small stray capacitance effects to ground as possible. The meter method of aligning overcoupled i-f transformers thus has its disadvantages. For true accuracy, these i-f's, as well as the rest of the FM receiver, should be visually aligned. This does not require loading networks across the i-f transformers, and consequently mistuning will not be present. Visual alignment procedure is discussed later in this Section.
R-F and Oscillator Alignment
The alignment of the r-f and oscillator circuits is very similar to that used for a-m receivers. One receiver may use more tracking coils or capacitors than another receiver, but this information is usually sup plied by the manufacturer's service data.
As in a-m alignment, some sort of dummy load is used to couple the r-f signal generator to the antenna circuit. The meter still remains in the grid circuit of the limiter. The specified alignment of the r-f and oscillator sections differs somewhat with different set manufacturers.
Some suggest starting at the high end of the band and working down, while others stipulate that alignment should start at the low end of the band, and still others suggest going from end to end and finally to some middle point of the band. The final result will essentially be the same if the complete alignment instructions are followed and if they are repeated more than once. It should be remembered that some circuits have more trimmers and tuning slugs than others. By the use of these extra adjustments, a finer alignment can be perfected over the entire band as long as we know which variable components to tune.
For the purpose of discussion we will start at the high end of the band. The signal generator is set on an unmodulated frequency some where around 105 mhz, and the receiver dial is also set to this frequency. The necessary oscillator trimmers and/or tuning slugs are then adjusted for maximum output in the limiter grid meter. It should be remembered that here, too, the output of the signal generator must be kept low enough just to indicate a maximum reading on the meter in order to avoid saturating the limiter. After the oscillator is adjusted, then vary the necessary r-f trimmers and/or tuning slugs for maximum output on the meter. If there is more than one r-f tuned circuit, adjust the one used as the input to the mixer or converter first and then adjust the others, working back to the antenna. Usually not more than two r-f tuned circuits are employed.
A check should be made to determine whether or not the dial set- ting is exactly what the oscillator and mixer trimmers have been adjusted to. If the previous maximum point on the indicating meter rises when the receiver dial is rotated on either side of its setting of 105 mhz, the oscillator and r-f are not correctly aligned. When this occurs, the oscillator circuit should be retuned and then the r-f circuits. A quick method of finding the r-f peaks is to "rock" the dial knob very slightly on either side of the 105-mhz setting while adjusting the r-f trimmers. If the receiver dial does not tune exactly back to 105 mhz at the maximum deflection of the meter, the dial should be slowly turned to the 105-mhz position while the necessary oscillator trimmers are retuned for maximum output until the 105-mhz point is reached.
After making sure this alignment is correct, set the receiver dial and signal generator to some low frequency at the other end of the band, say 90 mhz. The next step is to align the oscillator again, using only the necessary trimmers or padders, as they are often called, for the low frequency adjustments. Align for maximum output on the meter. Next adjust the r-f stages in the order just described, for maximum meter output, while rocking the dial. Check these low alignment points in the same manner as the high end, and if misaligned, readjust as indicated. After this low-frequency end has been adjusted, go back to the high end and check the alignment there and readjust if necessary.
The foregoing procedure will usually suffice for routine alignment.
However, for greater accuracy when a set is badly aligned to begin with, a point or two within the middle of the dial may be chosen, and the signal generator set to this frequency. The oscillator and r-f stages are then checked to see if they are likewise aligned on these center frequencies. If not, readjust the necessary trimmers. After all these steps have been completed, it pays to recheck the low and then the high end again.
It should be remembered that some manufacturers only give data for aligning on the high end of the band for the complete r-f and oscillator alignment.
Ratio Detector and I-F Alignment
A number of methods of aligning ratio detectors are in use today.
Some are more accurate than others, but, comparatively, take a little longer. Three of the principal methods will be discussed, and from the separate analyses a choice can be made. Although the circuits arrangements for ratio detectors differ somewhat, the schematic of Fig. 8-2 will suffice for all the methods to be outlined. In some methods the primary of the detector is aligned first, all the i-f stages next, and the secondary of the ratio detector last. Other methods align the complete detector first and then work backwards with the i.f.'s as usual. Since it is believed the latter method is somewhat more accurate than the others, it will be studied first.
For this alignment a high-frequency signal generator and a vacuum tube voltmeter or a zero center meter are needed. The meter is first connected across resistor R1 to ground; in other words across the resistance-capacitance time constant network in the output circuit.
The signal generator is connected to the grid of the last i-f stage and set to the i.f. of the receiver. The primary of the ratio detector trans former then is adjusted for maximum output on the meter. This indicates that maximum current is flowing through R1.
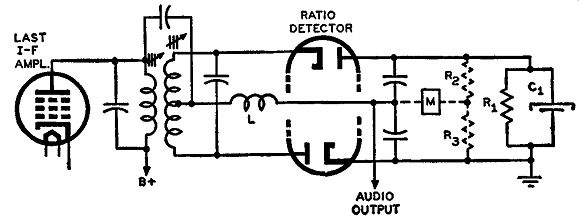
Fig. 8-2. Schematic of a typical ratio detector circuit. In some alignment
methods the detector primary is aligned first, then the i-f stages, followed
by the detector secondary. In other methods, the complete detector is
aligned first and then the i-f stages.
To tune the secondary properly, the circuit should be symmetrical.
In Fig. 8-2, the output load resistor R1 sometimes consists of two separate but equal valued resistors, which would make the secondary tuning very easy. However, if no such double resistors exist, take two high valued resistors about 100,000 ohms each and solder them across the load resistor, R1 as shown by R2 and R3 in Fig. 8-2. The values of these resistors should not differ from each other by more than 5 percent, otherwise the circuit will not be symmetrical when the secondary alignment is made. With this completed, connect the indicating meter between the center of the two resistors and the point of audio output.
This is shown in Fig. 8-2, and this arrangement readily shows how symmetry exists across both diode circuits where coil L and the meter are common to both circuits. With the signal generator still at its previous position and frequency setting, the secondary of the ratio detector transformer is tuned until a zero reading is observed on the meter.
This indicates that the secondary is aligned.
After the discriminator transformer is aligned, remove any resistors that may have been attached for alignment purposes, and place the meter once more across the load resistor, R1 in Fig. 8-2. With the meter in this position for the rest of the receiver alignment, adjust the i.f. first and then the oscillator and r-f circuits in any one of the previous methods outlined. All adjustments should be made for maximum output on the indicating meter.
A second method of ratio detector alignment is to detune the secondary of the detector coil by turning the adjustable component all the way out. This is done before any actual alignment is started. The purpose of detuning is to make sure that the transformer secondary has no resonant effects while the other stages are being tuned. The signal generator is tuned to the i.f. (unmodulated), and it is placed either at the r-f grid of the converter or at the control grid of the last i-f tube. If it is placed in the former position, it remains there for the complete i-f and detector alignment, but when in the latter position it has to be moved toward the front of the receiver in conjunction with the stage to be aligned. The meter is then placed between the point of audio output and the junction between the two load resistors in the output. If only a single load resistor exists, temporarily attach two equal but high valued resistors across the output during the complete alignment of the receiver.
With these preliminary adjustments made wherever necessary, tune the primary of the ratio detector coil for maximum output. Maximum output now indicates alignment because the secondary of the detector transformer has been completely detuned. Working backwards, tune the last i-f transformer's secondary and primary coils for maximum output and so on for the other i-f transformers. After all the i.f.'s are aligned, adjust the discriminator secondary for zero voltage output on the indicating meter.
For the oscillator and r-f stages place the meter across R1 and ad just these stages for maximum output, as outlined in the section of the oscillator and r-f alignment of the limiter-discriminator receiver.
A third method involves the use of an a-m signal and a simple out- put meter applied across the speaker voice coil. In this method, the ratio detector secondary is also completely misaligned by turning its trimmer capacitor or tuning slug way out. The signal generator is either placed at the converter grid or last i-f amplifier grid and set to the i.f. of the receiver. This frequency should be amplitude modulated. If the generator is placed at the grid of the last i-f tube, then in aligning the i-f stage we work backwards, as in other methods.
This alignment is based upon the fact that detuning the detector secondary throws it completely off any possibility of resonance within the range of operation, and, therefore, the detector circuit is unbalanced. As a result of this degree of unbalance, the ratio detector is able to respond to amplitude changes as well as frequency changes in the applied signal. Consequently, an output meter is placed across the voice coil as mentioned, and an a-m i-f signal fed into the circuit.
The primary of the ratio detector transformer is aligned first for maximum audio output on the meter. Then working backwards, the i.f.'s are aligned for maximum output, in a similar fashion to the other detector systems. After the i.f.'s, the oscillator and r-f stages are aligned. The alignment for these sections is the same as in the other methods, but for this method the output of the generator is constantly amplitude modulated and the alignment is for maximum indication on the output meter. After the i-f, oscillator, and r-f stages are all aligned, the signal generator is placed at the r-f grid of the converter and set to the i-f signal of the receiver. The signal is still amplitude modulated. Then the secondary of the ratio detector transformer is adjusted for minimum reading on the output meter. This reading may be difficult to find, so it is suggested the adjustment be made very slowly until the minimum point is found. Realign this stage once or twice more to make sure the same minimum point is reached.
Locked-In Oscillator Detector Alignment
The meter method of alignment of a locked-in oscillator circuit is quite different from the other two detector circuits. At the time of this writing, Philco is the only manufacturer employing the locked-in oscillator detector, so the alignment method described will center around Philco receivers, models 46-1213 and 48-482.
An a-m signal generator and an output meter are needed. The output meter is placed across the voice coil of the speaker and remains there throughout the complete alignment. To turn this set to the FM position, the FM push button has to be depressed. Other preliminary adjustments required include turning the volume and treble controls to their maximum clockwise positions, and turning the bass control to its maximum counterclockwise position. The ganged tuning capacitors should be fully meshed. The detector tube used in this unit is the special Philco FM 1000. In this receiver it is best to adjust the i.f.'s first, then align the detector circuit, and the oscillator and r-f networks last. This is similar to some of the FM receiver alignments previously discussed. To align the i.f.'s, the detector is first made inoperative from the stand point of its operating as an FM detector. To accomplish this, the first grid of the detector, the oscillator grid, is directly grounded, Refer to the locked-in oscillator detector schematic of Fig. 8-3 (this circuit is the same as Fig. 7-39 but is redrawn here for easier reference). Grounding this grid makes the oscillator inoperative, and hence the locked-in effect or FM detection is ineffective. Although the circuit is inoperative as far as FM detection is concerned, it does function as an a-m grid-leak detector, and an a-m signal can be used to align the i-f stages.
According to manufacturer's specifications, the signal generator is placed at the r-f grid of the converter, and the i.f.'s are then aligned.
However, it is also possible to connect the signal generator to the grid of the i-f amplifier tube preceding the transformer being aligned. In either method the i-f transformers are aligned from the last i.f. to the first. In checking the i.f.'s, the signal generator is set to the intermediate frequency of the receiver which is 9.1 mhz. This output signal is amplitude modulated preferably at 400 cycles, but other frequencies can also be used. The alignment procedure, as carried out by the John F. Rider Laboratories essentially works as follows: If the output of the signal generator is strong enough, it should be placed across the grid of the i-f amplifier preceding the i-f trans former to be aligned. Otherwise it should be placed across the grid of the preceding i-f amplifier and so on toward the front end of the receiver until the output can just be detected. The secondary of the last i-f transformer is aligned first and the primary next, both for maximum reading on the output meter. The same type of alignment is followed for the other i-f transformers, working backward toward the front end of the set until the first i-f transformer is aligned last.
To align this last i-f transformer the output from the signal generator is placed at the signal grid of the mixer tube. Throughout this alignment the signal generator is set at an a-m signal of 9.1 mhz. As an alternative method of aligning the i-f's a VTVM (vacuum tube volt meter) is placed across the ave bus and riot the output meter. Th6 alignment is made as in the previous case, except that it is made for maximum readings on the VTVM. With this method the oscillator grid of the lock-in detector tube does not have to be grounded. The VTVM should not be placed directly at the diode plate (that delivering the ave voltage in FM) because this would tend to load down the final i-f transformer.
After the i-f's, the detector circuit is aligned. The ground (if any) from the oscillator grid of the detector tube is removed. For this alignment the output meter is placed across the speaker voice coil.
The signal generator is placed at the grid of the last i-f amplifier tube and set at the 9.1-mhz i.f. of the receiver, but the signal should be unmodulated. The quadrature network is then short-circuited out by placing a jumper wire across it. This permits exact alignment of the oscillator section of the FM 1000 detector tube. The oscillator circuit is then adjusted by varying the oscillator trimmer C, in Fig. 8-3 until a zero reading is obtained in the output meter. This is sometimes referred to as a zero beat or a minimum response point. A zero beat note indication should also be obtained in the loudspeaker. This alignment indicates that the oscillator frequency and input signal generator frequency are exactly equal, because, when beating inside the FM 1000 detector tube, a zero beat note is obtained. In other words, the difference frequency is zero.
The short circuit across the quadrature network is removed to complete alignment of this stage. The signal generator remains where it is with the strength of its output signal kept low enough so that the oscillator of the FM 1000 tube does not lock-in with the incoming signal. As mentioned in Section 7, a minimum input signal must always be maintained for proper lock-in action, therefore, we are trying to keep the signal generator below this threshold. If this procedure is used, a zero beat note will also be indicated in the loud speaker, and the output meter will read zero by proper adjustment of the quadrature coil L8 in Fig. 8-3. A false zero beat note will be the result if the output of the signal generator is not kept low enough.
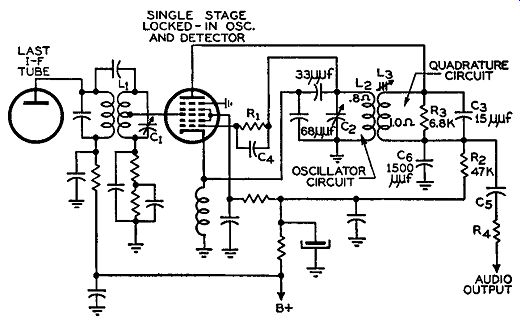
Fig. 8-3. Schematic of the locked-in oscillator and detector circuit.
which is aligned by first adjusting the i-f stages, then the detector, high frequency oscillator, and the r-f networks last.
Next to be aligned is the front end of the receiver, namely, the high-frequency oscillator and r-f stages. To align these stages with an a-m signal generator, the first grid of the FM 1000 detector tube (its oscillator section) is again grounded so that the tube will once more function as an a-m detector. The signal generator is then connected to the high side of the FM antenna socket. The receiver dial is set to some frequency on the high end of the band, for example, 105 or 106 mhz, and the generator likewise set to the same frequency.
The output signal from the generator should be amplitude modulated.
This effectively puts the generator signal at the grid input of the first r-f amplifier of the receiver. The high-frequency oscillator trimmer capacitor then is adjusted for maximum reading on the output meter. With the connections as they are, turn both the signal generator and receiver dial to the same frequency somewhere at the low end of the FM band between 88 and 90 mhz. At this setting the oscillator coil is adjusted for maximum output. The coil is not permeability tuned and consists of approximately 3 ¼ turns of wire. To align it the physical spacing between its turns is corrected to give maximum output on the meter. These two oscillator adjustments should be realigned a few times for best results.
With the signal generator and receiver dial returned to the high frequency position, adjust the r-f trimmer capacitor for maximum output while "rocking" the receiver dial as described in previous alignments. Tune the r-f trimmer for maximum output. Next similarly adjust the antenna trimmer.
The r-f and antenna coils, each consisting of about 3¾ turns of wire, are aligned next, starting with the r-f coil. The signal generator and receiver dial are once again turned down to the low-frequency end of the band and set at the same frequency. For this alignment the frequency setting should be about 2 mhz higher than the previous low frequency setting. The r-f coils are aligned similarly to the oscillator coil by varying the physical spacing of the coils, spreading or compressing them to conform with maximum meter reading. The r-f coil is usually aligned first.
For very accurate adjustments these r-f trimmers and coils should be realigned a few times. The manufacturer suggests that a tuning wand be used for checking and for determining whether the oscillator and r-f coils should be spread apart or compressed. A tuning wand is a rod-shaped object, one end of which is brass and the other powdered iron. The method of testing is to insert into, or place near the coils, first one end of the wand and then the other. If the brass end causes an increase in output meter readings, the coil should be spread slightly, and if the powdered iron end increases the output meter reading, the coil turns should be compressed. When the output meter decreases upon the insertion of either end of the wand into the coil, the coil is then properly adjusted. It should be remembered that we are dealing with very high frequencies, and a slight change in inductance can cause a large change in frequency. Consequently, the adjustments of the coils must be made with care, so that any expansion or compression causes only a slight change in the physical spacing between the coil windings.
VISUAL METHOD OF ALIGNMENT
Quicker and more accurate than the meter method, the visual method of alignment for FM receivers involves the use of an oscilloscope and an FM signal generator. The same points of alignment used in the meter method are used. Essentially, the oscilloscope replaces the meter, and an FM signal generator replaces the previous generator. In this method of alignment, we actually see the response curves of the i-f's and detector circuits, whereas in the former method we had only maximum points as indicated on a meter. With the visual method it is not necessary to make special tests on the linearity of the detector or to load down overcoupled i-f transformers.
The oscilloscope itself is a voltage indicating device and, hence, has to be placed across the particular circuit to be measured. To measure current waveforms, the current in question is made to pass through a resistor, and the oscilloscope is placed across this resistor. Though a voltage is being measured, essentially a current waveform is converted into a voltage waveform and then the measurement is made.
However, since the resistor produces no phase change in the current, the voltage waveform measured is essentially a reproduction of the current waveform. For this reason the oscilloscope is placed across the limiter grid resistor and not in series with it.
For visual alignment, it is important to know what type of signal is being used to frequency modulate the r-f oscillator within the FM generator. Type of signal is meant here in the sense of wave shape rather than frequency. With this information, therefore, we know what type of wave shapes to expect in viewing the oscilloscope.
Most FM signal generators have internal sine wave modulation though some generators also provide for external modulation. If sine wave modulation is employed, the modulating sine wave is often used as an external sweep in conjunction with the oscilloscope. To learn the wave shape appearing on the oscilloscope screen in this case, let us apply an FM signal to any type FM receiver and check on the S-shaped characteristic of the detector.
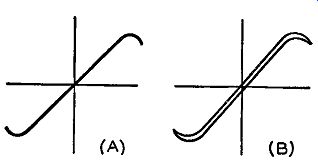
Fig. 8-4. When the detector system is correctly balanced, the S-curve
oscillogram will be as in (A), but if the balance is not perfect or if
phase distortion exists, a double S curve results as in (B).
FM Signal Generator With Sine Wave Modulation
If the FM signal generator has sine wave modulation, this modulating signal should also be brought out to a special outlet on the generator chassis. This is so that the same modulating voltage may be used as the external sweep for the oscilloscope to obtain perfect synchronization without any adjustments. With respect to the S-shaped characteristic of a detector, the picture on the scope will be similar to that shown in Fig. 8-4 (A) or (B) when this type of generator is used.
Both pictures essentially consist of two S curves In Fig. 8-4 (A) the curves are exactly alike due to perfect over-all balance of the detector system and distortionless output of the signal generator, in which case one curve coincides with the other and only one curve is actually seen.
If the system is not in perfect balance or if the output from the signal generator is distorted, both curves will appear similar to that shown in Fig. 8-4 (B). This picture indicates a phase difference between the two curves which should not exist. In each case we consider this type of generator to produce a single S curve.
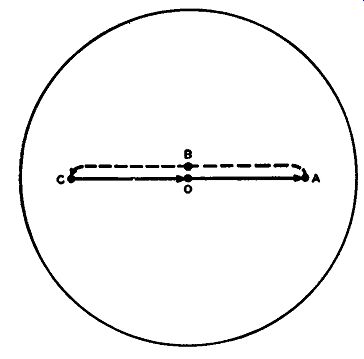
Fig. 8-5. The movement of the beam of a cathode-ray tube or the spot
in tracing a pattern on an oscilloscope screen with a sine-wave in put
only on the horizontal plates is: the spot starts at 0 (zero voltage)
and travels to A to the maximum positive peak, then through B to C to
the negative peak, and then back to 0 (zero voltage again), completing
the cycle. The dotted line really coincides with the solid line.
That only one curve effectively appears is due to the sine wave sweep. With the oscilloscope turned on and with no input signal applied, a spot appears on the screen which is usually centered by manipulation of the correct controls. The vertical plates of the oscilloscope are connected across the output of the detector circuit, and the horizontal plates receive the sine wave output of the signal generator.
The internal sweep of the scope is in the off position. Without a sweep signal, only a straight vertical line would appear on the screen of the oscilloscope. With sine wave sweep voltage applied the S characteristic, which actually consists of two individual S curves, then appears. The action is best explained by considering the movement of the electron beam or spot on the oscilloscope when only the sine wave sweep is employed.
Assume that the sine wave starts from a zero position and is in creasing positively. While the sine wave is increasing to its maximum peak, an increasing positive voltage is constantly applied to the horizontal plates. This causes the beam to shift all the way over to one side.
We will assume that it is the right side of the screen. In Fig. 8-5 this movement is represented by the solid line OA. From the positive peak of the sine curve to the negative peak of the same curve, the input sine wave voltage is decreasing, in which case the spot reverses its direction and moves from point A on the screen to point C, as shown by the dotted lines. At point B the sine wave crosses its baseline which coincides with point 0. To complete one cycle of sine wave, we travel from the negative peak to the baseline again which is in a positive direction. Consequently, the spot on the screen moves from point C back to point 0, shown by the solid line, thus completing the cycle.
What actually happens is that from point A when the spot is moving to the left, it is really moving over the same line traced out by OA, but in the picture of Fig. 8-5 it is shown slightly displaced for the sake of illustration.
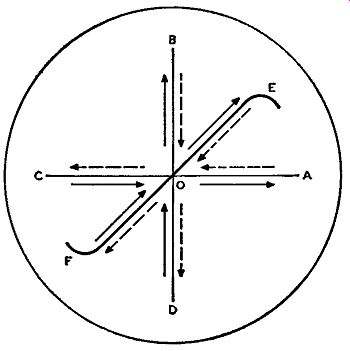
Fig. 8-6. How the S-curve pattern is developed on the oscilloscope.
Line OA represents the increasing amplitude of the modulating sine wave,
and OB represents the increase in frequency of the modulating audio and
hence the frequency deviation of the FM signal. Lines OC and OD represent
the decreasing amplitude and frequency of the signal respectively. The
solid arrows indicate an increase in amplitude or frequency, and the
dashed arrows a decrease.
From this analysis it is readily seen that, during any one cycle of sine wave input to the horizontal deflection plates, the beam effectively traverses the screen in one direction during one half of the cycle and retraces its same path, but in the opposite direction, during the other half cycle.
With this much explained we can now show how two S curves are traversed during application of the signal to the vertical deflection plates. In Fig. 8-6 line BD represents the vertical input signal as it appears on the scope without any horizontal deflection, and line AC represents the horizontal sine wave deflection as it appears on the scope without any vertical deflection. With both of these signals applied to their respective deflection plates two coinciding S-shaped curves will be traced out. It should be remembered that the same modulating wave of the signal generator's FM signal is applied to the horizontal deflection plates. This means that during the positive increase of the modulating sine wave the FM signal is also increasing in frequency and during the modulating wave's decreasing amplitude the FM signal is decreasing in frequency. If line OB represents the range of increasing frequency going from O to B, line OA represents the increasing amplitude of the sine wave input going from O to A. Therefore, with both deflection plates of the oscilloscope receiving their proper signals, the following happens: While the sine wave is increasing in amplitude from O to A, the FM signal is increasing in frequency from O to Band, since the sine wave input is synchronized to that of the modulating signal, the high-frequency end of an S-shaped curve will appear on the screen being traversed from point O to E. These three synchronized movements are indicated by the solid line arrows in directions OA, OB, and OE respectively. After the sine wave has reached its positive peak (point A), it starts to decrease in amplitude toward its negative peak, point C. Likewise the frequency of the FM signal decreases where its lowest frequency corresponds to point D in Fig. 8-6. Each decrease is represented by dashed-line arrows pointing in the direction of decrease. At the start of the decrease the S-shaped curve is formed only between points E to 0. Thus, during the complete decrease the S-shaped curve is traced out from points E to F in the manner previously described.
This means that we have retraced curve EO and have traced out section OF. This S-shaped tracing is illustrated by the dashed arrows next to the curve.
While the sine wave is increasing again from its negative peak to the zero baseline, the frequency of the FM signal is also increasing.
Therefore, the sine-wave curve traces out line C to 0, and the signal across the detector traces out line D to 0. These two movements once again trace out the S-shaped curve, and this time it goes from point F to O which has already been traced out.
Thus, during any one cycle of sine wave sweep the S-shaped curve is traced out twice; but due to the nature of the system one curve coincides with the other, and only one curve is seen on the screen. If the detector system is unbalanced or if the FM signal generator produces a distorted output, the two S curves may actually appear on the screen as shown in Fig. 8-4 (B). It might appear that line EF in Fig. 8-6 should be simply a straight line. However, the curves are introduced by the nonlinearity of the detector outside the band of frequencies for which it is designed to operate. That is, for +75 or 100 khz, variations in deviations produce corresponding deviations in output. When the deviations exceed the limitation imposed by the operating design of the detector system, bends will appear in the curve. Consequently, the so-called S-shaped curve appears on the oscilloscope screen.
Signal Generator Employing Wobbulator
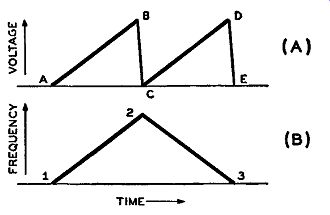
Fig. 8-7. When a wobbulator is used with a signal generator for visual
alignment in obtaining a double S curve, as in Fig. 8-8, the frequency
of the oscilloscope saw-tooth sweep (A) must be twice that of the modulated
signal (B).
In the type of FM visual alignment equipment to be discussed here, two S-shaped detector output curves are also traced out on the oscilloscope screen, but in a different manner. Besides the oscilloscope, a wobbulator and a signal generator are needed. A wobbulator was discussed in Section 3. The signal generator can be a straight r-f generator of the proper frequency range or any modulated generator, wherein provision for shutting off the modulation i3 made. In either case some easy means should be available for connecting the varying capacitance output of the wobbulator across all or part of the generator's tank circuit. The frequency versus time characteristic of the oscillator due to the motor-driven capacitor is essentially a triangular shaped curve for one revolution of the capacitor.
[For a more comprehensive analysis of wobbulators in conjunction with oscilloscopic patterns see "The Cathode-Ray Tube at Work" by John F. Rider, John F. Rider Publisher, Inc., pages 235-57.]
A definite relationship between the frequency of the oscilloscope saw-tooth sweep and the modulation frequency due to the wobbulator is necessary. This is illustrated in Fig. 8-7, where part (A) represents two cycles of the oscilloscope saw-tooth sweep, and part (B) one cycle of modulated signal. In other words the modulation frequency is to be equal to ½ the oscilloscope sweep frequency. This is essential for a double S-shaped discriminator characteristic, such as curves JK and LM in Fig. 8-8, to appear. The complete hookup for this system is to connect the modulating output of the wobbulator across the signal generator's oscillator tank circuit, as mentioned previously. The detector output of the receiver is placed across the vertical terminals of the oscilloscope. The output of the sync pulse generator of the wobbulator (working on the same shaft as the motor-driven capacitor) is placed across the sync terminals of the oscilloscope. The sync selector switch of the oscilloscope is turned to the external sync position. The output of the signal generator is now frequency modulated.
So far as the detector circuit is concerned, this output should be equal to the i.f. of the receiver and preferably placed at the grid input to the last i-f amplifier or limiter, whichever is the last tube before the detector in question. If not enough signal is obtained by this hookup, then, under the assumption the i.f.'s are aligned correctly, place the generator at the signal grid of the mixer or converter tube of the set.
With all these initial hookups made, the sweep frequency controls of the oscilloscope are adjusted until two S-shaped curves, as shown in Fig. 8-8, appear. When this happens the frequency of the saw-tooth sweep of the oscilloscope is equal to twice the frequency of the modulating signal from the wobbulator. With reference to Figs. 8-7 and 8-8, the double S pattern is traced out as follows:
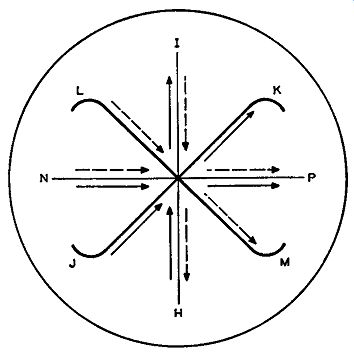
Fig. 8-8. As the frequency of the saw-tooth voltage of the oscilloscope
is twice that of the wobbulator output, two S curves are traced on the
screen. The output of the sync pulse generator of the wobbulator is placed
across the oscilloscope sync terminals and the oscilloscope sync switch
placed in the external sync position.
When the saw-tooth signal part (A) of Fig. 8-7 is sweeping from A to B, it traces out path N to P on the oscilloscope screen, as seen by the solid arrows in Fig. 8-8. At exactly the same time the modulating signal, and hence the FM wave, essentially changes in frequency from 1 to 2 in Fig. 8-7 (B). This means that the detector output applied across the vertical terminals of the oscilloscope traces the path H to I followed by the solid arrows in Fig. 8-8. As a result of these simultaneous traces of N to P and H to I, one S-shaped curve is traced out, namely JK in the direction of the solid line arrows.
The retrace time, B to C, of the saw-tooth wave in Fig. 8-7 (A) is so very rapid that the saw-tooth sweep voltage of the oscilloscope essentially snaps back from point P to N, Fig. 8-8, before the frequency of the modulated signal starts to decrease from point 2 of Fig. 8-7 (B). Consequently, when the saw-tooth wave starts to increase in amplitude from points C to D, the modulated signal decreases in frequency from points 2 to 3. Thus, on the oscilloscope the saw tooth once more is tracing out path N to P, but the output from the detector is tracing out its return path from I to H. These traces are shown by the dashed arrows in Fig. 8-8. This latter movement traces out the other S curve from points L to M in the direction of the dashed arrows. The retrace time ending the second cycle of saw-tooth sweep is so rapid as to have negligible effect on the double S pattern.
When FM receivers first appeared on the market, the system using the wobbulator was very popular because of the lack of service type electronic FM signal generators. Today it is obsolescent mainly be cause of the many FM signal generators now available. In addition, the high-frequency nature of FM and the fact that it does not lend itself to an easy means of varying the deviation have made it impractical. The following alignments employ sine wave modulation.
Visual Alignment of the Discriminator Detector
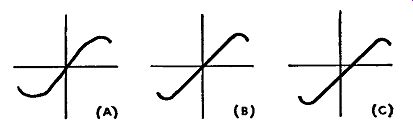
Fig. 8-9. Sketches of S-curve oscillograms: (A) discriminator primary
not aligned; (B) primary and secondary aligned correctly; ( C) secondary
not aligned.
In visually aligning this stage, the vertical input terminals of the scope, sometimes called the Y axis terminals, are connected across the discriminator load between A and Bin Fig. 8-1. The high side of these terminals is connected to point A and the ground side to point B. The output of the FM signal generator is placed at the input to the limiter tube and the ground side of the generator attached to the receiver circuit ground. The generator is set at the i-f of the receiver and frequency modulated. If a variable audio modulating signal is available within the signal generator, any modulating frequency can be chosen; 400 cycles is the usual frequency. Since the so-called linear range of response of the discriminator should be at least 150 khz peak to peak, the deviation of the FM signal generator should be set to at least 200 khz peak to peak. If the signal generator can go above this deviation value, as most modern FM generators can, it would be advisable to use a deviation of about 300 to 400 khz, so that the complete output curve can be visualized. The sine wave modulating signal from the generator should then be attached across the horizontal deflection terminals of the oscilloscope, sometimes called the X axis terminals, for the purpose of the sweep signal. In this case the sweep of the oscilloscope should be turned off.
With these preliminary settings made, some form of S curve should appear on the scope. Adjust the primary of the discriminator trans former first to obtain the best possible linearity in the S curve. Next adjust the secondary of the discriminator transformer to center the mid-point of the curve. The three pictures of Fig. 8-9 serve to illustrate the discriminator alignment. Part (B) of this figure shows the correct pattern; part (A) shows that the primary has to be aligned, and part (C) shows that the secondary has to be aligned. Of course when the setup is such that two S curves which are mirror images of each other appear, each should indicate the same kind of defects. Upon proper alignment both S curves should be linear and the crossover point should be in the center of each curve.
Visual Alignment of Limiter and I-F Stages
For this alignment, the vertical terminals of the oscilloscope are placed across the proper limiter grid resistor. The signal generator is then attached to the grid of the preceding limiter tube, if transformer coupled limiters are used, or to the grid of the last i-f amplifier. The controls of the generator should remain at the same frequency setting, namely the i.f., but the deviation control should be increased to en compass the complete i-f response curve. If a peak-to-peak deviation of 600 khz is available, it should be used; if not, the highest deviation available should be used. With these preliminaries completed, the last i-f transformer is aligned, starting with the secondary. If the trans former coupling is under critical, then only one peak will be the result of its response curve. Therefore, this i-f transformer should be adjusted for maximum peak of the curve as seen on the oscilloscope where the middle of the peak should be at the center of the over-all curve. The desired pattern is shown in Fig. 8-10. If the stage is over coupled, the alignment should be made so that the two outside peaks of the curve fall symmetrically on either side of the center frequency dip. The correct pattern is shown in Fig. 8-11 where AB is equal to BC.
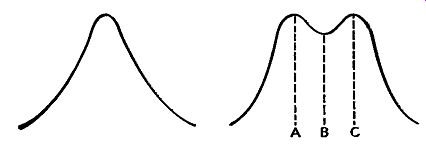
Figs. 8-10, left, 8-11. If transformer coupling is under critical, a
single peak response curve results, as in Fig. 8 10; but if the stage
is overcoupled, a double - peaked curve results, as in Fig. 8-11.
The next step is to move only the signal generator with all the set tings intact to the grid of the preceding i-f tube and align the next i-f transformer starting with the secondary. The picture that will be formed on the oscilloscope will be the over-all response curve of the last i-f transformer plus the one to be aligned now. If both i-f trans formers are single peaked, this stage should be aligned so that the single peak pattern shown in Fig. 8-10 appears. Since one curve is effectively added to the other, the gain of the generator and/or scope should be decreased in proportion. If the stage now to be aligned is overcoupled, then, no matter how the last i-f stage is coupled, the picture to look for would be a double-peaked curve that is symmetrical about its center frequency. The true curve may contain two double peaks that are not too sharply defined, so the alignment should be done carefully.
The immediately preceding i-f transformer and the others on back to the first i-f transformer in the set are aligned next in that order. In each case the signal generator is placed at the grid of the amplifier preceding the i-f transformer. In each alignment the picture on the oscilloscope will be a composite response curve of so many i.f.'s. In all cases, whether the i.f.'s are all double peaked, all single peaked, or a mixture of both, the picture should be a symmetrical response curve, either with double peaks that may not be too well defined or just a single-peaked curve.
In all these alignments the output of the signal generator should be as low as possible, so that the limiter is not driven into its saturation or limiting action point.
As yet there is no visual alignment method used in servicing, whereby each and every i-f stage is aligned separately so that each individual response curve can be seen on the oscilloscope. Such alignments are possible but the necessary equipment is not readily avail able to the serviceman.
R-F and Oscillator
Visual Alignment in Limiter-Discriminator Receivers
To align these stages the oscilloscope remains across the limiter grid resistor, but the FM generator is coupled to the antenna terminals of the receiver through the dummy antenna specified by the manufacturer. The deviation and modulating frequency settings remain as they are, and so does the sweep attachment to the horizontal plates of the oscilloscope, if any is made. Only the output frequency setting of the generator is changed. The oscillator and r-f alignment procedure discussed under the meter method of alignment is now ap plied here. In this case the adjustments are made for maximum and symmetrical i-f response curves on the oscilloscope.
Visual Alignment of Ratio Detector and IF Stages
Since there is no limiter from which the i-f response can be taken off, the oscilloscope is usually placed as indicated by M in Fig. 8-2, or from the audio output lead to ground. The FM signal generator is attached to the grid of the last i-f tube. A few variations in the visual alignment of the ratio detector are specified by different manufacturers. These methods will now be described.
Similarly to the meter method of alignment, the secondary trimmer of the ratio detector transformer is screwed all the way out. The primary of the transformer then is aligned for a maximum single and symmetrically peaked i-f curve as shown in Fig. 8-10. The signal generator is then moved back a stage and the next to the last i-f transformer is aligned. The procedure from this point onward follows the pattern of the i-f alignment of the discriminator detector exactly, including the remarks about double-peaked i.f.'s. After the i.f.'s are aligned, the discriminator secondary is adjusted to give the proper S-shaped curve. The output of the signal generator can be placed either at the grid of the last i-f tube or left at the r-f grid of the converter tube.
Another method is to place the oscilloscope in the same position as in the previous alignment and, also, to detune the secondary of the detector transformer. The output of the signal generator is placed at the grid of the last i-f amplifier with the same settings as in all the detector visual alignments. The primary is then tuned for the proper symmetrical single-peaked curve of Fig. 8-10. Then the secondary of the detector transformer is aligned to give a symmetrical S-shaped curve. The ratio detector is now completely aligned. The alignment of the i.f.'s is based in this case not on the picture of the i-f response curves, but rather on the detector output. The signal generator is gradually moved back as in the other i-f alignments and the proper i.f.'s adjusted. The adjustment in each case is for a continued sym metrical and linear S-shaped response curve of maximum amplitude.
A third method involves opening up the hot lead of capacitor C1 in Fig. 8-2, so that the circuit functions as an a-m demodulator. The vertical terminals of the oscilloscope are then placed across load resistor R1 in Fig. 8-2. Some manufacturers specify removal of the first audio tube. If the i.f.'s are all single peaked, the alignment should follow the previous i-f alignment where the i-f transformers are adjusted for a symmetrical single-peaked resonance curve. This includes the detector transformer, too. Care should be taken in tuning over coupled i.f.'s for the double-peaked curve; in some instances it may be advisable to detune the secondary of overcoupled i.f.'s, tune the primary for a single-peaked curve, and then tune the secondary for the symmetrical double-peaked curve. Remember that when aligning the first i-f stage, the final response curve which may take into account overcoupled i.f.'s may not contain any evidence of double peaks due to the effective combination of all the i-f response curves. The over-all i-f curve may contain only a single peak, but it will be a broad response curve.
After this alignment with the signal generator as is, the capacitor C1 of Fig. 8-2 is again attached to the plate of the diode. The vertical terminals of the scope are then placed as indicated by M in Fig. 8-2, or across the output to ground. With these connections made, the oscilloscope should show a symmetrical and linear S-shaped curve, because the detector tube is once again functioning as an FM de modulator.
Oscillator and R-F Alignment of Ratio Detector Receivers
Many manufacturers use a meter method of alignment for these stages, even though the rest of the receiver is aligned visually. Thus, we have the meter and visual method combined. Since an FM signal generator is used, the meter method usually involves placing an output meter across the speaker voice coil. The same adjustments are made as for the r-f and oscillator alignment of the discriminator detector, but in this case the alignment is made for maximum meter reading.
Visually aligning the oscillator and r-f stages is very simple. The adjustments and preliminary settings at the front end of the set re main the same, but the positioning of the oscilloscope may vary. For example, where the time constant capacitor C1 is opened, the oscillator and r-f stages can be aligned for maximum and symmetrical i-f patterns on the oscilloscope, and then the capacitor circuit closed again.
Afterward the detector circuit could be checked. Another method would be to keep the oscilloscope in the M position as shown in Fig. 8-2 or across the audio output and adjust the oscillator and r-f circuits while the secondary of the ratio detector transformer is detuned.
The adjustments are for the proper i-f response curves. Afterward the detector can be aligned.
Still another method would be to connect the oscilloscope as shown by M in Fig. 8-2 and adjust the oscillator and r-f stages after all the other alignments have been made. The adjustment would be for a maximum continued and symmetrical S-shaped response curve from the detector.
Visual Alignment of the Locked-In Oscillator Detector Receiver
The visual alignment of the locked-in oscillator detector receiver is much simpler than the meter method of alignment. Similar to the meter method of alignment, the i.f.'s are aligned first, the detector next, and the oscillator and r-f stages last.
This visual method as carried out on the Philco model 48-482 in the John F. Rider Laboratories is as follows: The high side of the vertical terminal of the oscilloscope is connected between the plate load resistor (R1 in Fig. 8-3) and the quadrature network of the locked-in oscillator detector. The vertical ground terminal of the oscilloscope is connected to the chassis of the receiver. It is across resistor R, that the audio frequency variations appear. For the i-f alignment the oscillator grid, pin 2, of the FM 1000 detector tube is grounded, making the oscillator section inoperative. The output of the FM signal generator is set at the i.f. of 9.1 mhz with a wide deviation and then placed on the grid of the last i-f tube, and the last i-f transformer is aligned for a single-peaked maximum and symmetrical response on the oscilloscope screen. The rest of the i.f.'s are similarly aligned with the signal generator being moved back and placed at the grid of the pre ceding i-f amplifier. The oscilloscope remains where it is across resistor Rs.
After the i.f.'s are aligned, the ground is removed from the oscillator grid. A short is placed across the quadrature network, and the signal generator connection remains as in the last step. The output of the signal generator is set at 9.1 mhz, unmodulated. The oscilloscope remains where it is. The oscillator trimmer Cs in Fig. 8-3 is then adjusted for a zero beat, as indicated by a minimum signal on the oscilloscope and in the loudspeaker.
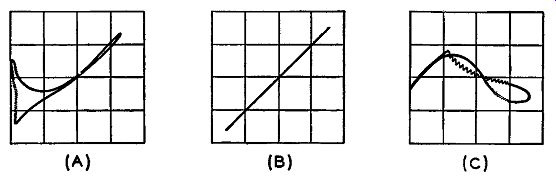
Fig. 8-12. Oscilloscope patterns of response curves obtained in the
visual alignment of a locked-in oscillator detector: (A) when the quadrature
circuit is misaligned; (B) correctly aligned; (C) when the quadrature
circuit and the last i-f transformer secondary are both misaligned.
After the oscillator alignment, the short across the quadrature circuit is removed for alignment of this section, but the signal generator and oscilloscope remain where they are. The signal generator is frequency modulated at a center frequency of 9.1 mhz, with a peak deviation of 100 khz. The quadrature coil L3 (see Fig. 8-3) is then adjusted for linear detector response on the oscilloscope screen (Fig. 8-12B). A typical response curve when the quadrature circuit is misaligned is illustrated in Fig. 8-12 (A) under 100- khz peak deviation. The mis aligned response curve shown at Fig. 8-12 (C) is taken at the detector output when the quadrature network and the secondary of the last i-f transformer are both misaligned. This latter misalignment is also under the condition of 100- khz peak deviation.
The alignment of the locked-in oscillator detector by the fore going method gives good results, because the detector output is quite linear over more than the minimum required deviation range. This is shown by the detector curve of Fig, 8-12 (B).
To align the front, high-frequency oscillator and r-f section visually, the FM signal generator is connected to the antenna input terminals, and the oscilloscope remains where it is. The signal generator and receiver dial are first set at the same frequency on the high end of the band for the capacitor trimmer adjustments, and then at the low end for the coil adjustments. The signal of the generator is frequency modulated at the desired receiver dial setting and with a wide enough deviation to give a good picture of the over-all bandpass characteristic. The oscillator and r-f stages can then be aligned in the proper order for maximum linear detector response on the oscilloscope.
An alternate method to observing the linear response of the detector would be to align these stages for a maximum and symmetrical response of the i-f stages. To do this the grid of the oscillator section of the FM 1000 tube has to be grounded.
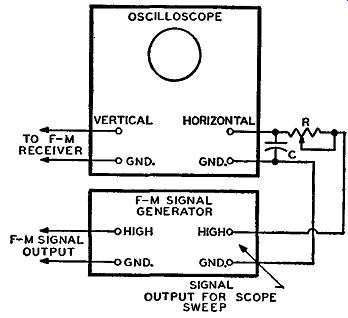
Fig. 8-13. To obtain phase shift at the input to the horizontal plates
of an oscilloscope, an RC circuit can be inserted as shown. The resistance
R may be 1 meg ohm and C equal to 0.001 µf or R may equal 0.5 megohm
and C equal 0.0025 µf.
Phase Control in Visual Alignment
There may be some difference in phase between the modulating signal of the FM signal generator and that applied to the horizontal deflection plates of the oscilloscope, in which case two traces [for example see Fig. 8-4 (B)] of the pattern may be seen where only one is desired. Some FM signal generators are equipped with an internal phase shifting network capable of making one picture out of the double trace. It is also possible, when sine wave modulation is employed, for a simple RC network to be used at the input to the horizontal axis of the oscillator for the purpose of phase shifting. Fig. 8-13 illustrates how the connections should be made. In this diagram, the capacitor C is connected across the horizontal terminals of the oscilloscope, and the resistor is connected in series with the hot lead to the horizontal terminals. To be able to vary the phase shift, the resistor is made variable. The ground lead of the horizontal terminals of the oscilloscope is connected to the ground lead of the sweep output signal terminal of the FM signal generator. The hot lead of the horizontal terminals of the oscilloscope is connected to the high side of the signal generator through R as shown in Fig. 8-13.
The exact values of R and C are not always the same, for due to the amount of phase shift required, they may vary. Sometimes a potentiometer of about 1 megohm is chosen for R and a 0.001 uF capacitor for C. At other times R may be 0.5 megohm and C about 0.0025 µf. If one set of values does not give the proper phase shift, another should be tried although the foregoing two sets of values usually give good results. If this connection does not produce the correct direction of phase shift, the Rand C should be interchanged,
The Use of Marker Frequencies
It is often valuable, when employing visual alignment, to be able to identify the frequency deviation limits on a particular S pattern or the location of other frequency points on the oscilloscope pattern being observed. Employing an unmodulated external signal makes this possible. This signal, after proper frequency adjustment, will show up the desired points on the oscilloscope pattern. This external signal is known as a marker frequency, and it follows that the points indicated by the marker frequency are called marker points. It is important that neither oscillator affect the output frequency of the other.
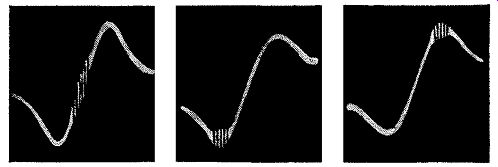
Figs. 8-14, 8-15, 8-16, left to right. The marker frequency is indicated
by the break in the detector S curve at its center in Fig. 8-14 and at
either the lower or upper frequency limits of the linear portion of the
curves in Figs. 8-15 and 8-16.
Two methods are available by which these marker points can be produced. One method is to use an FM signal generator that produces its marker frequencies within the unit. Usually only two fundamental marker frequencies are produced by the generator, but their harmonics are strong enough so that they also can be used as marker frequencies. Such a system has two main disadvantages. One is that it is not possible to produce a frequency that occurs between the harmonics of the marker frequencies produced by the generator. The other is that, even though one marker point is desired, a number of marker frequencies may appear on the oscilloscope pattern under test because of the spacing of harmonics of the marker frequency generator.
The marker frequency may produce either a wiggle or a small break in the pattern being observed. The marker which shows up depends upon the signal generator used. When the marker frequency is produced by the FM signal generator, then the frequency is injected together with the FM signal into the part of the circuit under test.
The other method of obtaining a marker frequency is to use a separate signal generator with an unmodulated output. This separate generator or oscillator should be capable of producing the FM band of frequencies and also the i.f. of FM receivers as fundamentals. When such an external generator is used, the marker frequencies may be inserted at a number of different points. One convenient method is to place the output of this external generator in parallel with the output of the FM signal generator, provided there is no interaction.
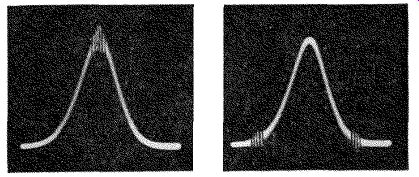
Figs. 8-17, left, 8 18.
In Fig. 8-17 the marker frequency identifies the peak of the response curve of an i-f transformer and the other curve shows the marker frequencies identifying the upper and lower limits.
Marker frequencies can establish the frequency range over which the output of the FM detector is linear, or spot frequency locations upon typical resonance curves. These applications are illustrated in Figs. 8-14 to 8-18, which are retouched photographs of oscilloscope patterns taken while marker frequencies were being used to establish certain points. An auxiliary generator was used for these pictures. In Fig. 8-14, the marker frequency is shown at the center point in the S FM detector characteristic. In Figs. 8-15 and 8-16, the marker frequency establishes either the lower or the upper frequency limits of the linear portion of the FM detector curves. With a known i.f. and a known marker frequency, it is easy to determine which is the upper limit and which the lower by examining the picture on the oscilloscope. The markers will fall either above or below the center i.f., thus indicating which is the upper limit and which the lower. In Fig. 8-17, the marker frequency identifies the peak of the response curve, and in Fig. 8-18, the marker frequencies identify the two limits of the response curve.
The accuracy of such marker indications depends on the accuracy of the calibration of the auxiliary generator or the marker frequency of the FM signal generator, whichever is being used. The advantage of the auxiliary generator is that it can be made variable over quite a large frequency range. However, its frequency range should be sufficiently extensive to provide fundamental frequencies rather than harmonics. As mentioned, harmonics can be used, but much confusion can be avoided and more rapid operation secured by operating on the fundamentals. One precaution which must be exercised is control of the output level of the marker-frequency signal. Excessive output will interfere with the response curve or detector characteristic developed upon the oscilloscope screen. Just enough signal is required to see the wiggle representing a beat, upon the oscillograph image. The point upon the pattern where the wiggle appears corresponds in frequency to the setting of the auxiliary generator, assuming that operation is upon the fundamental.
VISUAL AND METER METHOD COMBINED
Visual alignment of FM receivers is especially beneficial in the detector and i-f stages since it is the response of these individual net works which can be seen. For the r-f and oscillator sections of the receiver, some manufacturers continue with the visual alignment, but others suggest using the meter method after the i.f.'s and detector have been visually aligned. This entails a method of alignment which uses both the visual and meter methods. Such types of alignment are not uncommon, but a true method of combining these two alignment procedures would be to use both meters and the oscilloscope for all the stages in conjunction with an FM signal generator. This method re quires the use of a number of instruments which may make the procedure a little expensive and tedious for the average serviceman. But this type alignment is definitely helpful in a factory setup where accuracy is important.
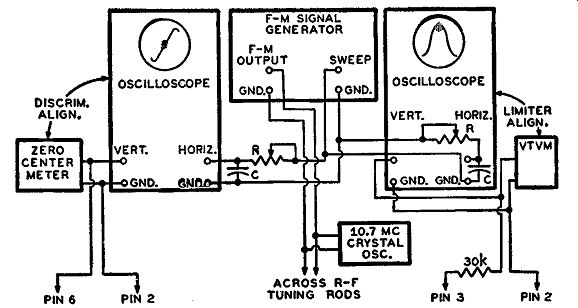
Fig. 8-19. A combining of the meter and visual methods of alignment
for the Edwards Fidelotuner.
In the factory alignment of the Edwards Fidelotuner (See Fig. 7-41) two oscilloscopes and two meters are used to align the detector and i-f stages. This unit employs the limiter-discriminator method of detection. Across the back of the chassis of this FM tuner is a 6-point terminal strip which aids in quick alignment of the set, as well as providing connections to an outside audio amplification unit. The terminal designations are indicated in the schematic of Fig. 7-41. For alignment, the meters and oscilloscopes have a fixed attachment which is clipped to the terminal strip of the chassis, thereby saving time.
One oscilloscope (vertical terminal connection) and a zero center type meter are connected across the discriminator load by having the high sides of their terminals connected to pin 6 and the low side to pin 2 (ground) of the terminal strip. The other oscilloscope (vertical terminals) and a vacuum tube voltmeter are connected across the limiter grid resistor. This is accomplished by connecting the high sides of their terminals through a 30,000-ohm isolation resistor to pin 3 of the chassis terminal strip; the ground side is connected to pin 2. The FM signal generator employed uses sine wave modulation, and a special tap is provided on the generator for this sine wave output. This is the "sweep" terminal of the generator as seen in Fig. 8-19. The sweep terminal and a ground are connected to the horizontal terminals of both oscilloscopes through two RC phase shifting networks, one for each oscilloscope. The FM signal output of the generator is placed across the r-f tuning rods which puts the signal on the r-f grid of the converter tube. Care should be taken to connect the hot lead to the correct rod and the ground lead to the other rod. The frequency set ting of the FM generator is made equal to the i.f., namely 10.7 mhz, and its output kept low enough to prevent limiter saturation. In parallel with the FM signal of 10.7 mhz is the unmodulated output of a fixed crystal oscillator also having a 10.7 -mhz frequency. This latter unit is used as a mar er frequency generator to determine the peak of the i-f response curves (the i-f transformers are all under critical coupling) and the center point of the discriminator S characteristic.
This is indicated by the pictures on the oscilloscopes of Fig. 8-19.
With these connections made, certain pictures will appear on the screens of the oscilloscopes. The location of the marker point will indicate how much the i.f.'s and discriminator are out of alignment.
The i.f.'s are aligned first, starting with the last and working backward to the first. In each alignment, the vacuum-tube voltmeter (VTVM) should indicate a maximum reading, and at the same time a maximum and symmetrical response curve should appear on the oscilloscope which is in parallel with the vacuum-tube voltmeter. The location of the marker point will indicate the degree of symmetry. The discriminator transformer is aligned next, starting with the primary and aligning for linearity on the oscilloscope and a minimum reading on the zero-center meter. Then the secondary is aligned for a sym metrical pattern on the oscilloscope on either side of the marker point and simultaneously for a zero reading on the zero-center meter.
QUESTIONS
SECTION 8
8-1. What stage of the FM receiver makes alignment of this receiver so much different from that of an a-m receiver?
8-2. Is the meter or visual method the quicker and more accurate method of alignment?
8-3. What two pieces of equipment are generally needed for the meter method of alignment? Describe the essential features of the necessary equipment.
8-4. In the meter method of alignment of the discriminator detector circuit, such as that indicated in Fig. 8-1:
a. Which adjustment controls the linearity of the response and which controls the symmetry of the response?
b. In aligning the primary of the discriminator transformer, where should the meter be placed? What indication will denote correct alignment of this primary?
c. In aligning the secondary of the discriminator transformer, where should the meter be placed? What indication will denote correct alignment of this secondary?
8- 5. a. Which stages of an FM receiver (employing the limiter-discriminator method of detection) use the grid circuit of the limiter tube as a basis for the meter method of alignment?
b. What factor in the functioning of the limiter stage enables the use of the grid circuit of the limiter tube as a basis for alignment?
8-6. a. If a microammeter is used as the indicating device in the limiter grid circuit where should it be placed? Give your answer with regard to the proper polarity connections.
b. If a voltmeter is used as an indicating device in the limiter grid circuit, where should it be placed if there is only one grid resistor present? Can any type of voltmeter be used? Explain.
c. Is the primary of the last i-f transformer tuned to a maximum, minimum, or zero indication on the ammeter or voltmeter in the limiter grid circuit? To what is the secondary of this last i-f transformer tuned?
8-7. a. To what frequency should the signal generator be tuned when aligning the limiter stage? The discriminator detector stage? The i-f stages?
b. Is there any requirement as to the amount of output from the signal generator in aligning the discriminator, limiter, and i-f stages? If so, what is this requirement?
8-8. a. Why is it difficult to align overcoupled i-f stages by the same meter method as used for under-coupled i-f stages?
b. What is done to an overcoupled stage so that it can be aligned by the same method as an under-coupled stage? Explain how this changes the response of the overcoupled stage.
8-9. In aligning the different stages of an FM receiver it is best to place the signal generator at the grid input to the tube preceding the transformer to be aligned. However, sometimes not enough signal output is obtained from the signal generator to produce an appreciable reading on the meter. Under this circumstance, where is the signal generator placed?
8-10. In a ratio detector circuit which is to be aligned: When tuning the primary of a ratio detector transformer where is the VTVM placed and what indicates proper alignment?
b. Where is the VTVM placed and what indicates proper alignment for the secondary of the ratio detector transformer? Give a complete explanation as to the placement of the VTVM in accordance with the type of load in the output of the ratio detector circuit.
8-11. When the secondary of the ratio detector transformer is detuned and the signal generator tuned to the i.f. (unmodulated) of the set,
a. Where is the VTVM placed in aligning the primary of this ratio detector transformer and how is proper alignment indicated?
b. What is the position of the meter when the i-f stages and ratio detector transformer secondary are aligned?
c. What indicates proper alignment for the i-f stages? For the ratio detector transformer secondary?
8-12. In the meter method of aligning the i-f stages of the Philco receiver employing the locked-in oscillator detector, an a-m IF signal can be used and the indicating meter placed across the voice coil of the speaker. What is done to this detector circuit to make this possible since the locked-in oscillator detector responds only to an FM signal?
8-13. When is the quadrature circuit of the locked-in oscillator detector shorted?
8-14. a. In visual alignment why is it necessary to use the signal that frequency modulates the carrier in the FM signal generator as the sweep for the oscilloscope?
8-15.
8-16.
8-17.
8-18.
b. To what terminals of the oscilloscope is this modulating signal normally applied? Assume a sine wave frequency modulating a carrier and that the resultant FM signal is used as the input to a correctly aligned FM receiver employing the limiter-discriminator method of detection.
If the same modulating signal is fed to the horizontal terminals of an oscilloscope and the vertical terminals of the oscilloscope are connected across the complete discriminator load, what would be the shape of the pattern that appears on the screen of the oscilloscope? What causes the bends which appear at the two extreme ends of the discriminator characteristic? What must the ratio be between the saw-tooth sweep frequency of an oscilloscope and the frequency of the modulating signal from a wobbulator in order that a double S-shaped discriminator characteristic curve be traced out on the oscilloscope? In visually aligning the i-f stages and detectors of an FM receiver, is it ever advisable to use an FM signal With a frequency deviation greater than 200 khz? Why?
8-19. a. In aligning the i-f stages of an FM receiver employing the limiter discriminator, where should the vertical terminals of the oscilloscope be placed?
b. What is the correct pattern for proper alignment of these i-f stages when they all are under-coupled?
8-20. In visual alignment of FM receivers employing the ratio detector (containing all single-peaked i-f stages) if it is suggested that the secondary of the ratio detector transformer be completely mis tuned, then:
a. Where are the vertical terminals of the oscilloscope usually connected?
b. When the primary of the ratio detector transformer is properly aligned, what is the pattern seen on the oscilloscope?
c. If the secondary of the ratio detector transformer is aligned after the primary, what will the correct alignment pattern be?
d. If the i-f stages are aligned next, what will the correct alignment pattern before each i-f stage?
8-21. For visual alignment of an FM receiver employing the locked-in oscillator detector:
a. Where are the vertical terminals of the oscilloscope connected?
b. What must be done to the detector circuit for the proper alignment of the i-f stages?
c. Is any part of the locked-in oscillator circuit shorted in aligning the quadrature coil?
8-22. In a visual alignment system, what can be done to correct "double" images, similar to that shown in Fig. 8-4 (B), which are caused by phase shift?
8-23. a. What is the purpose of a marker signal? b. How does the marker frequency affect the curve being observed?
8-24. In the factory alignment of the Edwards Fidelotuner, when the set is completely aligned:
a. What should the VTVM in the limiter grid circuit read when the i-f response appearing on the oscilloscope, which is also placed in the limiter grid circuit, is a maximum and symmetrical?
b. What should the meter across the discriminator load read when, after proper alignment, the correct S-shaped discriminator characteristic appears on the oscilloscope which is also connected across the complete discriminator load?