A hi-fi mono or stereo audio system is basically divided into a preamplifier and a power-amplifier section. When stereo reproduction is provided, two separate audio channels are utilized, as exemplified in Fig. 5-1. If a mono program is being reproduced by the stereo system, both audio channels are driven by the same signal. The power rating or output power of the system in Fig. 5-1 is 20 watts. This means that the amplifier is normally capable of delivering 20 watts of audio-frequency power to the speakers without exceeding the manufacturer's distortion rating (such as 0.5 percent). Preamplifiers have two major functions: to increase a low-level audio signal to a value of about 1 volt rms, and to provide any equalization that may be required to obtain a flat frequency characteristic. Power amplifiers have one major function: to increase the power level of a 1-volt input signal to the rated power output of the amplifier without introducing objection able distortion.
Common trouble symptoms caused by defects m the preamplifier or power-amplifier sections are:
1. Dead amplifier.
2. Weak output.
3. Distortion at all levels.
4. Distortion at high level only
5. Noise and/or hum
6. Poor balance
7. Crosstalk
GENERAL DISCUSSION
Most hi-fi audio amplifiers use transistors, al though many tube-type amplifiers are still in use.
Solid-state amplifiers are often designed on a transistor-for-tube basis, although power amplifiers may exploit the unique characteristics of transistors to a greater degree than preamplifiers. Since an fm/am tuner or a multiplex adapter has a much higher output level than a phono cartridge or a tape head, less amplification is employed when the audio system is energized from the tuner, as seen in Fig. 5-2. Phono or tape-head signals are fed to the first stage. An equalization circuit is included for processing the output from a ceramic phono cartridge.
Negative feedback is widely used in audio systems; a feedback loop in Fig. 5-2 is included between the high-level driver and the first preamp to provide equalization for tape-head and magnetic-cartridge inputs. The other three equalization networks provide overall low-frequency compensation, high-frequency tape-head compensation, and phono-input compensation. Tuner and auxiliary-input signals are fed directly to the high-level driver. The high-level driver operates as an emitter-follower; its low-impedance output signal is fed to the tone-control amplifier through the volume control. Note that feedback-type tone-control networks are employed in this example.
Stereo-separation and balance controls are provided in Fig. 5-2. The separation control is in the emitter circuit of the high-level driver. As the separation control is advanced, progressively greater mixing of the signals takes place between the left and right channels, and this blending effect can be used to eliminate the "ping-pong" effect in some stereo program material. The balance potentiometer, in the output of the tone-control amplifier, is a linear control with equal resistances from its mid-position to ground-so no loss is inserted into either channel.
As the control is rotated, more resistance is inserted into one channel and less into the other; in this way, right- and left-channel signal levels can be adjusted to obtain the proper volume relationship.
A typical solid-state preamplifier circuit is shown in Fig. 5-3. This configuration normally provides an output level of 1 volt rms with less than 0.3 percent harmonic distortion. Frequency-selective negative feedback is employed from the collector of Q2 to the emitter of Q1. The first two stages of this circuit have a feedback bias arrangement with bias current supplied to the base of Q1 from the emitter branch of Q2. Thus, the bias on Q1 is directly proportional to the emitter current of Q2; if Q2 tends to draw more current, Q1 will draw less current in turn.
Thus, the operating point of the direct-coupled arrangement is stabilized both with respect to component tolerances and temperature variations. Note that the 5-k level control in the emitter circuit of Q3 serves to stabilize this stage.
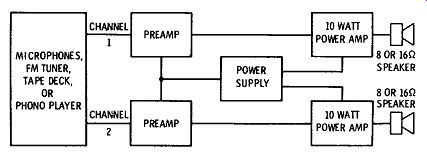
Fig. 5-1. Plan of hi-fi stereo audio system.
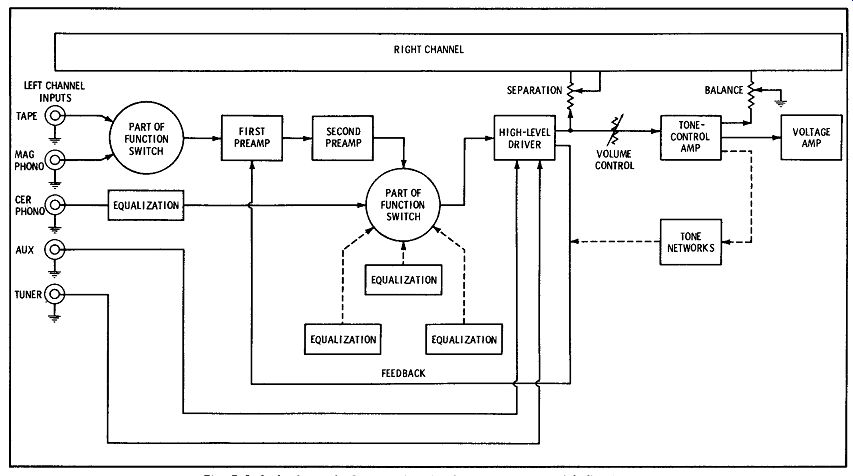
Fig. 5-2. Left channel of a transistorized stereo preamp with five inputs.
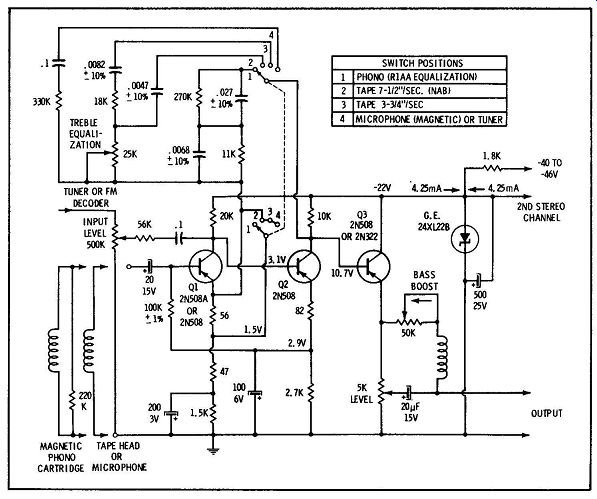
Fig. 5-3. Typical solid-state preamplifier circuit.
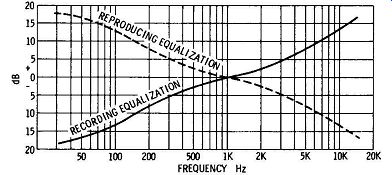
Fig. 5-4. Standard RIAA recording and playback equalization curves for
disc recordings.
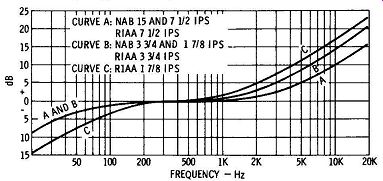
Fig. 5-5. Standard playback equalization curves in use for various tape
speeds.
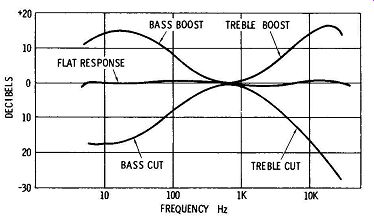
Fig. 5-6. Response curve for boss and treble tone controls.
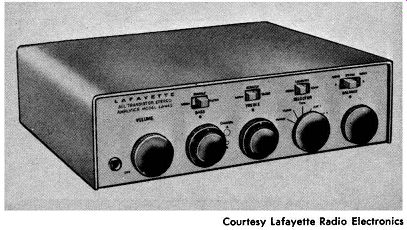
Fig. 5-7. Typical hi-fi stereo amplifier.
Flat frequency response on the phono position of the function switch requires a reproducing frequency-equalization curve as shown in Fig. 5-4. Distortion of an equalization curve is usually caused by an open, leaky, or shorted capacitor. The standard equalization curves for various tape speeds are shown in Fig. 5-5. Equalization responses are fixed.
On the other hand, manual tone controls provide a choice of bass and treble response over a typical range of ±15 dB, as exemplified in Fig. 5-6. A typical hi-fi stereo amplifier is illustrated in Fig. 5-7. This unit provides loudness compensation, a scratch filter, and a rumble filter, in addition to the bass and treble tone controls. Loudness compensation takes the form of about 11 dB bass boost, as shown in Fig. 5-8, and is employed at low settings of the volume control. That is, ear response to bass tones diminishes at low volume levels.
Fig. 5-9 shows the normal frequency-response curve for a scratch filter. This reduced high-frequency response is used when playing worn records that have become noisy. On the other hand, a rumble filter normally provides reduced low-frequency response, as shown in Fig. 5-10. A rumble filter is chiefly useful to attenuate interference caused by motor vibrations in economy-type record players.
Some preamplifiers also provide a presence control that can be switched in or out. As shown in Fig. 5-11, a presence control provides approximately 5 dB of peaking at about 2 kHz. Listeners sometimes prefer to use this mid-range boost when vocal selections are being reproduced.
Modern power amplifiers such as exemplified in Fig. 5-12 generally dispense with transformer coupling in order to obtain good square-wave response.
Direct coupling is used, and the harmonic distortion is normally less than 1 percent at a power output of 7 watts. DC feedback is employed for temperature stabilization of all stages. It stabilizes the voltage division across Q4 and Q5, which operate in a Class-B push-pull arrangement with single-ended output. Q2 and Q3 also operate in Class B with the Darlington configuration to obtain maximum current gain. An npn transistor is used in the Q3 socket, to obtain the required phase inversion for driving Q5.
It also provides push-pull emitter-follower operation from the output of Q1 to the load. Since an emitter follower has 100 percent negative feedback (voltage feedback), it provides low inherent distortion and low output impedance.
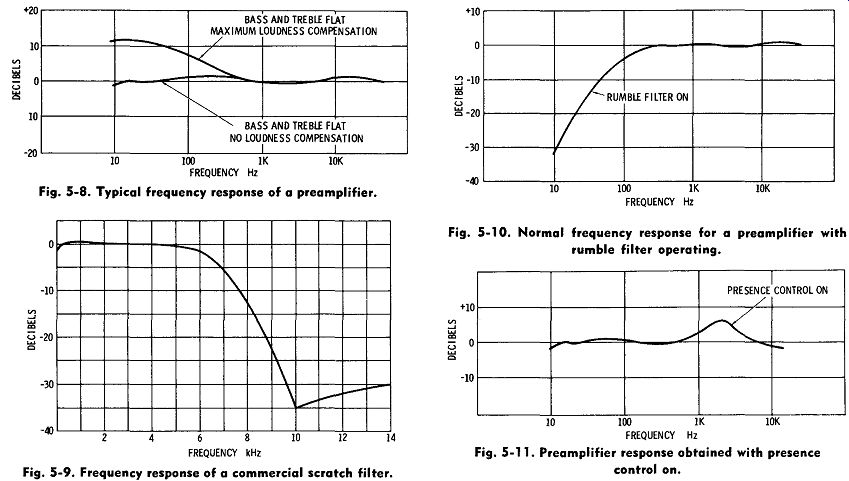
Fig. 5-8. Typical frequency response of a preamplifier.
Fig. 5-9. Frequency response of a commercial scratch filter.
Fig. 5-10. Normal frequency response for a preamplifier with rumble filter operating.
Fig. 5-11. Preamplifier response obtained with presence control on.

Fig. 5-12. Typical 10-watt amplifier circuit.
Transistors Q4 and Q5 in Fig. 5-12 employ a small forward bias of 10 to 20 mA to minimize crossover distortion. This bias is set by the voltage drop across the 390-ohm resistors that shunt the input to Q4 and Q5. Similarly, Q2 and Q3 are biased at about 1 mA to minimize crossover distortion. The voltage drop across silicon diode Xl supplies this bias. Junction diodes have a temperature characteristic similar to that of the emitter-base junction of a transistor.
Therefore, X1 is a Class-A driver with a normal emitter current of about 3 mA. Negative feedback to the base of Q1 lowers its input impedance; resistor R1 limits the minimum value of source impedance.
The value of R3 permits about half of the supply voltage to drop across Q5.
Note that positive feedback is employed in Fig. 5-12; about 11 dB of positive feedback is applied through C3 to R5. This is a bootstrap action which helps to compensate for the dissymmetry of the output circuit, so that the positive-peak signal voltage is essentially the same as the negative-peak voltage.
Note that this positive feedback is offset in the system by about the same amount of negative feedback via R3 to the base of Q1. The net amount of negative feedback is approximately 14 dB, resulting from R12 connecting the output terminal to the input terminal.
In addition, there is local feedback in the emitter follower stages. A 1/2-ampere fuse is placed in the emitter lead of each output transistor for protective fusing of Q4 and Q5; the fuse resistance of about 1 ohm also provides some negative feedback. This local feedback improves bias stability and also holds up the frequency response at the high end of the audio range.
The speaker system in Fig. 5-12 is shunted by 22 ohms in series with 0.22 µF to maintain a reason ably uniform speaker-circuit impedance and to minimize high-frequency phase shift. The output impedance is approximately 1 ohm, which provides good speaker damping, low distortion, and good frequency response, whether an 8-ohm or 16-ohm speaker is used. A 1-volt rms input provides 8 watts output in normal operation. If the amplifier is overloaded, the protective fuses will blow. In music reproduction, a peak-power (music-power) output of 10 watts will not overload the amplifier, because the waveforms are such that a peak power of 10 watts is equivalent to a sine-wave power (rms power) of about 8 watts.
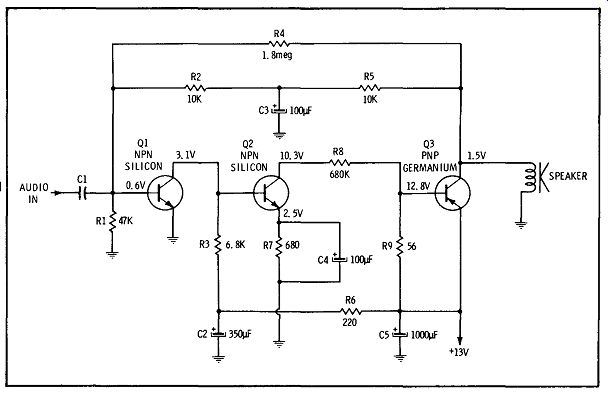
Fig. 5-13. Three-stage direct-coupled configuration.
Test Procedures
Signal-tracing techniques with a scope are generally used to localize a dead stage in an audio system. An audio oscillator may be used to provide a constant-level signal for test. Signal-injection techniques may also be employed, using the speaker as an indicator, and moving the injection point back stage-by-stage. Some technicians use a simple noise generator, or a harmonic oscillator, instead of an audio oscillator. After the dead stage has been localized, DC voltage and resistance tests will usually serve to close in on the defective component. Since audio configurations are often de-coupled, we need to know how interactions between cascaded stages can be analyzed. Basically, interactions are merely applications of Ohm's law. Let us consider the effects of component failures in a typical de-coupled amplifier.
With reference to Fig. 5-13, if C3 short-circuits, the collector voltage on Q1 will increase because the bias voltage on Q1 is decreased, which lowers the collector current through R3 and thereby increases the collector voltage due to less drop across R3. Next, let us suppose that the voltage drop across R7 reads 4.1 volts; we would suspect that the bias on Q1 is low. If the bias on Q1 is low, the bias on Q2 will increase, causing increased current demand and a greater drop across R7. Now, let us suppose that the collector voltage of Q2 reads lower than normal; we would suspect that the bias on Q3 will be higher than normal. That is, if the collector voltage on Q2 is low, it probably means increased current through R8 and increased current through R9, so that the bias on Q3 increases.
Next, let us consider the effect of open capacitors. In case C3 in Fig. 5-13 opens up, the audio signal will not be bypassed and about 30 percent of the audio from the collector of Q3 will feed back to the base of Q1. This is a negative-feedback situation, and the amplifier gain will be drastically reduced. Note that if C4 opens up, there is a considerable loss of gain in the Q2 stage, due to the negative feedback introduced by R7. In case C2 opens up, the frequency response becomes distorted, and in case C5 has partially deteriorated, the audio system will squeal due to the positive feedback that occurs. The easiest way to check a suspected open capacitor is to bridge it with a known good capacitor to see if the trouble symptom disappears.
Let us consider the symptoms of transistor failure in Fig. 5-13. In case Q1 develops a collector-emitter short, the collector becomes grounded and the collector voltage is zero. In turn, the base of Q2 becomes zero. This cuts off Q2 and its collector current falls to zero; therefore, there is no voltage drop across R8 or R9. In turn, Q3 is cut off. In summary, all three transistors are cut off in case of a collector emitter short in Q1. Next, let us suppose than an open occurs in Q2; with zero collector current, there is no current demand and no forward bias on Q3.
Consequently, Q3 is cut off. Again, let us suppose that Q1 opens; its collector voltage will go more positive, and the base voltage on Q2 goes more positive. In turn, Q2 draws more current, which increases the voltage drop across R9 and causes Q3 to draw more current. Since Q1 is open, the feed back to the base of Q1 is defeated. However, R7 and R8 act to limit the current flow and thereby prevent transistor burnout. Note also that R7 and R8 limit the current flow in case Q2 becomes short-circuited.
Now, let us consider a very useful trick of the trade that is sometimes overlooked by the technician apprentice. Fig. 5-14 shows the plan of a basic stereo amplifier. In the event that a trouble symptom develops in Channel 2, for example, we can verify all of the Channel 2 waveforms and voltages by comparison with the corresponding waveforms and voltages in Channel 1. This can be of consider able assistance, especially when working with a modern and somewhat unconventional configuration such as that shown in Fig. 5-12. A common complaint in stereo reproduction is weak or low volume on one channel, even with the balance control set to one end of its range. Experienced technicians will first suspect a defective power transistor. Open or deteriorated electrolytic capacitors are also common of fenders. A high-power transistor tends to have shorter life than a low-power transistor, because high-power operation requires corresponding heat dissipation and a peak output that approaches maximum rated output for the transistor.
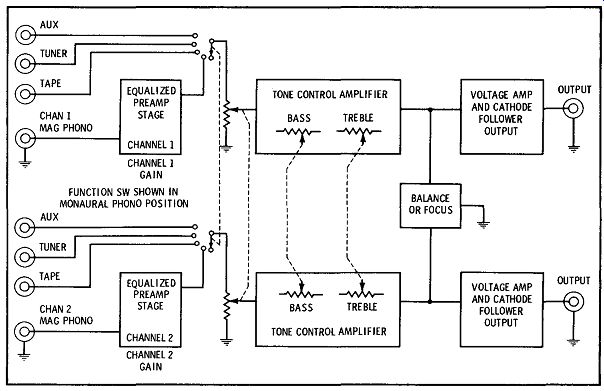
Fig. 5-14. Block diagram of a basic stereo amplifier.
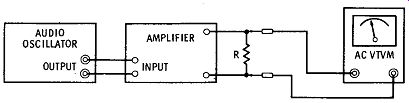
Fig. 5-15. Test setup for measuring power output.
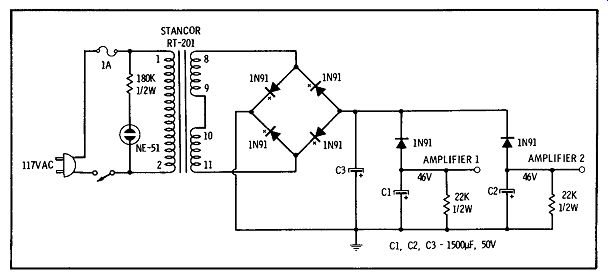
Fig. 5-19. Power supply for a stereo system.
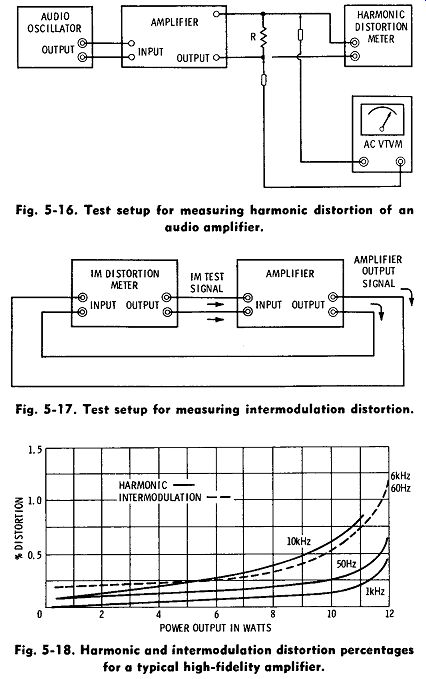
Fig. 5-16. Test setup for measuring harmonic distortion of an audio amplifier.
Fig. 5-17. Test setup for measuring intermodulation distortion.
Fig. 5-18. Harmonic and intermodulation distortion percentages for a typical high-fidelity amplifier.
Whenever an amplifier is tested on the bench, it must be properly loaded to obtain normal operation, and also to prevent possible damage to the output transistors. Fig. 5-15 shows the basic test setup.
Resistor R is a suitable power type, and has a value equal to the rated load impedance for the amplifier.
Since the audio oscillator provides a sine waveform, the power output is calculated by reading the rms value of output voltage and using the formula: where, P is the power in watts, E is the voltage in rms values, R is the resistance in ohms.
Harmonic-distortion measurements are made with the test setup shown in Fig. 5-16. The basic test is made at maximum rated power output, and at a frequency of 1 kHz. However, a more thorough distortion analysis can be made by measuring the percentage of distortion at various other frequencies, such as 50 Hz and 10 kHz. A marginal defect in a feedback network, for example, may show up as excessive harmonic distortion at 50 Hz, whereas the distortion is within rated value at 10 kHz. In a well equipped shop, harmonic-distortion measurements may be supplemented by intermodulation-distortion tests (see Fig. 5-17). An IM distortion meter usually has built-in load resistors, so that the rated load for the amplifier can be switched into the test circuit.
The IM test signal is a two-tone wave, ordinarily 60 Hz and 60 kHz. It provides a somewhat more critical test than a simple harmonic-distortion measurement.
One of the advantages of an IM test is that certain types of distortion, such as clipping, show up more prominently than in an HD test. In any case, the percentage of IM distortion tends to run a bit higher than the percentage of HD, as exemplified in Fig. 5-18. These curves represent normal operation for a typical hi-fi amplifier. We observe that the IM distortion measures consistently higher than the HD unless the HD test frequency is near the upper limit of the audio range. The IM curve crosses over the 10-kHz HD curve at about half rated power output, in this example. Note that both IM distortion and HD increase very rapidly near the maximum rated power output for the amplifier.
To avoid confusion between amplifier defects and power-supply defects, it is good practice to monitor the output of the power supply while making the foregoing tests. In a stereo system, the same power supply is employed for both channels. However, to minimize crosstalk between channels, elaborate designs are often used to obtain a very low internal impedance. For example, the power supply shown in Fig. 5-19 utilizes diode decoupling between the two outputs. This makes the outputs practically independent of each other, within rated limits of current demand. In normal operation, the arrangement in Fig. 5-19 provides about 80 dB of separation between the two audio channels when operating a pair of amplifiers such as those shown in Fig. 5-12. In other words, when one channel is driven to maximum rated power output, the crosstalk into the unenergized channel is normally 80 dB down.
Square-wave testing is a useful analytical procedure, provided the normal square-wave response of the amplifier is known. Manufacturers of hi-fi amplifiers often specify this characteristic. For example, the amplifier shown in Fig. 5-12 normally has the 2-kHz square-wave response illustrated in Fig. 5-20. The rise time of this square wave is less than 2 µ,s, corresponding to a bandwidth of approximately 160 kHz. A related but somewhat more sophisticated transient-response test employs a tone-burst signal, such as that illustrated in Fig. 5-21. This is basically a rectangular waveform on which is superimposed an audio sine wave. Hi-fi manufacturers will often provide specifications for tone-burst response; otherwise, the technician may be able to make a comparative tone-burst test on another amplifier of the same type which is known to be in good operating condition. Similarly, the tone-burst response on one amplifier in a stereo system can be compared with that of the other amplifier.
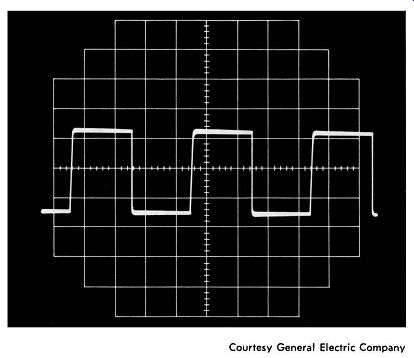
Fig. 5-20. Normal 2-kHz square-wave response for the amplifier in Fig.
5-12.
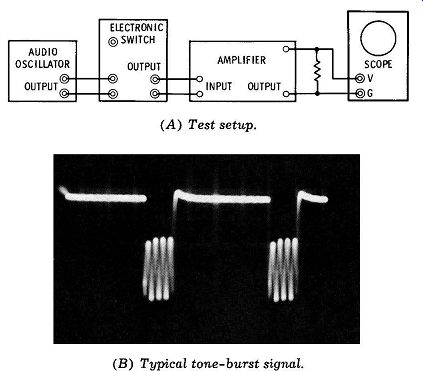
Fig. 5-21. Tone-burst test of an amplifier. (A) Test setup. (B) Typical
tone-burst signal.
Noise can be a problem, particularly in high-gain audio systems. To localize a noisy section or circuit, it is helpful to make step-by-step silencing tests, starting with the output stage. A non-polarized motor-starting capacitor is convenient, because polarity is then inconsequential. Proceed by shunting the base and emitter leads of each transistor in turn with the capacitor, while listening to the noise output from the amplifier. A large shunt capacitance will "kill" the noise, provided that the test is made between the noisy component and the speaker. As soon as you pass the noisy circuit, application of the capacitor has little or no effect. Therefore, you can eliminate all but a few components from suspicion by a simple test. Deteriorating transistors are prime suspects, although resistors can also become noisy unless they are wirewound.
There are two principal sources of hum; power supply trouble is the most usual cause, and stray field pickup is the other frequent offender. In the case of a tube-type amplifier, it is assumed that the tubes have been checked previously for heater cathode leakage. Stray fields are picked up either by capacitive or by inductive coupling. For example, in a transformer-type amplifier, the cores of the inductors (particularly in the preamp section) are generally oriented for minimum hum pickup. In case a universal replacement type is mounted in the same location, it may still be necessary to vary the orientation of the new transformer experimentally to find the position of minimum hum pickup. The original grounding points should also be strictly observed whenever a component is replaced, because circulating ground currents in low-level circuits can produce baffling hum problems.
Hum pickup due to capacitive coupling is encountered in high- or medium-impedance circuits when shielding is poorly grounded or omitted, or if a component defect has greatly increased the input impedance of the circuit. For example, suppose that the coupling capacitor opens up in an emitter-follower circuit. The result can often be much the same as an open coupling capacitor in a conventional vacuum-tube stage. That is, the input impedance increases, and in some circuits the increase is so great that even weak stray fields will drive the amplifier to full output. Localization is a straightforward procedure using conventional signal-tracing tests.
ANALYSIS OF COMMON SYMPTOMS
An analysis of the common trouble symptoms listed earlier in this Section is presented in this section.
1. Dead Amplifier Possible causes of signal stoppage in a preamp or power amplifier are:
a. Defective function switch (see Fig. 5-2).
b. Open coupling capacitor, such as C1 in Fig. 5-13.
c. Blown fuse in emitter circuit of output transistor (see Fig. 5-12).
d. Open or shorted transistor.
e. Shorter zener diode (see Fig. 5-3).
f. Cracked PC board.
g. Shorted capacitor (such as the 500-µF capacitor in Fig. 5-3).
h. Defective input level control (see Fig. 5-3).
Most defects, with the exception of open capacitors, can be pinpointed by means of de-voltage and resistance measurements; an open capacitor can be located with either signal-tracing or signal-injection tests. Voltage measurements at transistor terminals can be supplemented by checking with an in-circuit transistor tester. "Turn-on" and "turn-off" transistor tests are also helpful; a "turn-off" test is most in formative in doubtful situations.
2. Weak Output
Possible causes of weak output in an audio amplifier are as follows:
a. Open or dried-out electrolytic capacitor, such as C3 in Fig. 5-13.
b. Transistor with substantial collector leakage.
c. Low supply voltage.
d. Leaky coupling capacitor that upsets the base bias voltage.
e. Off-value resistor (less likely than other defects).
The normal stage gains are generally unknown; however, the experienced technician can usually "size up" a circuit and make a reasonable estimate of the normal gain. In the case of a stereo amplifier, the signal amplitudes can be compared between corresponding points in the two channels. Comparison tests can also be made with a preamplifier, if a similar model in good working condition is available.
3. Distortion at All Levels Possible causes of distortion at both high and low levels are:
a. Leaky coupling capacitor, as exemplified in Fig. 5-22.
b. Defective transistor.
c. Burned resistor in output stage, as exemplified in Fig. 5-23.
d. Shorted capacitor, such as C3 in Fig. 5-13.
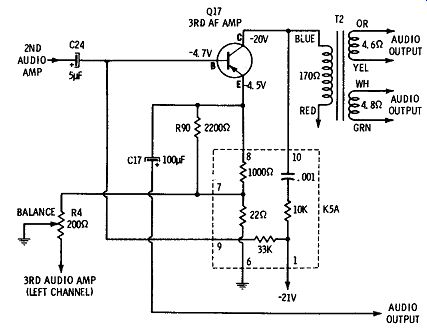
Fig. 5-22. Leaky coupling capacitor C24 causes distortion in the right
channel.
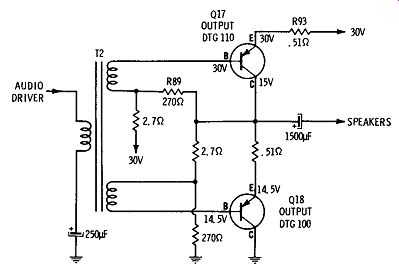
Fig. 5-23. Shorted transistor and burned resistors (R89 and R93) can cause
extreme distortion and low volume.
e. Blown emitter fuse in one side of a push-pull circuit.
f. Cracked PC board causing an open feedback loop, or an open circuit in a push-pull stage.
4. Distortion at High Levels Only Possible causes of distortion at high levels only are as follows:
a. Low supply voltage.
b. Leaky emitter bypass capacitor.
c. Transistor with collector leakage.
d. Marginal diode, such as X1 in Fig. 5-12.
e. Off-value bias resistor (less likely than other defects). When distortion occurs at high levels only, we know that some component defect is causing limited power-handling capability. Thus, a defective power supply can reduce the supply voltage and thereby cause compression or clipping at high power levels.
Test methods are dependent on the amount of distortion. If the distortion is substantial, a scope can be used to localize the defective component. However, if an amplifier has only 1 or 2 percent more distortion than rated at maximum power output, a scope is almost useless, because it is virtually impossible to pick out small percentages of distortion in a sine wave display. Therefore, we must use an HD meter instead of a scope to signal-trace small amounts of distortion.
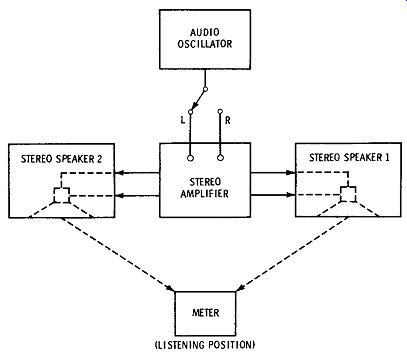
Fig. 5-25. Test setup for checking stereo-amplifier balance.
5. Noise and/or Hum
Possible causes of noise and/ or hum in an audio system are:
a. Defective transistor.
b. Intermittent capacitor, as exemplified in Fig. 5-24.
c. Defective power supply ( check ripple with scope).
d. Ungrounded volume or tone control.
e. Open base resistor, or cracked PC board.
6. Poor Balance Possible causes of poor balance in a stereo amplifier are as follows:
a. Defective transistor (balance control out of range).
b. Capacitor with unstable leakage resistance.
c. Worn and noisy balance control.
d. Fluctuating voltage from one side of the power supply.
e. Thermally unstable resistor (less likely than other defects). An accurate test of balance and of the ability of a stereo amplifier to maintain good balance is shown in Fig. 5-25. A sound-level meter is placed midway between the two speakers, and the output from an audio oscillator is applied in turn to the L and R inputs of the amplifier. The balance control is properly adjusted when the sound-level meter reads the same value for either speaker. If the amplifier has good stability it will retain correct balance after an extended period of operation.
7. Crosstalk Possible causes of crosstalk in a stereo amplifier are:
a. Excessive output impedance in power supply.
b. Defective decoupling diode (see Fig. 5-19).
c. Leakage between contacts of function switch.
d. Leakage between conductors of PC board.
e. Microphonic tube in tube-type stereo amplifier.
In nearly all cases, crosstalk is most troublesome when one channel is being driven to maximum rated output, with no input to the other channel. It is advisable to make a scope check of the ripple on the supply lines to both amplifiers, inasmuch as crosstalk is very often caused by coupling through the power supply leads. That is, the defect is usually in the power supply. If the trouble is elsewhere, as in the function switch, or in the PC board, waveform checks with a scope provide a straightforward approach to the trouble location.