These appendices are more academic than the rest of the guide. They are for readers who want a deeper understanding of stereo mic techniques.
You can use those techniques without reading this material. However, if you want to know how stereo works or to develop your own stereo array, it's worthwhile to study the theory and math in this section.
A sound system with good stereo imaging can form apparent sources of sound, such as reproduced musical instruments, in well-defined locations, and usually between a pair of loudspeakers placed in front of the listener. These apparent sound sources are called images.
This section explains terms related to stereo imaging, how we localize real sound sources, how we localize images, and how microphone placement controls image location.
Definitions
First, we'll define several terms related to stereo imaging. Fusion refers to the synthesis of a single apparent source of sound (an image or "phantom image") from two or more real sound sources (such as loudspeakers).
The location of an image is its angular position relative to a point straight ahead of a listener or its position relative to the loudspeakers.
This is shown in FIG. 1. A goal of high fidelity is to reproduce the images in the locations intended by the recording engineer or producer.
In some productions, usually classical music recordings, the goal is to place the images in the same relative locations as the instruments were during the live performance.
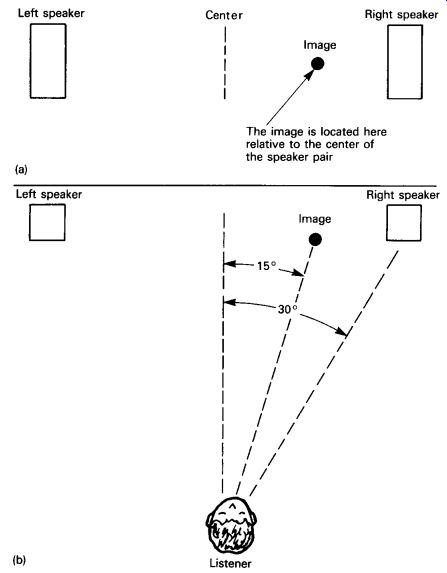
FIG. 1 Example of image location: (a) listener's view and (b) top view.
Stereo spread or stage width (FIG. 2) is the distance between the extreme-left and extreme-right images of a reproduced ensemble of instruments. The stereo spread is wide if the ensemble appears to spread all the way between a pair of loudspeakers. The spread is narrow if the ensemble occupies only a small space between the speakers. Sometimes the reproduced reverberation or ambience spreads from speaker to speaker even when the reproduced ensemble width is narrow. Play CD tracks 14 and 17 to hear accurate stereo imaging with a wide spread. Play CD tracks 9 and 10 to hear a narrow stereo spread.
Image focus or size (FIG. 3) refers to the degree of fusion of an image, its positional definition. A sharply focused image is described as being pinpointed, precise, narrow, sharp, resolved, well defined, or easy to localize. A poorly focused image is hard to localize, spread, broad, smeared, vague, and diffuse. A natural image is focused to the same degree as the real instrument being reproduced. Play CD track 17 to hear sharply focused images and play CD track 22 to hear poorly focused images.
Depth is the apparent distance of an image from a listener, the sense of closeness and distance of various instruments. Play CD track 25 to hear how miking distance affects the sense of depth.
Elevation refers to an image position above the line between the speakers.
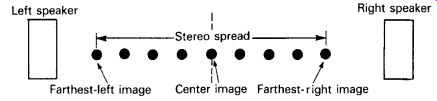
FIG. 2 Stereo spread or stage width.
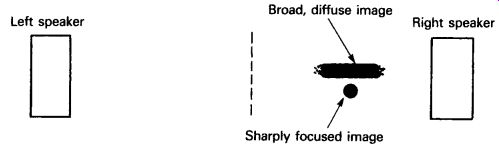
FIG. 3 Image focus or size (listener's perception).
Image movement is a reproduction of the movement of the sound source, if any. The image should not move unaccountably.
Localization is the ability of a listener to tell the direction of a sound.
It is also the relation between interchannel or interaural differences and perceived image location. ("Interaural differences" means "differences between signals at the two ears.")
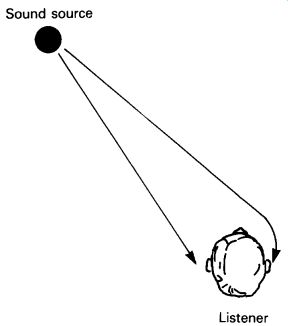
FIG. 4 Sound traveling from a source to a listener's ears.
How We Localize Real Sound Sources
The human hearing system uses the direct sound and early reflections to localize a sound source. The direct sound and reflections within about 2 milliseconds contribute to localization (Wallach et al., 1973; Bartlett, 1979).
Reflections occurring up to 5-35 milliseconds after the direct sound influence image broadening ( Gardner, 1973). Distance or depth cues are conveyed by early reflections (less than 33 milliseconds after the direct sound).
Echoes delayed more than about 5-50 milliseconds (depending on program material) do not fuse in time with the early sound but contribute to the perceived tonal balance (Carterette and Friedman, 1978, pp. 62, 210).
Imagine a sound source and a listener. Let's say that the source is in front of the listener and to the left of center (as in FIG. 4). Sound travels a longer distance to the right ear than to the left ear, so the sound arrives at the right ear after it arrives at the left ear. In other words, the right-ear signal is delayed relative to the left-ear signal. Every source location produces a unique arrival-time difference between ears (Vanderlyn, 1979).
In addition, the head acts as an obstacle to sounds above about 1000Hz. High frequencies are shadowed by the head, so a different spectrum (amplitude versus frequency) appears at each ear (Shaw, 1974; Mehrgardt and Mellert, 1977). Every source location produces a unique spectral difference between ears (FIG. 5).
FIG. 5 Frequency response of the ear at different azimuth angles: 0° is straight ahead; 90° is to the side of the ear being measured; and 180° is behind the head (after Mehrgardt and Mellert).
We have learned to associate certain interaural differences with specific directions of the sound source. When presented with a new source location, we match what we hear with a memorized pattern of a similar situation to determine direction (Rumsey, 1989, p. 6).
As stated before, an important localization cue is the interaural arrival time difference of the signal envelope. We perceive this difference at any change in the sound: a transient, a pause, or a change in timbre. For this reason, we localize transients more easily than continuous sounds (Rumsey, 1989, p. 3). The time difference between ear signals can also be considered as a phase difference between sound waves arriving at the ears (FIG. 6). This phase shift rises with frequency.
When sound waves from a real source strike a listener's head, a different spectrum of amplitude and phase appears at each ear. These inter aural differences are translated by the brain into a perceived direction of the sound source. Every direction is associated with a different set of interaural differences.
The ears make use of interaural phase differences to localize sounds between about 100 and 700Hz. Frequencies below about 100Hz are not localized (making "subwoofer/satellite" speaker systems feasible; Harvey and Schroeder, 1961). Above about 1500Hz, amplitude differences between ears contribute to localization. Between about 700 and 1500Hz, both phase and amplitude differences are used to tell the direction of a sound (Eargle, 1976, Sections 2 and 3; Cooper and Bauck, 1980).
Small movements of the head change the arrival-time difference at the ears. The brain uses this information as another cue for source location (Rumsey, 1989, p. 4), especially for distance and front/back discrimination.
The outer ears (pinnae) play a part as well (Gardner and Gardner, 1973). In each pinna, sound reflections from various ridges combine with the direct sound, causing phase cancellations and frequency notches in the perceived spectrum. The positions of the notches in the spectrum vary with the source height. We perceive these notch patterns not as a tonal coloration but as height information. Also, we can discriminate sounds in front from those in back because of the pinnae's shadowing effect at high frequencies.
Some of the cues used by the ears can be omitted without destroying localization accuracy if other cues are still present.
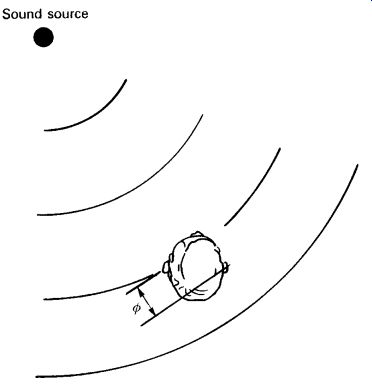
FIG. 6 Phase shift +/- between sound waves at the ears.
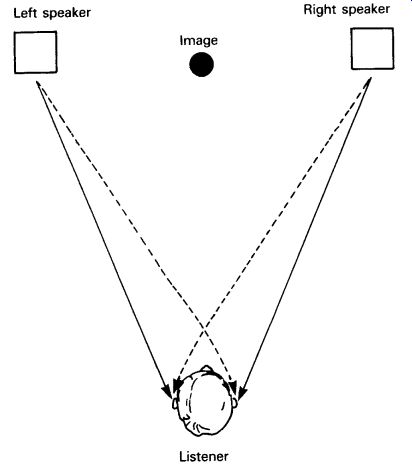
FIG. 7 Two ears receiving signals from two speakers.
How We Localize Images Between Speakers
Now that we've discussed how we localize real sound sources, let's look at how we localize their images reproduced over loudspeakers. Imagine that you're sitting between two stereo speakers, as in FIG. 7. If you feed a musical signal equally to both channels in the same polarity, you'll perceive an image between the two speakers. Normally, you'll hear a single synthetic source, rather than two separate loudspeaker sources. Play CD track 1 to hear a phantom image in the center between your speaker pair.
Each ear hears both speakers. For example, the left ear hears the left speaker signal, then, after a short delay due to the longer travel path, hears the right-speaker signal. At each ear, the signals from both speakers sum or add together vectorially to produce a resultant signal of a certain phase.
Suppose that we make the signal louder in one speaker. That is, we create a level difference between the speakers. Surprisingly, this causes a signal time difference at the ears (Rumsey, 1989, p. 8). This is a result of the phasor addition of both speaker signals at each ear. For example, if the left-speaker signal is louder, the phase delay of the vector sum is higher in the right ear than in the left ear. So the right-ear signal is delayed with respect to the left-ear signal.
Remember to distinguish interchannel differences (between speaker channels) from interaural differences (between ears). An interchannel level difference does not appear as an interaural level difference, but rather as an interaural time difference.
We can use this speaker-generated interaural time difference to place images. Here's how: suppose we want to place an image 15° to one side.
Areal sound source 15° to one side produces an interaural time difference of 0.13 millisecond. If we can make the speakers produce an interaural time difference of 0.13 millisecond, we'll hear the image 15° to one side.
We can fool the hearing system into believing there's a real source at that angle. This occurs when the speakers differ in level by a certain amount.
The polarity of the two channels affects localization as well. To explain polarity, if the signals sent to two speaker channels are in polarity, they are in phase at all frequencies; both go positive in voltage at the same time.
If the signals are out of polarity, they are 180° out of phase at all frequencies. One channel's signal goes positive when the other channel's signal goes negative. Opposite-polarity signals are sometimes incorrectly referred to as being out of phase.
If the signals are in opposite polarity between channels and equal level in both channels, the resulting image has a diffuse, directionless quality and cannot be localized. Play CD track 4 to hear in-polarity and opposite-polarity signals. If the signals are in opposite polarity and higher level in one channel than the other, the image often appears outside the bounds of the speaker pair. You'd hear an image left of the left speaker or right of the right speaker (Eargle, 1976).
Opposite polarity can occur in several ways. Two microphones are of opposite polarity if the wires to connector pins 2 and 3 are reversed in one microphone. Two speakers are of opposite polarity if the speaker-cable leads are reversed at one speaker. A single microphone might have different parts of its polar pattern in opposite polarity. For example, the rear lobe of a bidirectional pattern is opposite in polarity to the front lobe. If sound from a particular direction reaches the front lobe of the left-channel mic and the rear lobe of the right-channel mic, the two channels will be of opposite polarity. The resulting image of that sound source will either be diffuse or outside the speaker pair.
Requirements for Natural Imaging over Loudspeakers
To the extent that a sound recording and reproducing system can duplicate the interaural differences produced by a real source, the resultant image will be accurately localized. In other words, when reproduced sounds reaching a listener's ears have amplitude and phase differences corresponding to those of a real sound source at some particular angle, the listener perceives a well-fused, naturally focused image at that same angle.
Conversely, when unnatural amplitude and phase relations are produced, the image appears relatively diffuse rather than sharp and is harder to localize accurately (Cooper and Bauck, 1980).
The required interaural differences for realistic imaging can be produced by certain interchannel differences. Placing an image in a precise location requires a particular amplitude difference versus frequency and phase difference versus frequency between channels. These have been calculated by Cooper and Bauck (1980) for several image angles. Gerzon (1980), Nakabayashi (1975), and Koshigoe and Takahashi (1976) have calculated the interaural or interchannel differences required to produce any image direction at a single frequency.
FIG. 8, for example, shows the interchannel differences required to place an image at 15° to the left of center when the speakers are placed +/-30° in front of the listener (Cooper and Bauck, 1980).
As FIG. 8 shows, the interchannel differences required for natural imaging vary with frequency. Specifically, Cooper and Bauck (1980) indicate that interchannel amplitude differences are needed below approximately 1700Hz and interchannel time differences are needed above that frequency (Cooper, 1987). Specifically:
• At low frequencies, the amplitude difference needed for a 15° image angle is about 10dB.
• Between 1.7 and 5 kHz, the amplitude difference goes to approximately 0dB. But there still is a phase difference to shift the image off-center.
• Above 1.7 kHz, the phase difference corresponds to a group delay (interchannel time difference) of about 0.547 millisecond, or 7.39 inches for a hypothetical spacing between microphones used for stereo recording.
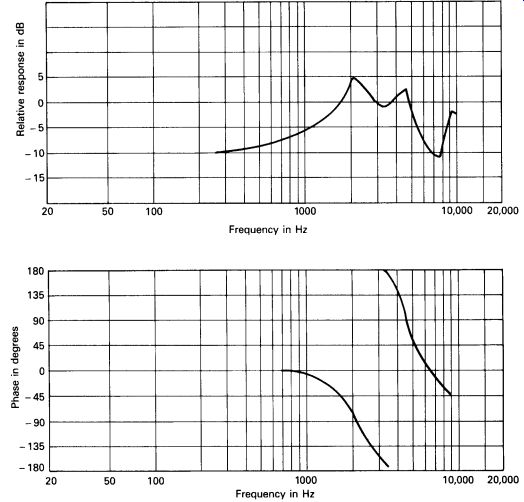
FIG. 8 Amplitude (top) and phase (bottom) of right channel relative to
left channel, for image location 15° to the left of center when speakers are
+/-30° in front of listener.
This theory is based on the "shadowing" of sound traveling around a sphere. The description given here simplifies the complex requirements, but it conveys the basic idea. Cooper (1980) notes that "moderate deviations from these specifications might not lead to noticeable auditory distress or faulty imaging."
The Cooper-Bauck criteria can be met by recording with a dummy head whose signals are specially processed. A dummy head used for binaural recording is a modeled head with a flush-mounted microphone in each ear. Time and spectral differences between channels create the stereo images. (Spectral differences are amplitude differences that vary with frequency.) Although a dummy-head binaural recording can provide excellent imaging over headphones, it produces poor localization over loudspeakers at low frequencies (Huggonet and Jouhaneau, 1987, Figure 13, p. 16) unless spatial equalization (a shuffler circuit) is used (Griesinger, 1989).
Spatial equalization boosts the low frequencies in the difference (L +/- R) signal.
Binaural recording can produce images surrounding a listener wearing headphones but only frontal images over loudspeakers, unless a transaural converter is used. A transaural converter is an electronic device that converts binaural signals (for headphone playback) into stereo signals (for loudspeaker playback). Transaural stereo is a method of surround-sound reproduction using a dummy head for binaural recording, processed electronically to remove head-related crosstalk when the recording is heard over two loudspeakers (Bauer, 1961; Schroeder and Atal, 1963; Damaske, 1971; Eargle, 1976, pp. 122-123; Sakamoto et al., 1978, 1981, 1982; Mori et al., 1979; Cooper and Bauck, 1989; Moller, 1989).
Cooper recommends that, for natural imaging, the speakers' inter channel differences be controlled so that their signals sum at the ears to produce the correct interaural differences. According to Theile (1987), Cooper's theory (based on summing localization) is in error because it applies only to sine waves and may not apply to broadband spectral effects.
He proposes a different theory of localization, the association model. This theory suggests that, when listening to two stereo loudspeakers, we ignore our interaural differences and instead use the speakers' interchannel differences to localize images.
The interchannel differences needed for best stereo, Theile says, are head related. The ideal stereo miking technique would use, perhaps, two ear-spaced microphones flush mounted in a head-size sphere and equalized for flat subjective response. This would produce interchannel spectral and time differences that, Theile claims, are optimum for stereo.
The interchannel differences-time differences at low frequencies and amplitude differences at high frequencies-are the opposite of Cooper's requirements for natural stereo imaging. Time will tell which theory is closer to the truth.
Currently Used Image-Localization Mechanisms
The ear can be fooled into hearing reasonably sharp images between speakers by less sophisticated signal processing. Simple amplitude and/or time differences between channels, constant with frequency, can produce localizable images. Bartlett (1979, pp. 38, 40), Madsen (1957), Dutton (1962), Cabot (1977), Williams (1987), Blauert (1983), and Rumsey (1989) give test results showing image location as a function of interchannel amplitude or time differences. Bartlett's results are shown later in this section.
For example, given a speech signal, if the left channel is 7.5dB louder than the right channel, an image will appear at approximately 15° to the left of center when the speakers are placed +/-30° in front of the listener.
A delay in the right channel of about 0.5 millisecond will accomplish the same thing, although image locations produced solely by time differences are relatively vague and hard to localize.
Griesinger notes that pure interchannel time differences do not localize low-pass-filtered male speech below 500Hz over loudspeakers.
Amplitude (level) differences are needed to localize low-frequency sounds.
Either amplitude or time differences can localize high-frequency sounds (Griesinger, 1987).
With a baffled omni pair, the baffle attenuates or "shadows" high frequencies arriving from the opposite side, so the amplitude difference between mics increases with frequency. The time difference is constant with frequency.
The interchannel differences produced by coincident, near-coincident, and spaced-pair techniques are constant with frequency-just simple approximations of what is required. Still, reasonably sharp images are produced. Let's look at exactly how these differences localize images (Bartlett, 1979).
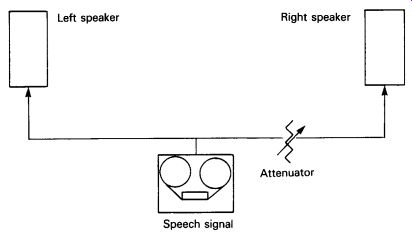
FIG. 9 Sending a speech signal to two stereo loudspeakers with attenuation
in one channel.
Localization by Amplitude Differences
The location of images between two loudspeakers depends in part on the signal amplitude differences between the loudspeakers. Suppose a speech signal is sent to two stereo loudspeakers, with the signal to each speaker identical except for an amplitude (level) difference (as shown in FIG. 9). We create an amplitude difference by inserting an attenuator in one channel.
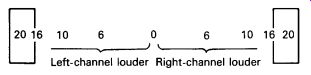
FIG. 10 Stereo-image location versus amplitude difference between channels,
in dB (listener's perception).
FIG. 10 shows the approximate sound-image location between speakers versus the amplitude difference between channels, in decibels.
A 0dB difference (equal level from each speaker) makes the image of the sound source appear in the center, midway between the speakers. Increasing the difference places the image farther away from the center. A difference of 15-20dB makes the image appear at only one speaker. Play CD track 5 to hear a demonstration of image location versus level difference between channels.
The information in this figure is based on carefully controlled listening tests. The data is the average of the responses of 10 trained listeners. They auditioned a pair of signal-aligned, high-quality loudspeakers several feet from the walls in a "typical" listening room, while sitting centered between the speakers at a 60° listening angle. Your own results may vary.
How can we create this effect with a stereo microphone array? Suppose two cardioid microphones are crossed at 90° to each other, with the grille of one microphone directly above the other (FIG. 11). The microphones are angled 45° to the left and right of the center of the orchestra. Sounds arriving from the center of the orchestra will be picked up equally by both microphones. During playback, there will be equal levels from both speakers and, consequently, a center image is produced.
Suppose that the extreme right side of the orchestra is 45° off-center, from the viewpoint of the microphone pair. Sounds arriving from the extreme right side of the orchestra approach the right-aiming microphone on axis, but they will approach the left-aiming microphone at 90° off axis (as shown in FIG. 11). A cardioid polar pattern has a 6dB lower level at 90° off axis than it has on axis. So, the extreme-right sound source will produce a 6dB lower output from the left microphone than from the right microphone.
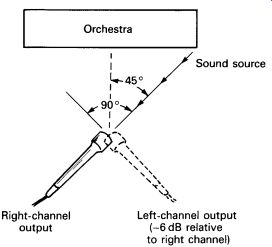
FIG. 11 Cardioids crossed at 90°, picking up a source at one end of an
orchestra.
So we have a 6dB amplitude difference between channels. According to FIG. 10, the image of the extreme-right side of the orchestra will now be reproduced right of center. Instruments in between the center and the right side of the orchestra will be reproduced somewhere between the 0 and 6dB points.
If we angle the microphones farther apart, for example 135°, the difference produced between channels for the same source is around 10dB.
As a result, the right-side stereo image will appear farther to the right than it did with 90° angling. (Note that it is not necessary to aim the micro phones exactly at the left and right sides of the ensemble.)
The farther to one side a sound source is, the greater the amplitude difference between channels it produces and, thus, the farther from center is its reproduced sound image.
Localization by Time Differences
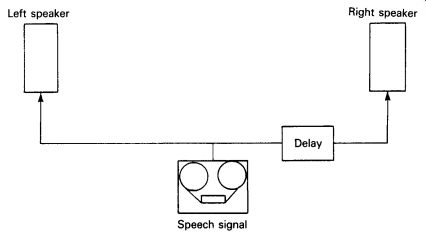
FIG. 12 Sending a speech signal to two speakers with one channel delayed.
Phantom-image location also depends on the signal time differences between channels. Suppose we send the same speech signal to two speakers at equal levels but with one channel delayed (as in FIG. 12).
FIG. 13 shows the approximate sound-image location between speakers, with various time differences between channels, in milliseconds.
A0 millisecond difference (no time difference between speaker channels) makes the image appear in the center. As the time difference increases, the phantom image appears farther off-center. A 1.2-1.5 millisecond difference or delay is sufficient to place the image at only one speaker. Play CD track 6 to hear a demonstration of image location versus time difference between channels.
Spacing two microphones apart horizontally, even by a few inches, produces a time difference between channels for off-center sources. A sound arriving from the right side of the orchestra will reach the right microphone first, simply because it is closer to the sound source (as in FIG. 14). For example, if the sound source is 45° to the right, and the microphones are 8 inches apart, the time difference produced between channels for this source is about 0.4 millisecond. For the same source, a 20-inch spacing between microphones produces a 1.5 millisecond time difference between channels, placing the reproduced sound image at one speaker.
With spaced-pair microphones, the farther a sound source is from the center of the orchestra, the greater the time difference between channels and, thus, the farther from center is its reproduced sound image.
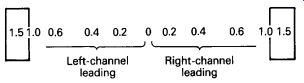
FIG. 13 Approximate image location versus time difference between channels,
in milliseconds (listener's perception).
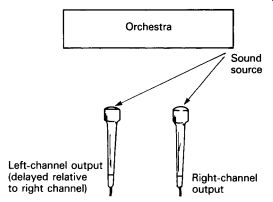
FIG. 14 Microphones spaced apart, picking up a source at one end of an
orchestra.
Localization by Amplitude and Time Differences
Phantom images also can be localized by a combination of amplitude and time differences. Suppose 90° angled cardioid microphones are spaced 8 inches apart (as in FIG. 15). A sound source 45° to the right will produce a 6 dB level difference between channels and a 0.4 millisecond difference between channels. The image shift of the 6 dB level difference adds to the image shift of the 0.4 millisecond difference to place the sound image at the right speaker. Certain other combinations of angling and spacing accomplish the same thing. Play CD track 7 to hear a demonstration of image location versus level and time differences between channels.
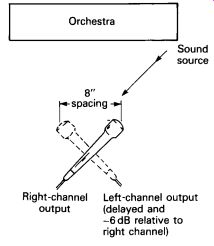
FIG. 15 Cardioids angled 90° and spaced 8 inches, picking up a source
at one end of an orchestra.
Summary
If a speech signal is recorded on two channels, its reproduced sound image will appear at only one speaker if-
• the signal is at least 15-20dB lower in one channel;
• the signal is delayed at least 1.2-1.5 milliseconds in one channel; or
• the signal in one channel is lower in level and delayed by a certain amount.
When amplitude and time differences are combined to place images, the sharpest imaging occurs when the channel that is lower in level is also the channel that is delayed. If the higher level channel is delayed, image confusion results because of the conflicting time and amplitude cues.
We have seen that angling directional microphones (coincident placement) produces amplitude differences between channels. Spacing microphones (spaced-pair placement) produces time differences between channels. Angling and spacing directional microphones (near-coincident placement) produces both amplitude and time differences between channels. These differences localize the reproduced sound image between a pair of loudspeakers.
Predicting Image Locations
Suppose you have a pair of microphones for stereo recording. Given their polar pattern, angling, and spacing, you can predict the interchannel amplitude and time differences for any sound-source angle. Hence, you can predict the localization of any stereo microphone array (in theory).
This prediction assumes that the microphones have ideal polar pat terns, and that these patterns do not vary with frequency. It's an unrealistic assumption, but the prediction agrees well with listening tests.
The amplitude difference between channels in dB is given by
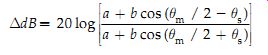
(1)
where
delta dB = amplitude difference between channels, in dB;
a + b cos(theta) = polar equation for the microphone;
Omnidirectional a = 1 b = 0
Bidirectional a = 0 b = 1
Cardioid a = 0.5 b =0.5
Supercardioid a = 0.366 b = 0.634
Hypercardioid a = 0.25 b = 0.75
theta_m = angle between microphone axes, in degrees;
theta_s = source angle (how far off-center the sound source is), in degrees.
These variables are shown in FIG. 16.
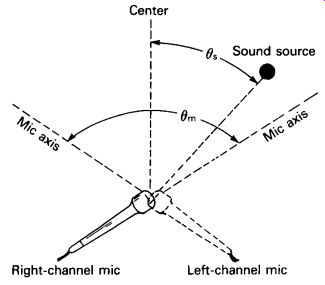
FIG. 16 Microphone angle (theta_m) and source angle (theta_s).
The time difference between channels is given by
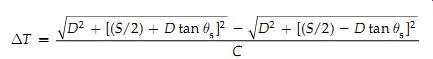
(2)
where
delta_T = time difference between channels, in seconds;
D = distance from the source to the line connecting the micro phones, in feet;
S = spacing between microphones, in feet;
theta_s = source angle (how far off-center the sound source is), in degrees;
C +/- speed of sound (1130 feet per second).
These variables are shown in FIG. 17.
For near-coincident microphone spacing of a few inches, the equation can be simplified to this:
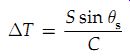
(3)
where
delta_T = time difference between channels, in seconds;
S = microphone spacing, in inches;
theta_s = source angle, in degrees;
C = speed of sound (13,560 inches per second).
These variables are shown in FIG. 18.
Let's consider an example. If you angle two cardioid microphones 135° apart, and the source angle is 60° (as in FIG. 19), the dB difference produced between channels for that source is calculated as follows.
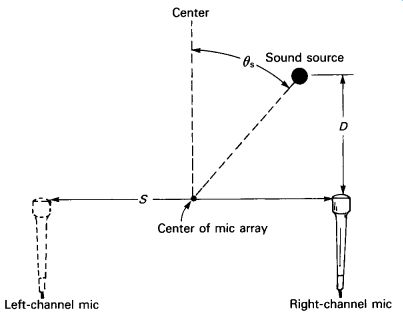
FIG. 17 Source angle (theta_s), mic-to-source distance (D), and mic spacing
(S).
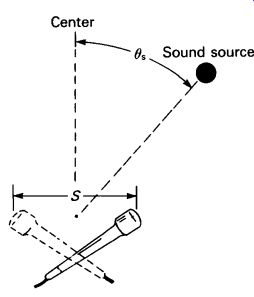
FIG. 18 Mic spacing (S) and source angle ( +/-s).
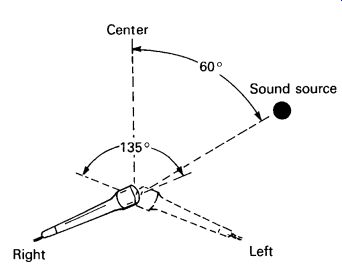
FIG. 19 Cardioids angled 135° apart, with a 60° source angle.
For a cardioid, a =0.5 and b = 0.5 (from the list following equation ( 1)).
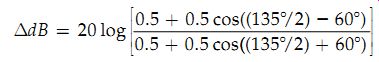
The angle between microphone axes, theta_m, is 135° and the source angle, theta_s, is 60°. That is, the sound source is 60° off-center. So the amplitude difference between channels, using equation ( 1), is
So, according to FIG. 10, that sound source will be reproduced nearly all the way at one speaker.
Here is another example. If you place two omnidirectional micro phones 10 inches apart, and the sound source is 45° off-center, what is the time difference between channels? (Refer to FIG. 20.) Microphone spacing, S, is 10 inches and source angle, theta_s, is 45°. By equation (A-3),

14 dB amplitude difference between channels
So, according to FIG. 10, that sound source will be reproduced about halfway off-center.
Choosing Angling and Spacing
Many combinations of microphone angling and spacing are used to place the images of the ends of the orchestra at the right and the left speaker.
In other words, there are many ways to achieve a full stereo spread. You can use a narrow spacing and a wide angle, or a wide spacing and a narrow angle-whatever works. The particular angle and spacing you use is not sacred. Many do not realize this, and rely on a fixed angle and/or spacing, such as the ORTF (Office de Radiodiffusion Television Française) system (110°, 17 cm or 6.7 in). That is a good place to start, but if the reproduced stage width is too narrow, there's no harm in increasing the angle or spacing slightly.
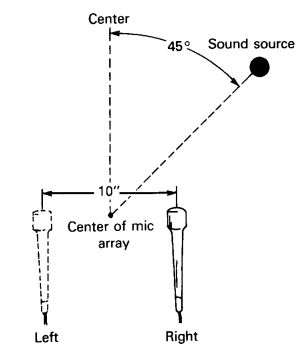
FIG. 20 Omnis spaced 10 inches apart, with a 45° source angle.
If the center instruments are too loud, you can angle the mics farther apart while decreasing the spacing so that the reproduced stage width is unchanged. In this way, you can control the loudness of the center image to improve the balance.
To reduce pickup of early reflections from the stage floor and walls:
(1) increase angling, (2) decrease spacing, and (3) place the mics closer to the ensemble. This works as follows:
1. Angling the mics farther apart softens the center instruments.
2. Decreasing the spacing between mics maintains the original reproduced stage width.
3. Since center instruments are quieter, you can place the mics closer to the ensemble and still achieve a good balance.
4. Since the mics are closer, the ratio of reflected sound to direct sound is decreased. You can add distant mics or artificial reverberation for the desired amount of hall ambience.
In general, a combination of angling and spacing (intensity and time differences) gives more accurate localization and sharper imaging than intensity or time differences alone.
Angling the mics farther apart increases the ratio of reverberation in the recording, which makes the orchestra sound farther away. Spacing the mics farther apart does not change the sense of distance, but it degrades the sharpness of the images.
Spaciousness and Spatial Equalization
The information in this section is from Griesinger's (1987) article, "New Perspectives on Coincident and Semi-coincident Microphone Arrays." The spaciousness of a microphone array is the ratio of L - R energy to L + R energy in the reflected sound. Ideally, this ratio should be equal to or greater than 1. In other words, the sum and difference energy are equal. Spaciousness implies a low correlation between channels of the reflected sound.
Some microphone arrays with good spaciousness (a value of 1) are listed below:
• the spaced pair;
• the Blumlein pair (figure-eight mics crossed at 90°);
• the mid-side (MS) array with a cardioid mid pattern and a 1:1 M/S ratio;
• coincident hypercardioids angled 109° apart.
Spatial equalization or shuffling is a low-frequency shelving boost of difference (L - R) signals, and a complementary low-frequency shelving cut of sum (L + R) signals. This has two benefits:
1. It increases spaciousness, so that coincident and near-coincident arrays can sound as spacious as spaced arrays.
2. It aligns the low- and high-frequency components of the sound images, which results in sharper image focus.
You can build a spatial equalizer as shown in Griesinger's article. Or use an MS technique and boost the low frequencies in the L - R or side signal, and cut the low frequencies in the L + R or mid signal. The required boost or cut depends on the mic array, but a typical value is 4-6 dB shelving below 400Hz. Excessive boost can split off-center images, with bass and treble at different positions. The correction should be done to the array before it is mixed with other mics.
Gerzon (1987) points out that the sum and difference channels should be phase compensated, as suggested by Vanderlyn (1957). Gerzon notes that spatial equalization is best applied to stereo microphone techniques not having a large antiphase reverberation component at low frequencies, such as coincident or near-coincident cardioids. With the Blumlein technique of crossed figure-eight mics, antiphase components tend to become excessive. He suggests a 2.4dB cut in the sum (L + R) signal and a 5.6dB boost in the difference (L - R) signal for better bass response.
Griesinger (1989) states, Spatial equalization can be very helpful in coincident and semi coincident techniques [especially when listening is done in small rooms].
Since the strongest localization information comes from the high frequencies, microphone patterns and angles can be chosen which give an accurate spread to the images at high frequencies. Spatial equalization can then be used to raise the spaciousness at low frequencies.
Alan Blumlein devised the first shuffler, revealed in his 1933 patent. He used it with two omni mic capsules spaced apart the width of a human head. The shuffler differenced the two channels (added them in opposite polarity). When two omnis are added in opposite polarity, the result is a single bidirectional pattern aiming left and right. Blumlein used this pattern as the side pattern in an MS pair (Lipshitz, 1990).
The frequency response of the synthesized bidirectional pattern is weak in the bass: it falls 6dB/octave as frequency decreases. So Blumlein's shuffler circuit also included a 6dB/octave low-frequency boost below 700Hz to compensate.
The shuffler converts phase differences into intensity differences. The farther off-center the sound source is, the greater the phase difference between the spaced mics. And the greater the phase difference, the greater the intensity difference between channels created by the shuffler.
References
Bartlett, B. "Stereo Microphone Technique." db, Vol. 13, No. 12 (December 1979), pp. 34-46.
Bauer, B. "Stereophonic Earphones and Binaural Loudspeakers." Journal of the Audio Engineering Society, Vol. 9, No. 2 (April 1961), pp. 148-151.
Blauert, J. Spatial Hearing. Cambridge, MA: MIT Press, 1983.
Cabot, R. "Sound Localization in Two and Four Channel Systems: A Comparison of Phantom Image Prediction Equations and Experimental Data." Preprint No. 1295 (J3), Paper Presented at the Audio Engineering Society 58th Convention, November 4-7, 1977, New York.
Carterette, E. and Friedman, M. Handbook of Perception. Vol. 4: Hearing. New York: Academic Press, 1978.
Cooper, D. H. "Problems with Shadowless Stereo Theory: Asymptotic Spectral Status." Journal of the Audio Engineering Society, Vol. 35, No. 9 (September 1987), p. 638.
Cooper, D. and Bauck, J. "On Acoustical Specification of Natural Stereo Imaging." Preprint No. 1616 (X3), Paper Presented at the Audio Engineering Society 65th Convention, February 25-28, 1980, London.
Cooper, D. and Bauck, J. "Prospects for Transaural Recording." Journal of the Audio Engineering Society, Vol. 37, No. 1-2 (January-February 1989), pp. 9-19.
Damaske, P. "Head-Related Two-Channel Stereophony with Loudspeaker Reproduction." Journal of the Acoustical Society of America, Vol. 50, No. 4 (1971), pp. 1109-1115.
Dutton, G. "The Assessment of Two-Channel Stereophonic Reproduction Performance in Studio Monitor Rooms, Living Rooms, and Small Theatres." Journal of the Audio Engineering Society, Vol. 10, No. 2 (April 1962), pp. 98-105.
Eargle, J. Sound Recording. New York: Van Nostrand Reinhold Company, 1976.
Gardner, M. "Some Single and Multiple Source Localization Effects." Journal of the Audio Engineering Society, Vol. 21, No. 6 (July-August 1973), pp. 430-437.
Gardner, M. and Gardner, R. "Problems of Localization in the Median Plane-Effect of Pinnae Cavity Occlusion." Journal of the Acoustical Society of America, Vol. 53 (February 1973), pp. 400-408.
Gerzon, M. "Pictures of Two-Channel Directional Reproduction Systems." Preprint No. 1569 (A4), Paper Presented at the Audio Engineering Society 65th Convention, February 25-28, 1980, London.
Gerzon, M. Letter to the Editor, reply to comments on "Spaciousness and Localization in Listening Rooms and Their Effects on the Recording Technique." Journal of the Audio Engineering Society, Vol. 35, No. 12 (December 1987), pp. 1014-1019.
Griesinger, D. "New Perspectives on Coincident and Semi-coincident Micro phone Arrays." Preprint No. 2464 (H4), Paper Presented at the Audio Engineering Society 82nd Convention, March 10-13, 1987, London.
Griesinger, D. "Equalization and Spatial Equalization of Dummy Head Recordings for Loudspeaker Reproduction." Journal of the Audio Engineering Society, Vol. 34, No. 1-2 (January-February 1989), pp. 20-29.
Harvey, F. and Schroeder, M. "Subjective Evaluation of Factors Affecting Two Channel Stereophony." Journal of the Audio Engineering Society, Vol. 9, No. 1 (January 1961), pp. 19-28.
Huggonet, C. and Jouhaneau, J. "Comparative Spatial Transfer Function of Six Different Stereophonic Systems." Preprint No. 2465 (H5), Paper Presented at the Audio Engineering Society 82nd Convention, March 10-13, 1987, London.
Koshigoe, S. and Takahashi, S. "A Consideration on Sound Localization." Preprint No. 1132 (L9), Paper Presented at the Audio Engineering Society 54th Convention, May 4-7, 1976.
Lipshitz, S. Letter to the Editor. Audio (April 1990), p. 6.
Madsen, E. R. "The Application of Velocity Microphones to Stereophonic Recording." Journal of the Audio Engineering Society, Vol. 5, No. 2 (April 1957), p. 80.
Mehrgardt, S. and Mellert, V. "Transformation Characteristics of the External Human Ear." Journal of the Acoustical Society of America, Vol. 61, No. 6, (1977) p. 1567.
Moller, H. "Reproduction of Artificial-Head Recordings Through Loudspeakers." Journal of the Audio Engineering Society, Vol. 37, No. 1-2 (January-February 1989), pp. 30-33.
Mori, T., Fujiki, G., Takahashi, N., and Maruyama, F. "Precision Sound-Image Localization Technique Utilizing Multi-track Tape Masters." Journal of the Audio Engineering Society, Vol. 27, No. 1-2 (January-February 1979), pp. 32-38.
Nakabayashi, K. "A Method of Analyzing the Quadraphonic Sound Field." Journal of the Audio Engineering Society, Vol. 23, No. 3 (April 1975), pp. 187-193.
Rumsey, F. Stereo Sound for Television. Boston: Focal Press, 1989.
Sakamoto, N., Gotoh, T., Kogure, T., and Shimbo, M. "On the Advanced Stereo phonic Reproducing System 'Ambience Stereo.' " Preprint No. 1361 (G3), Paper Presented at the Audio Engineering Society 60th Convention, May 2-5, 1978, Los Angeles.
Sakamoto, N., Gotoh, T., Kogure, T., and Shimbo, M. "Controlling Sound-Image Localization in Stereophonic Reproduction, Part I." Journal of the Audio Engineering Society, Vol. 29, No. 11 (November 1981), pp. 794-799.
Sakamoto, N., Gotoh, T., Kogure, T., and Shimbo, M. "Controlling Sound-Image Localization in Stereophonic Reproduction, Part II." Journal of the Audio Engineering Society, Vol. 30, No. 10 (October 1982), pp. 719-722.
Schroeder, M. and Atal, B. "Computer Simulation of Sound Transmission in Rooms." IEEE Convention Record, Part 7 (1963), pp. 150-155.
Shaw, E. "Transformation of Sound Pressure Levels from the Free Field to the Eardrum in the Horizontal Plane." Journal of the Acoustical Society of America, Vol. 56, No. 6 (December 1974), pp. 1848-1861.
Theile, G. "On the Stereophonic Imaging of Natural Spatial Perspective via Loud speakers: Theory." In Perception of Reproduced Sound 1987, eds. Soren Bech and O. Juhl Pedersen. Munich: Institut fur Rundfunktechnik, 1987.
Vanderlyn, P. British Patent 781,186 ( August 14, 1957).
Vanderlyn, P. "Auditory Cues in Stereophony." Wireless World (September 1979), pp. 55-60.
Wallach, H., Newman, E., and Rozenzweig, M. "The Precedence Effect in Sound Localization." Journal of the Audio Engineering Society, Vol. 21, No. 10 (December 1973), pp. 817-826.
Williams, M. "Unified Theory of Microphone Systems for Stereophonic Sound Recording." Preprint No. 2466 (H6), Paper Presented at the Audio Engineering Society 82nd Convention, March 10-13, 1987, London.