6. Tape Recorder Transport, Maintenance, and Testing
Maintenance begins with inspection and cleaning.
Before starting the cleaning procedure, note the location and type of dirt and debris that has accumulated due to prior use. Excessive debris indicates that your recording tape is being slowly destroyed by the tape transport.
A deposit of very fine, silky threads indicates that the polyester base film of the tape is being scraped off by a sharp edge on a guide flange. Examine all edge guides for grooves cut into the flanges by the tape.
Either reposition the guide to place an unworn surface in contact with the tape or install a new guide if the groove is severe.
Deposits of brown or black dust near the guides indicate that the edges of the tape are being scraped or deformed enough to break small chunks of coating from the edge of the tape. Check the tape tension and the height of the guides and reel hubs.
Any caked-on deposits on the surface of the guides or heads are very serious. Inspect the surface of the tape for scratch marks. If the tape surface is being scratched, continued use will destroy the tape. Correct the cause of the scratches before continuing.
Several types of cleaners are available for cleaning tape machines. Older head cleaners usually contained Xylol, a strong solvent, to aggressively dissolve tape residue. Milder isopropyl alcohol is a more popular solvent today, but avoid rubbing alcohol containing 30% water in favor of the 99% pure variety for topical antimicrobial use.
Use a soft swab moistened with cleaner to scrub the contact surfaces of the heads, guides, and capstans.
Avoid drenching the swab. If the swab is too wet, solvent may run down the capstan shaft into the top bearing, washing away the bearing's lubrication. Cotton swabs are suitable for most analog tape recorders but not for the delicate heads on a helical scan recorder. Use special lint-free swabs with more pliable sticks for cleaning rotary head machines.
When cleaning the head, always rub the swab in the direction of tape motion, never across the head side ways. Sideways scrubbing may peel away the edge laminations of the cores. Avoid scraping the face of the head with the stick or core of the swab. Allow adequate time, typically 30 s, for the solvent to evaporate before rethreading the tape. You don't want the leftover solvent dissolving your recording tape.
Xylene head cleaning solvents will attack some plastics including the lenses of optical sensors. Aggressive solvents may either partially dissolve or create a hard, glazed surface on some rubber rollers. If you notice a lot of reside on your swab or rag after wiping a seemingly clean roller, you are probably dissolving the roller, not cleaning it! Use general- purpose cleaners for the plastic components and rubber cleaners for the rubber rollers.
The tape must also be kept completely free of dirt.
Keep the surface of the transport clean to avoid dirt being picked up during high-speed spooling. Always return the tape to its storage carton between uses. Do not stick your fingers through the windage cutouts in the flanges of the reel and touch the edges of the tape pack when handling the reel. (Skin debris from fingers is a source of tape dropouts!) In addition:
1. Avoid eating greasy foods while handling tapes.
2. Contamination due to finger oils and debris can be avoided during editing sessions by wearing lint-free editing gloves, which are available at most camera supply stores.
3. Keep cigarette ashes and other powdery materials far away from the tape.
The cooling system of the tape recorder should be cleaned periodically. Clean all air filters and cooling passageways and remove any dust buildup with a vacuum cleaner. Verify that all inlet or exhaust ports on the bottom of the machine are not obstructed by carpeting or dust and that adequate clearance for free airflow exists at the rear of the machine.
Following cleaning, diagnostic servicing should begin with verification that the tape guiding and tension at the heads is adequate to maintain good tape-to-head contact. Set aside one reel of tape, known as a shop tape because it typically comes from the maintenance shop, for testing. Run this tape in all modes while observing the tape at the heads and the guides. The tape should not run hard against either guide flange and there should never be any edge distortion. If edge distortion is noted, check for a bent guide or tension sensor arm. These components can be easily bumped out of alignment by a full reel of tape during loading or unloading.
On many machines a tape tension gauge of the type shown in FIG. 56 can be inserted in the tape path near the heads to measure the tension. For other machines that are too crowded in the head area, either the head assembly must be removed or a test location away from the heads must be used. Measure the tension at both the beginning and the end of the reel.
Note that the stiffness of a piece of tape varies with the width, base film thickness, and type of tape. The tension gauge must be adjusted before use to read correctly for the specific tape sample being used on the transport. A calibration weight is included with the gauge for this purpose.
The following tape tension values indicate the range of tensions commonly encountered on studio recorders.
¼ inch 3-4 oz
½ inch 4-8 oz
1 inch 6-12 oz
2 inch 10-24 oz
The nominal value for a given model of recorder will be found in the maintenance manual for the machine.
Some manufacturers specify tension measurements with a spring scale and a cord that is wrapped around a tape hub. Follow the recommended procedure.
Verify that the mechanical brakes or dynamic braking logic is stopping the tape smoothly from all modes and speeds without excessive force. A sticky brake solenoid or dirty brake band can quickly ruin your precious tape.
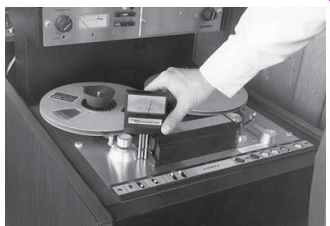
FIG. 56. Tension measurement. Courtesy Ampex Corp.
6.1 Speed
Absolute tape speed is extremely difficult to measure, even under the controlled conditions of a laboratory.
One method available to maintenance personnel is to measure the frequency reproduced from a commercially available speed reference tape. The frequency read on the frequency counter must be corrected for any difference between the tape tension on the playback machine and the tension value used by the manufacturer of the tape during the recording process. A correction table is furnished with the tape for this purpose.
A more common speed test is to check speed uniformity from beginning to end of a reel of a tape. The following procedure outlines the general technique:
1. Using an oscillator that has been operating long enough to reach stable conditions, record a reference tone in the range of 1-5 kHz at the head end of the tape.
2. Flip the reels so that the head end becomes the tail.
3. Using the console monitoring provisions of the console, mix the reproduced tone with the oscillator tone, listening for any major pitch differences. (If a significant error is detected, flip the reels again to verify that the oscillator has not shifted frequency.)
A more accurate version of this test is to use a frequency counter to measure the frequency at both ends of the reel. The speed error in percent is then calculated as:
% speed error = 2 [head - tail / head + tail] x 100%
(eqn. 12)
A speed error of 6% will yield a pitch change of one half-tone step. Typical recorder specifications are in the range of 0.1-0.5%. Machines with constant tape tension will generally have the least error.
Possible causes of speed error include excessive tension variations from beginning to end of the reel, tape slippage due to a worn capstan surface or pinch roller, inadequate pinch roller pressure, and unstable capstan speed.
Assuming that tape tension has already been determined to be correct on both sides of the capstan, the next test is to check pinch roller pressure. First, inspect the pinch roller for glazing of the roller surface or excessive wear. FIG. 57 shows roller wear patterns that may reduce the traction between the tape and capstan.
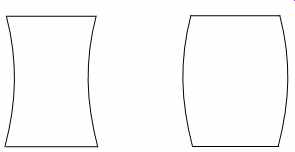
FIG. 57. Pinch roller wear patterns.
Next, a spring scale is coupled to the top (and the bottom, if possible) of the pinch roller yoke or arm, as shown in FIG. 58. The scale is pulled at right angles to the support arm with just enough force to disengage the roller from the capstan. The force reading at disengagement should be compared with the recorder manufacturer's recommended value.
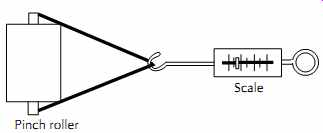
FIG. 58. Pinch roller force measurements.
For some transports the pinch roller force is set as a fixed number of turns of a nut or screw. For this case the roller linkage is first tightened to bring the roller into light contact with the capstan, and then the recommended clamping force is applied by tightening the adjustment by the specified number of additional turns.
The surface of the capstan may become so highly polished by the abrasive action of the tape that slippage will persist for the correct values of tension and pinch roller pressure. In this case the capstan must be resurfaced by plating or sandblasting or both to restore the required traction.
In very rare cases the capstan motor may actually slow down due to excessive loading caused by bad motor bearings or high tension. Bushing bearings, which are used on many direct-drive ac synchronous capstan motors and some capstan pinch rollers are an especially noteworthy problem. Periodic lubrication of these components is essential to maintain low-friction operation. Although these components may appear to spin freely when turned by hand in an unloaded state, the friction can rise dramatically when the engagement solenoid exerts several pounds of side load on the bearings. The resulting drag and wear due to dry bearings may produce substantial speed errors. One small drop of oil can make all the difference in the world. To avoid problems, follow the manufacturer's recommended lubrication schedule.
A simple strobe light, as shown in FIG. 59, can be used to check the running speed of the flywheel or fan on the shaft of the synchronous capstan motors.
Package the components inside a discarded plastic pen housing with the tip of the bulb protruding. Hold the light close enough to the rotating device to observe a reflection. The reflected pattern must remain stationary under all conditions of tape pack and speed. Induction motors, which do not run at synchronous speed, will always yield a moving pattern.
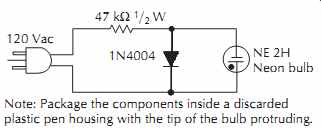
FIG. 59. Strobe light for speed testing.
Crystal-referenced servos may falsely appear to vary in speed when tested with a strobe light if the frequency of the ac mains driving the strobe varies. An oscilloscope and frequency counter are required to properly verify correct servo operation.
----------------------
FIG. 60. Flutter meter block diagram.
12.5 kHz Reference oscillator Input signal Recorder under test Flutter phase comparator Low pass filter Voltage controlled oscillator Flutter Analysis filters Meter 90° Phase shifter AM Phase comparator AM Monitor output; Output signal
----------------------
6.2 Flutter
Speed drift represents only the very lowest frequency components of the spectrum of speed errors. Measurement of the higher-frequency flutter components requires a specialized frequency demodulating instrument called a flutter meter. As seen in FIG. 60, the flutter meter may resemble the phase-lock servo of Fig. 4. The reference signal from the crystal clock must pass through the record/playback process of a tape recorder before being applied to one of the phase comparator inputs. The low-pass filter and voltage-controlled oscillator simulate a large flywheel that stores the average value of the playback frequency.
By applying the average value to the second phase comparator input, the phase comparator output will consist of only the short-term variations from the average speed. These variations are divided into various frequency bands for further analysis. The metering circuit provides a convenient quantitative measurement of the speed variations.
Just as the sampling rate of a digital audio system determines the highest possible audio frequency that can be encoded, the frequency of the test tone deter mines the range of flutter components that can be measured by any frequency demodulator. The typical upper frequency is about 0.4 times the test frequency.
Due to the nature of the sidebands that are required to operate the demodulator, a typical 18 kHz audio band width can support a 12.5 kHz test tone and a flutter bandwidth of 5 kHz. This measurement technique, referred to as high-band flutter measurement, is supported by Audio Precision.
Unfortunately, most flutter meters use a low-frequency test tone of 3150 Hz and cut off all flutter components above 250 Hz, ignoring many flutter components caused by modern-day servo systems and virtually all scrape components due to the elastic vibration of the tape. To make matters worse, most flutter specifications are made through a flutter weighting filter that only measures flutter components near 4 Hz. Proper maintenance requires that a broader spectrum test be implemented to check for any possible problem.
Two methods of specifying flutter performance are commonly encountered. If a flutter-free test tape is available, the flutter reading obtained in the playback mode can be reported. Most professional recorders, however, have flutter levels that are equal to or better than any available test tapes. In this case, recording and reproducing on the same machine is appropriate. The method of testing should be noted as part of the performance report.
Although test and diagnostic work is commonly conducted with simultaneous record/reproduce, the final testing should always be conducted in the reproduce-only mode. The tape should be started and stopped several times, with the various transport elements reoriented by hand between runs, to achieve a sampling of random combinations of the various record and playback flutter components. The arithmetic average of the maximum values of each sample throughout the reel, excluding any infrequent short-duration bursts, is the reported value.
If the flutter readings are excessive, the next step is to analyze the flutter waveform for information to help pinpoint which tape path component is defective. The following techniques are helpful in isolating the culprit:
1. The human ear and brain form a very versatile spectrum analyzer that frequently can immediately identify the defective component from the characteristics of the flutter signal being reproduced in a monitor loudspeaker. Take advantage of this free portable instrument that is always at your disposal by listening to the demodulated output from the flutter meter.
2. The various selectable filters of the flutter meter can be used to isolate the general portion of the flutter spectrum in which the offending component is generating flutter.
3. The expected rotational flutter rate from a rotating component can be calculated from the diameter of the component and the tape speed using the expression
Flutter frequency = ST / πd (eqn. 13)
where,
ST is the tape speed,
d is the diameter of the component.
These frequencies can range from approximately 0.5 Hz for the once-around of full reel of tape to 60 Hz for a small-diameter capstan shaft. Some manufacturers include a table of these flutter frequencies in their maintenance manuals. The small balls and retainer clips inside the ball bearings used in many rotating components generate additional not-so-obvious flutter components at frequencies higher than the once-around rate of the bearing.
4. If the flutter is very regular, the flutter pattern displayed on the oscilloscope can be utilized to calculate the frequency of the dominant flutter component. Any flutter components caused by ac motors or power supply ripple will remain stationary on the oscilloscope screen if the sweep triggering mode is set to line.
5. A common search technique is to deliberately create flutter by attaching a small piece of masking tape to the surface of a rotating component. The rate of the flutter blips created by the masking tape can then be compared with the unknown component to deter mine if the two rates are identical.
6. Note any change in the flutter spectrum when each of the auxiliary rotating components such as guides and flutter idlers is stalled. Stalling the defective component will cause the offending flutter component to cease. A notable exception to this case is the scrape flutter idler. Stalling a scrape flutter idler should usually double or triple the scrape flutter amplitude. If little or no increase is noted, the idler is not functioning properly. Check for dirty or damaged bearings that would keep the idler from spinning freely.
The following procedure describes a flutter test using a wide-bandwidth flutter meter, such as is shown in FIG. 61. The general technique also applies to other meters.
FIG. 61. Flutter meter. Courtesy MANCO.
1. Connect the reference oscillator output (REF OSC) to the line input of the tape recorder.
2. Connect the demodulator input (INPUT) to the line output of the tape recorder.
3. Connect the demodulated output (MONITOR) to an oscilloscope and an audio monitor.
4. With the tape machine in the record mode, set the recorder's input level control to achieve a playback level of -10 VU. The green Cal light should be illuminated, indicating proper operating level.
5. With the FM/AM and Avg/Peak buttons both out and the 5 kHz and 1.0% FM buttons in, depress the Cal button. A reading of 0.68% indicates proper system operation. A 150 Hz square-wave tone will be seen on the oscilloscope and heard in the monitor.
6. To begin the actual test of the recorder, select the 250 Hz filter and choose the meter sensitivity range that yields a reading near midscale. The meter reading is the composite value of all flutter components in the frequency band of 0.5-250 Hz, including flutter due to not only the rotating capstan, roller, and guides and their associated bearings but also any ac-power-related motor torque pulsations.
7. Select the Wtd. filter. The bandwidth is now reduced to 0.5-20 Hz, to emphasize the once-around rates due to eccentricities of the rotating components.
Capstans and rollers with diameters of ½-2 in (12-50 mm) are major contributions in this band.
8. Select the 250 Hz-5 kHz bandpass filter labeled l.
The dominant component in this range is scrape flutter, which typically peaks at 3-4 kHz for most recorders. Instabilities or oscillations of the capstan or spooling servos, which tend to occur in the 100-500 Hz range, may also be evident.
9. If the machine is equipped with a scrape flutter idler, stall the idler by pressing the point of a pencil against the top of the idler. The scrape flutter component should typically rise to two or three times the normal value. If little or no rise or even a decrease is noted, the scrape flutter idler is not functioning properly. Clean and lubricate the idler bearings according to the manufacturer's instructions.
Use the flutter meter to obtain optimum positioning of the idler after cleaning.
10. Select the 5 kHz filter. This overall reading covers the entire range from 0.5 Hz-5 kHz.
7. Tape Testing
Contrary to popular belief, not all tape that reaches the customer's hands is fault free. Although the tape manufacturers are to be commended for the very high standards of excellence that are maintained, the customer must be prepared to deal with the bad rolls of tape that slip through the manufacturer's quality control screening. The problems that do arise can usually be traced to one of the seven steps in the manufacturing process:
1. The basic recipe of approximately a dozen major ingredients that form the oxide mixture must be correctly formulated. Each ingredient must be pure and must be measured correctly. Errors in mixing and experimental formula modifications often lead to nondurable oxides that shed debris onto the guides and heads.
2. The mixing of the ingredients must be thorough but not excessive. Inadequate mixing leads to high modulation noise and high background noise.
Excessive mixing reduces noise but increases print through.
3. The coating process must apply a uniform coating across the width and length of the tape. The coating is applied to jumbo rolls that range from 18-36 inch (0.5-1 m) in width. To monitor the entire width of one of these rolls fully would require over 400 channels of conventional record/reproduce circuits!
4. The tape is baked to remove solvents by passing the coated web through a multizone oven. Poor temperature control can lead to either brittle or soft oxides.
5. The jumbo roll is run through heated rollers that make the oxide denser to increase output and high-frequency response. This calendaring step is a major factor in determining the modulation noise content of the finished tape.
6. The tape is slit to the final width by a set of rotary shears. Poor slitting can produce ruffled edges, wavy or crooked tape, and excessive oxide and backing debris on the recording surface.
7. The tape is rewound onto reels or hubs, tested, and then packaged for sale. The tape cartons usually pass through a very large degausser so that no residual signals are left on the tape.
Mistakes during the manufacturing process create four types of problems. The most common of these is signal amplitude variations, which are due to either a nonhomogeneous magnetic dispersion or erratic tape-to-head contact due to physical distortions of the tape. Other common problems include excessive noise or distortion and high print through.
A common method of testing the signal instability and dropouts is to observe the amplitude variations of a sine-wave signal on either an oscilloscope or a VU meter. While these techniques give some insight into the performance of the tape, they do not yield a quantitative value that can be used for determining acceptable limits of performance.
A more informative method is to amplitude demodulate the test signal to remove the steady tone and magnify the fluctuations. If the output of the demodulator is properly filtered and fed to a metering circuit, quantitative values for the fluctuations in various test bandwidths can be read.
Unlike other flutter test instruments, the flutter meter shown in FIG. 49 contains amplitude-demodulating circuitry to be used for testing tape. The AM test configuration is identical to the previous flutter setup, except that the FM/AM selector is set for AM mode testing to connect the phase-lock loop as a synchronous amplitude demodulator. The AM meter ranges, which are ten times larger than the flutter ranges, are labeled below the meter ranging pushbuttons.
The AM reading for 15 in/s (38 cm/s) operation is typically 0.5% rms for a good roll of tape on a professional recorder. The texture of the demodulation products coming from the audio monitor should be a low rumbling with only occasional moderate bursts. The high-pass filter l should produce a uniform hiss.
Typical symptoms of bad rolls of tape include readings that are approximately three times higher than the normal readings or very large frequent bursts that drive the meter pointer hard against the upper stop. Routine studio tests of large quantities of tape stock over a period of two years has shown that these easily spotted characteristics are good indicators of defective tape.
Although amplitude variations are symptomatic of bad tape, the tape transport and heads are also possible sources. If the tape is not being held snugly against the faces of the heads due to inadequate tape tension, the tape may suffer irregular spacing loss. Other contributors are dirt on the heads or heads that have been worn so flat that the gap is no longer pressed firmly against the tape. Mechanical misalignments, such as a twisted head or improperly positioned guides or scrape flutter idlers, can also degrade the contact between the tape and head.
Mis-adjustments of the bias amplitude or even-order distortions of the bias or erase waveforms can also produce excessive AM levels. Always verify that the bias levels and tuning are correct before condemning the tape.
A simple method of avoiding embarrassment when a defective roll of tape is suspected is to recheck the machine with a reference roll of the same type of tape that is known to be good. If changing from the reference roll to the suspect roll causes a large increase in AM content, then the tape is the source of the problem.
Since none of the tape manufacturers supplies information that is useful for specifying the AM performance of a tape, the user must generate data by testing several rolls of tape on machines. Once this process is begun, subsequent additions to the database will provide even more insight into the expected range of values.
8. Magnetic Head Troubleshooting and Maintenance
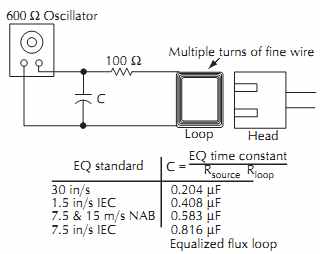
FIG. 62. Flux loop.
Troubleshooting any piece of complex equipment requires a methodical search technique to isolate the source of the problem quickly. The most productive technique is to conduct a series of tests that subdivide the faulty portion of the total system into smaller and smaller parts until the fault source is finally isolated.
Applying this technique to a magnetic tape recorder would lead to partitioning questions such as:
1. Is the problem associated with the tape drive, the audio circuitry, or the control logic?
2. Does the fault occur during recording, playback, and/or input monitoring?
3. Is the problem due to the recorder or the roll of tape?
4. Is the problem similar at both tape speeds?
5. Is the problem the same throughout the reel of tape?
6. Does temperature or running time have an effect?
If the problem relates to the audio signal passing through the recorder, a fundamental question that must be answered is whether the problem is wave length-dependent or frequency-dependent. Wavelength problems immediately isolate the problem to the inter face between the moving tape and the heads. Frequency problems are often related to the audio circuits.
A very useful tool for separating wavelength problems from frequency problems is a simple device known as a flux loop shown in FIG. 62. The flux loop, which consists of nothing more than a few turns of fine magnet wire driven with a constant current from an audio oscillator, creates a magnetic field that simulates a perfect lossless piece of tape. When the flux loop is attached to the gap region of the playback head, the flux from the loop excites the head much like the primary winding on a transformer excites the secondary winding. This direct excitation eliminates all the wave length effects associated with gap length, azimuth error, and thickness loss. If the reproduce electronics perform correctly when excited by the flux loop but still fail to reproduce a known-good prerecorded test tape correctly, the problem is a wavelength-dependent error at the head-to-tape interface.
The playback response from a simple flux loop is by no means flat. Since the dominant loss due to the coating thickness is not present for flux loop excitation, the high-frequency response with a flux loop will show a pronounced rise that relates to the particular reproduce equalization standard that is being utilized. NAB low-frequency equalization will also produce a roll-off below 50 Hz.
To simplify the measurement process, the oscillator signal feeding the flux loop is usually pre-equalized to accommodate these effects of the equalization standard. FIG. 62 includes a simple circuit for correcting the high end, with capacitor values for several common equalizations. (The 600 ohm impedance of the oscillator is part of the filter. For a 50 ohm oscillator, multiply the capacitor values by 2.57.) The resulting high-frequency playback response of an equalized flux loop will be flat except for any residual high-frequency discrepancies due to eddy current losses or self-resonance of the play back head and cabling.
The flux loop can also be used in reverse as a pickup device to probe the magnetic fields generated at the gaps of the record and erase heads. If the driving network is disconnected and the loop connected directly to the inputs of an oscilloscope and meter, the relative magnitude of the bias and audio fields can be examined.
Care must be exercised to correct for the 6 dB/octave rise in flux loop output voltage due to the inductive nature of the flux loop. (A resistor in series with the input and a capacitor shunted across the input can be used to create an integrating low-pass filter that will flatten out this 6 dB/octave rise.) Details regarding the construction and use of a flux loop, along with detailed mechanical alignment procedures for azimuth, height, and tape wrap, are available from the various tape recorder manufacturers.
8.1 Head Re-lapping
The performance characteristics gradually change as the abrasive action of the tape wears away the faces of the heads. The resulting decreases in gap depth will reduce shunting effects, leading to an increase in efficiency for both the record and playback heads. Bias and audio levels must be gradually reduced to offset the rising efficiency. A critical point is reached, however, when the useful face of the head has been completely removed and the length of the gap begins to increase quickly with wear. The top end of the playback response will drop abruptly within a matter of only a few hours of use, rendering the recorder unusable. At this point, the head must be replaced to restore normal performance.
The heads on most recorders require attention long before this point of ultimate failure is reached. On most machines, the tape wears away the rounded apex at the gap of the head, leading to a drop in contact pressure with the tape at the gap. The tape begins to lift off the head slightly, creating erratic short-wavelength performance due to the spacing loss effect.
The common solution is to re-contour the face of the head to restore the contact pressure. This process, known as head re-lapping, can be utilized two or three times during the useful life of a head to restore original performance. Although the average technician can be trained in the relapping process, the high cost of a mistake with a 2 inch (50 mm) multitrack head assembly suggests that the more exotic relapping tasks should be handled by relapping specialists.
9. Routine Signal Alignment Procedure
A common problem arises with conventional recorders and alignment procedures-namely, that the procedures require a change in each adjustment to verify that the optimum point has been reached. This typically leads to not only the premature demise of many trimmer potentiometers (which are typically rated by the manufacturer for a life of 200 adjustment cycles) and head azimuth hardware, but also many operator errors due to the tedious nature of adjusting a multitrack machine that may have as many as 1000 adjustments.
If the operator is willing to adopt a philosophy that most of the adjustments are probably adequately close to optimum and that they need not be readjusted, then the alignment task shifts to looking for the exceptions to the norm rather than arbitrarily resetting everything. This strategy promotes better results since each iteration of the alignment procedure serves to fine-tune the results rather than to erase all past efforts and start afresh for each alignment with a high probability of error.
A few exceptions to the need for tweaking to verify proper performance are worthy of note. For example, head azimuth can be verified with a differential method that uses alternating test segments that have equal but opposite amounts of deliberate azimuth error. If the drop in level is equal for both directions of tilt, then the head must be correctly aligned to the correct vertical reference. No head adjustments are required if the test results are satisfactory.
A similar noninvasive test procedure for optimizing the bias level can be achieved if the bias system contains a master bias level trimmer that varies the level of bias for all tracks simultaneously. The bias level can be increased and decreased on all tracks with this single control to verify that the proper level of overbias is achieved without resorting to unnecessary adjustments on each track.
The following sequence of steps represents a comprehensive alignment procedure that would be appropriate whenever the proper performance of a recorder must be verified. Since the details of each step vary with machine type, the operator should consult the operator's manual published by the manufacturer of the recorder.:
1. Clean and inspect the tape transport. (Refer to Section 28.8).
2. Degauss the heads and guides. (Refer to Section 3.8). Before using a degausser, always verify that the tips of the unit are covered with a soft material such as plastic or tape that will not scratch the faces of the magnetic heads.
3. Calibrate the reproduce section of the recorder with a test tape of known accuracy. Several brands of standard alignment tapes are available for this purpose. Remember that the final results will be no better than the measurement standard that is being used as a reference.
First, verify the perpendicular alignment of the reproduce head with the short-wavelength azimuth test tone on the test tape. The azimuth and/or phase alignment of the head can be measured with an oscilloscope using either a Lissajous pattern or a dual-trace display or with a phase meter that reads phase error directly. If no specialized equipment is available, invert one channel and sum the inverted output with another channel that is not inverted.
Phase alignment produces a deep null in the summed output. Since phase alignment at one frequency does not eliminate the possibility of a 360q_error, check the phase for several lower frequencies. The voice announcements on the alignment tapes provide a convenient multi-frequency sample for this purpose.
Next, establish a convenient reference level for making playback frequency-response measurements. Check and adjust the high-frequency reproduce equalizer at 10 kHz to match this reference level. Once the equalizer has been set, sweep through the tones on the tape, noting the maximum deviations from the reference value. Readjust the equalizer and the reference level as necessary to obtain the desired degree of flatness.
When the results are satisfactory, write down the results for later comparison. Having a record of correct performance makes troubleshooting much easier.
Two pitfalls exist when making the previously discussed adjustments: one affects the reference level and the other affects the frequency- response and reference level. Some recorders use different track widths for the record and playback heads. For machines that have wider playback heads, the full-track test tapes used for most of the wide-tape formats will produce an enhanced output during testing. The reference level from the tape must be set above the 0 VU reference by the amount of this extra pickup due to the wider head when using the playback head. When setting the reference level for sync/overdub playback, the track width is correct, yielding a true 0 VU level that requires no correction.
If the record head has a wider track, then the normal playback level will be correct and the error will occur on the sync/overdub level.
The second problem is created by the fringing effect of long wavelengths that produces a rise in playback response at low frequencies whenever additional flux is present beyond the area being scanned by the reproduce head. Such a condition exists for playback of a full-track alignment tape and for test and alignment procedures that apply the same low-frequency signal to all tracks of the recorder simultaneously.
The fringing effect will first create a problem in establishing the correct reference level for the midband-level set tone. At 15 in/s and 30 in/s (38 cm/s and 76 cm/s) tape speeds, sufficient fringing may exist to create an error of approximately 0.5-1 dB, depending on the track format, tape speed, and geometry of the head cores and shielding. This extra fringing contribution in the reference tone also makes the high-frequency response appear to be deficient, tempting the operator to raise the equalizer adjustment. Consult the operator's manual for the correct procedure and correction factors for a given model of recorder.
The final step in the reproduce alignment procedure is to set the level and equalization of the sync/overdub circuit. The operator may choose to defer the azimuth alignment of the record head until the following record alignment procedure if the heads have not been disturbed.
4. The record alignment begins with the verification and/or adjustment of the azimuth setting of the record head. Using the playback head as a standard, set the record head alignment while recording a short-wavelength signal such as a 10 kHz or 15 kHz signal to give minimum azimuth or phase error using whatever method was used for the reproduce alignment procedure. This alignment should be rechecked after the bias and record equalization settings are made, since these adjustments can intro duce varying amounts of phase delay.
The bias should be set by adjusting for the desired amount of overbias as recommended by the tape and machine manufacturer for the appropriate type of tape, record head gap width, and tape speed.
Note that a 10 kHz signal at 30 in/s (76 cm/s) does not achieve the desired wavelength of 1.5 mils (38 µm) that is typically specified for bias adjustment. The test frequency must be changed to match the tape speed.
The bias should first be decreased to achieve deliberate under-bias, and then slowly increased to the point at which a peak in the playback level is observed. Continue to increase the bias until the signal drops by the number of decibels desired.
Typical overbias settings range from 2-5 dB for professional formats.
Once the bias is correctly adjusted, the input signal should be set to the frequency used as a reference during the playback alignment. The record gain control can then be set to produce the reference level when driven with the appropriate 0 VU input level.
Adjust the high-frequency record equalizer to match the record/play response as closely as possible to the alignment tape response noted previously. Smoothness in the midband frequencies is more important than trying to hold small errors at 15 kHz or 20 kHz.
Recheck the record head azimuth to verify that changes in bias and equalization have not created any phase differences. Readjust as necessary until all parameters are optimized.
Set the record gain preset and the input monitor gain calibration to achieve a 0 VU reading in all monitor modes.
5. After the record section has been aligned, a final test and alignment of the low-frequency playback equalizers can be undertaken. To eliminate all the fringing problems previously mentioned, the equalizers should be set in the record/play mode with signal being applied to every other track. Make small adjustments as required to optimize the smoothness of the response.
If any large discrepancies are noticed, rerun the alignment tape. Any failure in the low-frequency record equalizer circuits, such as a faulty switching component, will create an error that should be obvious if a large correction is required. If any doubt still exists, record a full-frequency sweep and then flip the reels over to play the tape backward.
The alignment should be similar within a few tenths of a dB to the values set in the forward direction.
6. The alignment procedure is not completed until the noise level and erasure have been checked. Record a signal at +6 VU, rewind the tape, and then erase the signal. Listen on the monitor speakers to the level of the residual signal and to the subjective nature of the tape noise. The tone should be either completely eliminated or well buried in the tape noise. The noise should be a smooth hiss without large or frequent bursts or crackling. All tracks should be similar in performance. Also, check for objectional clicks and pops when changing modes.
Although these noise and erasure levels can be read from instruments, the operator should take the time to listen to the machine before issuing his or her stamp of approval. Many sessions have died aborning because the recorder was never given a final listening test after alignment.
The previous procedure does not include several steps that are more appropriately considered to be maintenance routines. Examples include tuning of the bias and erase sources, tuning of bias traps, checking meter calibration, and testing distortion levels. These tests are not required on a day-to-day basis.
As a final note on alignment, never gloss over large discrepancies. The corrections that should be required for this alignment procedure should be on the order of a small part of a dB, not several dB. Whenever a large change seems required, stop long enough to determine why such a large change is necessary. Look for faulty components and recheck your own procedure. Recheck the maintenance log to establish the proper level of performance that should be expected. Heeding the small symptoms may help you avoid a serious catastrophic failure.
10. Automated Alignment
The onslaught of digital technology has provided the tools to control the variable alignment adjustments of a tape recorder with a microprocessor. Multiple sets of calibration constants can be stored in nonvolatile memory, permitting rapid changes of operating speeds, equalization standards, reference flux levels, and tape types.
Once the provisions for automated adjustment are made available, three methods of alignment are possible. Under the simplest mode, the operator performs a manual alignment with the calibration constants being stored for later use. This method permits rapids changeovers, but does not simplify bias and equalization adjustments to optimize a specific roll of tape.
If the microprocessor can be provided with input information from the metering devices on the individual tracks, then calibration programs can be automatically executed without operator intervention. The program contains the "strategy" for alignment, including desired amounts of overbias, equalization adjustment frequencies, and operating levels. Beware that such systems use an inferred adjustment technique which does not actually test many of the critical parameters. For example, the recorder will set the bias level for minimum distortion based on an overbias criterion at a specified frequency. In reality, the machine doesn't have the ability to measure distortion. The strategy only infers that over-biasing by the desired amount corresponds to minimum distortion. Unfortunately, if a malfunction exists that causes abnormal operation, the adjustment routine may not detect the symptoms.
Nearly automatic calibration can be implemented by connecting external automated test equipment such as an Audio Precision System One test set to the machine through an external intelligent controller such as an IBM-compatible computer. A remotely controlled input/output switching matrix will also be necessary for multitrack machines. An operator is still required to adjust non-automated devices such as head azimuth and to change tape reels for calibration tapes and sample stock. The calibration program of the intelligent controller sequences through a comprehensive set of tests which rigorously exercise the machine. Parameters such as harmonic and intermodulation distortions, crosstalk, erasure, flutter, speed, noise, and phase can be tested against absolute standards of acceptance.
Hopefully, the advent of inexpensive DSP (digital signal processor) chips will allow manufacturers to include the diagnostic equipment as a part of the built-in calibration hardware.
A final word of caution is appropriate at this point.
Many operators and test technicians ignore symptoms that indicate problems are developing in a tape recorder.
A good example is the frequent need to boost the high-frequency equalization adjustments of a recorder.
A properly operating machine should not show such trends, but a gradually deteriorating head would create just such a problem. Simply readjusting without deter mining the cause of the change wastes an opportunity to fix a problem at an early stage before it grows to catastrophic consequences. Try to avoid problems by fixing things before they break completely.
============