TECHNICAL TALK, JULIAN D. HIRSCH

RECORDED VELOCITY: It is hardly possible to read specifications or a test
report on a phono cartridge without finding a reference to recorded velocity.
We are concerned with velocity because the output signal voltage of a magnetic phono cartridge is proportional to the velocity of its stylus movement.
What is meant by stylus velocity? It relates to both the amplitude (the peak-to-peak excursion of the stylus in the groove) and the rate at which the stylus moves back and forth during its excursions. Although the mathematics of this relationship is not difficult, it does reach the level of differential calculus, which is not exactly like your everyday multiplication tables. Fortunately, however, the matter can be ably demonstrated by graphic means. Figure 1 shows an idealized record groove, drawn as though it were in a straight line instead of following the usual spiral path. A single cycle of sine-wave modulation is imposed on it (normally, there would be a number of identical cycles preceding and following the one shown, but they are omitted for clarity). The physical width of the groove can be ignored for present purposes, and it is further assumed that an ideal stylus is being used, one whose position is controlled at all times by the groove movement.
The peak amplitude of the modulation, measured in centimeters (cm), is A. The rate at which the stylus moves from side to side (its velocity in centimeters per second or cm/sec) obviously changes constantly with its position along the recorded cycle. At time t= 0, the beginning of the positive half-cycle, it is a maximum, as shown by the fact that the slope of the tangent to the waveform at that point is greatest. At the peak of the sine wave, the velocity is zero; although the record continues to move past the stylus at a constant rate, the stylus motion at right angles to the line of the unmodulated groove (which generates its output voltage) is zero at that instant.
As we continue along the cycle, the stylus reverses direction and moves negatively with increasing velocity, again reaching a maximum when it crosses the zero axis one half-cycle after the start.
The process continues through the completion of the cycle, and through any subsequent cycles.
Shown below the groove-modulation sketch in Figure 1, and on the same time scale, is the electrical output waveform of the cartridge (which is proportional to the instantaneous velocity). At the crest of the cycle, where the velocity is zero, the signal output is zero, and it reaches its maximum levels at those times when the waveform passes through the zero axis, corresponding to its maximum velocity. Notice that the electrical output has the same waveform as the groove modulation, but that it is displaced in time (or phase) by a quarter of a cycle, or 90 degrees.
The relationship between peak re corded amplitude A, peak velocity v, and frequency f is: v = 2 pi fA, where v is in centimeters per second, f is in hertz, and A is in centimeters. Although this formula applies only when dealing with a single-frequency sine wave, it can be extended to cover more complex wave forms that are actually combinations of a number of sine-wave signals.
We measure the output voltage of a phono cartridge by playing a test disc with a 1,000-Hz signal recorded with a velocity of 3.54 cm/sec in each stereo channel. This number is not entirely arbitrary, since it corresponds to a lateral (mono) modulation of 5 cm/sec, which is often taken to be a typical "average" recording level. The velocity is actually a peak level, but the cartridge output is measured in terms of an rms voltage (0.7 times peak). This seeming inconsistency is a matter of convention, and it is a universal practice.
Sometimes, recorded velocity is con fused with groove velocity or linear velocity, which is the rate at which the record groove moves past the stylus. They are quite distinct, though still related.
For example, if the record speed in the example of Figure 1 were to be doubled, the side-to-side movement of the stylus would take place twice as frequently.
The cartridge output would thus be at double the frequency, and as the relationship v = 2 pi fA shows, the velocity would also be doubled-and with it the output voltage. The linear groove velocity (Vs) is equal to 2 pi RN/60, where R is the distance of the stylus from the record's center in centimeters (in other words, the playing radius) and N is the rotation speed in revolutions per minute.
Obviously, the groove velocity increases linearly with playing radius; for a 12-inch (30-cm) record whose inner radius is 2.5 inches (6.25 cm), the groove velocity varies from 52.4 cm/sec at the out side of the record to 21.8 cm/sec near the record label.
The wavelength of the signal, which is the amount of groove length occupied by one cycle of the waveform, varies with frequency, playing speed, and radius.
Consider our sine-wave illustration. If it is part of a 1,000-Hz signal recorded at the outside edge of a record, 1,000 complete cycles will be recorded in each second. The 1,000 cycles will cover a distance of 52.4 cm, so that the wave length of each cycle will be 52.4/1,000=0.0524 cm. Near the end of the same disc, the 1,000 cycles will occupy a distance of 21.8 cm, giving a wavelength of 0.0218 cm.
Figure 2 shows how the same number of cycles recorded at different record radiuses have different wavelengths (the wavelength is the distance between successive positive or negative peaks of the signal). Note that, although the wave length near the outside of the record is more than twice as great as that near the inside, the groove is moving past the stylus at a correspondingly greater speed, so the frequency (as well as the recorded velocity and thus the cartridge output voltage) should be the same at both points.
Some recordings are said to have a constant-amplitude response over a certain frequency range, and a constant-velocity response over other parts of the range. A constant-velocity recording, as its name suggests, should deliver a uniform output at all frequencies when played with a velocity-responding (magnetic) cartridge. But this is not really ideal. If we assume that there is a peak groove amplitude of 0.001 cm at 1,000 Hz, the velocity is a reasonable 6.3 cm/sec. If the same velocity is maintained at higher frequencies, the amplitude at 20,000 Hz will have dropped to only 0.00005 cm. Even though that should yield the same output voltage as the 1,000-Hz signal, the normal surface roughness of the vinyl groove wall can generate sufficient noise in the cartridge output that its signal-to-noise ratio (S/N) will be seriously degraded with such a low-amplitude recorded signal. At the other end of the audio spectrum, as we go down in frequency, the amplitude of the signal becomes very large, reaching 0.05 cm at 20 Hz. While it might be possible to record such a high amplitude, a ...
----------
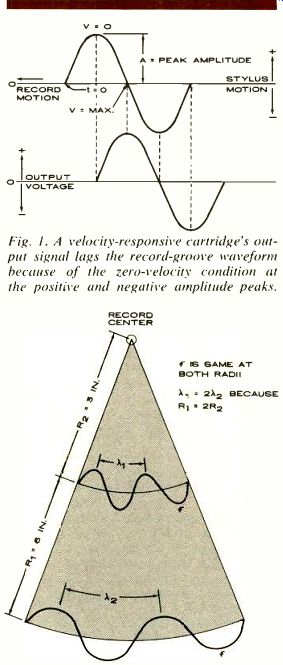
Fig. 1. A velocity-responsive cartridge's output signal lags the record-groove waveform because of the zero-velocity condition at the positive and negative amplitude peaks.
Fig. 2. The pie-wedge shape represents a section of a disc. Shown in simplified form is the compression in wavelength (not frequency) that occurs in the inner grooves.
------------
... very wide groove spacing would be needed to avoid interference between adjacent grooves, and this would be un economical in terms of the disc's playing time.
The solution is to change from a constant velocity to a constant amplitude characteristic at suitable frequencies, maintaining a reasonable balance between the two, so as to achieve the desired playing time per side, a satisfactory S/N, and a maximum velocity within the capabilities of most cartridges. Normally this transition takes place below 500 Hz and above 2,120 Hz. Between those limits, the constant-velocity recording characteristic is used. The output decreases by half with each octave of frequency below 500 Hz, and doubles with each octave increase above 2,120 Hz (slopes of 6 dB per octave).
Such a recording, played with a magnetic cartridge and an unequalized amplifier, would sound very shrill and lacking in bass. For this reason, the amplifier introduces a standard playback equalization (RIAA) which boosts the lows at a 6-dB-per-octave rate below 500 Hz and cuts the highs at the same rate above 2,120 Hz, The result is the modern LP recording process, with an essentially uniform frequency response over the full audio range, a quiet background, a playing time of up to one-half hour per side, and maximum velocities that can usually be tracked by any reasonably good phono cartridge.
Obviously, this has been a very simplified treatment of a rather complex process, and the exceptions to these "rules" are legion. Nevertheless, an understanding of the fundamentals should help any one to interpret and appreciate the specified and measured performance of phono cartridges.
---