by J. L. Veranth [Bose Corporation ]
THE DETERMINATION of how to remove heat from the power transistors is an important aspect of the design of power amplifiers. This task, which separates the design of power amplifiers from that of most other audio components, is called thermal design. The thermal design of the Bose 1801 amplifier, which delivers 250 watts (rms) per channel into 8 ohm loads, illustrates several little-understood concepts.
Thermal design requires the answers to three questions: (1) How high should the temperature be allowed to get? (2) How much power must be dissipated? (3) How is this to be done? The answers to these questions are not always simple. This is illustrated by some common misconceptions. Do you believe that a 500 W amplifier needs twice as much heat sink as a 250 W amplifier, or that an amplifier generates much more heat when operated at full power than at half power? Do you believe that an amplifier is ever used at half power, or that a high-power amplifier will be more reliable than a low-power amplifier, since it just loafs most of the time? If so, you may be surprised as we study thermal design.
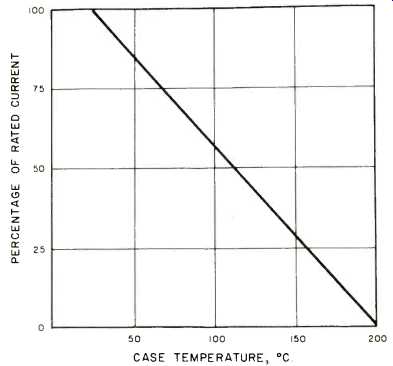
Fig. 1--Power transistor derating (dissipation-limited region.)
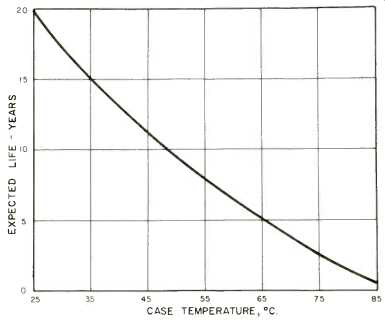
Fig. 2--Electrolytic capacitor lifetime.
The temperature of amplifiers is normally limited by three considerations. First, no exposed parts should get so hot that they pose a hazard to the user in terms of burned fingers.
Second, the temperature must be limited to provide adequate operating margins for power transistors. Transistors are reduced in capability by higher temperatures and must be derated accordingly. A typical manufacturer's derating curve for power transistors is shown in Fig. 1. Higher temperature means that more transistors are required to do a given job. Third, the reliability of most components is reduced by higher temperatures. The power transistor and heat sink temperature determine the environment in which these components must operate. The lifetime of electrolytic capacitors, for example, is strongly dependent upon temperature, as shown by the manufacturer's data in Fig. 2. On the other hand, heat removal costs money, so that making it too cool can be expensive. This trade-off is usually weighed by the engineer and results in the selection of a maximum operating temperature. A temperature of 65 C. (150° F.) is frequently chosen, since it is cool enough to avoid hazards and to provide adequate device margins Selection of the temperature allows calculation of device parameters, worst-case variations, and expected reliability. A thermostat is then chosen and located so that the hottest spot in the amplifier will never exceed the desired limit.
The determination of how much power must be removed sounds simple.
The power comes primarily from dissipation in power transistors. The operation of an amplifier power stage is illustrated in Fig. 3. Power is supplied to the power stage from the power supply by means of two voltages +V, and -Ve. This power is transferred to the load through power transistors. In a class B amplifier only one set of transistors is "on" at any instant (except perhaps for insignificant bias currents). Therefore, the current flow in the power transistors is always equal to the load current. Whenever the voltage across the load is less than the supply voltage, the difference between the supply voltage and the output voltage is developed across the power transistors.
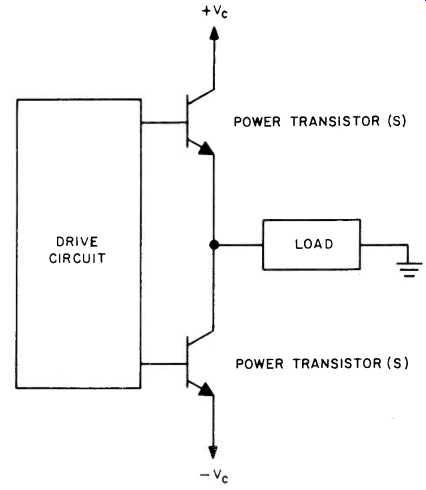
Fig. 3--Amplifier power stage.
In order to illustrate more clearly how the power stage operates, let us consider a resistive 8 ohm load and a power supply voltage of + 100 volts. Let us look at some instantaneous voltages and currents which may occur across the load and power transistors for several cases of operation. Since an 8 ohm resistive load is being considered, the load current will always equal one eighth of the load voltage at any instant.
Four cases of load and transistor operating conditions are presented in Table I. Since these are instantaneous voltages, currents, and watts, the numbers will not be exactly the same when considering the average value of a.c. voltages, currents, and watts, but the trend will be similar.
This data, therefore, illustrates two significant points. (1) Full-power operation is not the worst-case amplifier condition, since the transistors then dissipate very little power relative to the load. (2) A high-power amplifier works harder to put out a given power than a low-power amplifier. This can be checked by trying the 8 W load case while assuming only a 25 V power supply.
Of course, this description has been oversimplified by looking at instantaneous values of voltage, current, and power. For a thermal analysis, we must consider average dissipation. The calculations are commonly done for continuous sine-wave signals, as in rms power testing. We must also recognize that an unregulated power supply will droop at full load from V, to an average of alpha_Vc, and that the amplifier at low frequencies will deliver an output voltage less than the instantaneous power supply voltage by a factor of ß. Knowing these factors, we can express power dissipation (Pdiss) in terms of power output (Po) and rms power rating (Pspec):
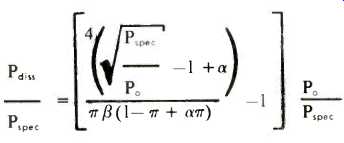
For alpha equals 0.9 and ß equals 0.95 the results are shown in Fig. 4. Note that the dissipation is nearly constant for output greater than about half power. You may have heard the story that a high-power amplifier will be more reliable because it just loafs at lower power levels. But note that to play at 10 watts, a 25 W amplifier must dissipate 20 W, whereas a 250 W amplifier must dissipate 88 W! If you buy the high power amplifier, it should not be because it loafs.
Actually, all this theoretical analysis does not completely answer the question of how much power must be dissipated in a 250 watt amplifier.
The reason I might buy a 250 W amplifier instead of a 25 W amplifier is because of the extra 10 dB of head room. The ratio of the peak power in a music waveform to the peak power in a continuous sine wave of the same average power is called the crest factor of the music. A 25 W amplifier would be driven into clipping when played at an average level of 5 W with any music which had a crest factor greater than 7 dB. A 250 W amplifier would be clipped if the music had a crest factor greater than 17 dB. Most music has a crest factor between 10 dB and 20 dB (my taste runs toward the high end), which indicates that I really could not use my 250 W amplifier at average levels much above 5 W without frequent clipping anyway. (The fact that the amplifier has a higher IHF or peak power capability than its rms capability gives me, roughly, an extra 2 dB which is neglected for simplification because the extra margin vanishes, as a practical matter, on a long organ pedal or synthesizer note anyway).
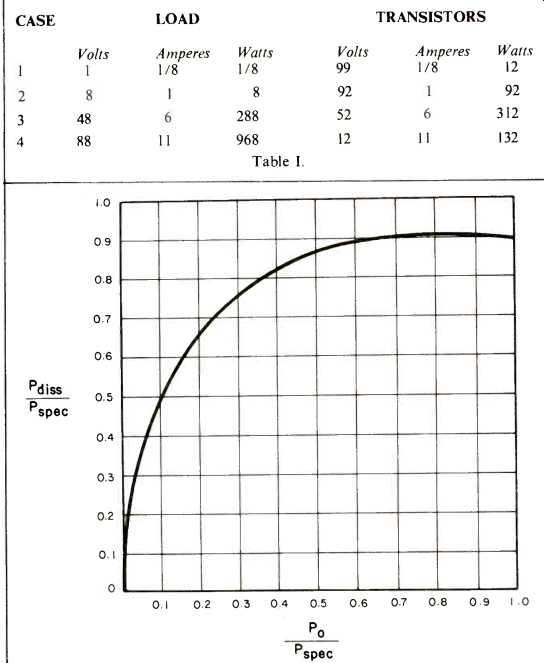
Fig. 4--Amplifier power dissipation per channel.
The question of how much power is really "needed" is a subjective question beyond the scope of this discussion, but the results of some surveys may be found in the box.
As a real test of thermal requirements, a continuous tape loop of music with the lowest crest factor I could find (and therefore the highest power demand) was played at a level where frequent clipping occurred on the Bose 1801. Monitoring of temperatures with thermistor gauges indicated that this was thermally equivalent to an average dissipation of 110 W/channel, corresponding to a sine wave output of only 18 W! This continuous-loop operation undoubtedly exceeds most typical home requirements. In fact, we have concluded that for normal home music reproduction, where operation is intermittent and the amplifier is seldom clipped, a 250 W amplifier need dissipate only 100 W/channel.
This is all the information needed for thermal design. The 100 watts per channel must be removed from the power transistors without allowing the transistor temperature to exceed 65° C. at room temperatures up to 30° C. (86° F.). The heat sink parameter of significance is called thermal resistance: The temperature rise (35° C.) divided by the power-flow (100 W). or in this case 0.35 °C/W. To choose a heat sink, a simple modeling technique shown in Fig. 5 is used. The structure is drawn and divided into simple sections for which the thermal resistance can be calculated. These thermal resistances are replaced by electrical analogs.
For example, a section of aluminum becomes a resistor of value equal to its thermal resistance, a source of power becomes a current source, and temperature rise between two points becomes the voltage drop as illustrated in Fig. 5a. The mechanical structure of Fig. 5b, which consists of power transistors dissipating powers P,, and P,, a heat coupler which carries the heat to the heat sink, and the heat sink itself, is transformed to the electrical model of Fig. 5c, and finally simplified to that of Fig. 5d. The aluminum heat coupling structures and thermal grease used to fill surface irregularities where the surfaces are mated have a calculated thermal resistance of 0.06 °C/W so the heat sink must have a thermal resistance of 0.29 °C/W. In fact, the coupling structure of the 1801 has a thermal resistance of 0.065 °C/W, and the heat sink has a thermal resistance of 0.3 °C/W. It should be noted that the heat sink is, by far, the dominant thermal limitation for natural convection cooling, so that reducing the thermal resistance of the heat coupler has negligible effect.
The 1801 heat sink was designed for free-air convection. What about forced air cooling? In worse environments, or non-audio applications, forced-air may be necessary. This changes the whole picture. For example, blowing on the heat sink will reduce its thermal resistance to 0.1 °C/W or less. Then the coupling bracket may have a significant effect.
For this reason the professional version of the 1801 (the 1800) has a heavier coupling bracket.
What's the net effect of all this effort? It should be clear that all relevant information is not conveyed by the rms power specification. Instead, let's look at a curve of power versus time. The time for which the amplifier can supply a specified power is given in Fig. 6. This capability has proved more than adequate for home music reproduction. It can be seen that for short periods of time the amplifier is limited by its no-load power supply voltage (IHF power). For longer periods, the amplifier is limited by the full-load power supply voltage (rms power). The curve at this point folds back upon itself, since the dissipation is actually lower at higher power levels. Finally, we reach the region of continuous operation.
All of these regions of amplifier operation are important and have to be considered in their relationships to the demands of music and the capacity of loudspeakers. This discussion has dealt only with the thermally limited region, which is always neglected by a single-number power specification such as IHF or rms power. Perhaps the insights provided concerning the thermal design of an amplifier will somewhat offset this lack of data.
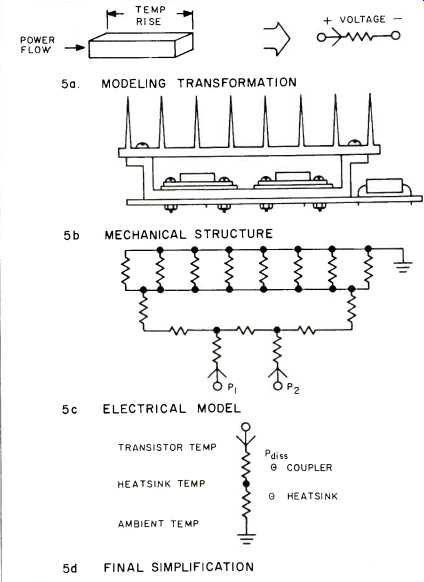
Fig. 5--Thermal modeling.
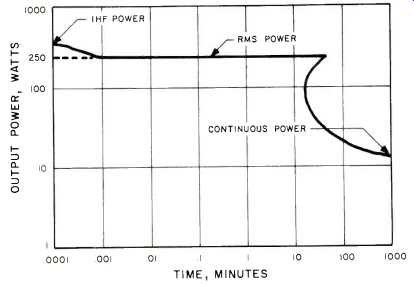
Fig. 6--Amplifier output power.
=======
The Real Operating Environment
There has been a great deal of discussion on how much amplifier power is required in the home listening environment. This depends upon the efficiency of the loudspeakers, the size and acoustic properties of the room, and individual listening taste. Instead of providing another opinion on the subject, we determined the actual operating conditions of home stereo systems. The questions answered are:
1. What is the background noise level in the typical home listening room?
2. What are the typical listening levels?
3. How much power is used to produce these levels? These were not laboratory tests but actual measurements made in several dozen homes using the stereo equipment and room configuration found there without alteration. Our equipment consisted of a voltmeter, portable sound pressure level meter, and test recording. A 1 kHz warble tone was used to measure speaker sensitivity with minimum disturbance by room modes. The subject selected his own recordings for determining listening levels.
Wide variations in environment, equipment, and taste preclude the determination of a "norm." Instead, we attempted to establish the extremes by selecting subjects which maximized these variations. All types of equipment were represented within the constraint that the user felt it was of adequate quality not to restrict his or her listening habits. The results, which should not be considered definitive bounds, are listed below:
Background Noise Level, dBA 35-68
Listening Level, Background Music, dBA 48-82
Listening Level, Critical Listening, dBA 59-95
Level Produced by 1 Vrms/speaker, dBA 74-85
The 60 dB difference between the loudest listening level and the lowest noise level indicates that these listeners were unable to utilize an equipment signal-to-noise ratio greater than 60 dB referenced to average output. It is also significant that a 95 dB level could be produced by 3 Vrms (1.1 W into 8 ohms) in some systems and would require 11 V (15W) in others. The startling conclusion for those users surveyed is that an average listening level of 95 dB meets the need even for critical listening. To produce this level, a continuous amplifier power of only 15 watts is required! Where does the rest go? Read the accompanying article.
====
( Audio magazine, Feb. 1974)
Also see:
High-Voltage Amp Design (Feb. 1974)
Transient IM Distortion in Power Amplifiers (Feb. 1975)
FTC Power Ratings: An Optimistic View (Feb. 1975)
"I See What You Mean!" How the Westrex 45/45 System Was Adopted by the Record Makers (Mar. 1975)
= = = =