Tracking Capability of Phonograph Pickups
by J. G. WOODWARD
TRACKING refers to the ability of a phonograph pickup to maintain proper contact between the stylus and the record-groove walls while playing back the recorded modulation. Despite major advances in pickup design in recent years, mis tracking still can be a significant cause of distortion in many pickups. The pickup stylus is held in the record groove by an unbalanced downward force, called the "tracking force" (or VTF), or "bearing weight." The tracking forces used with modern pickups range from 0.75 to 5 grams.
Low-Frequency Tracking
For a given tracking force, the ability of a pickup to track low-frequency signals is determined by the pickup compliance. The higher the compliance, the greater the groove modulation displacements that can be followed without mistracking. Compliance specifications of pickups are listed as a certain number of centimeters per dyne. For example, a compliance of 15 X 10^-6 cm/dyne means that if a force of 1 dyne (= 1/980 gram) is applied to the stylus in a pickup, the stylus will be deflected a distance of 15 X 10^-6 cm.
It is not unusual for a pickup compliance to be different in the vertical and lateral directions. Some pickup manufacturers state the compliances in both directions. Others list only a single compliance without specifying the direction. Still others list only a recommended tracking force which, of course, is the only factor over which the user has any control, this usually being set by means of a counterweight or adjustable spring on the pickup arm. In principle, if the compliance of a pickup is known, it is possible to calculate the minimum tracking force required to track low frequency signals. In high-level, low frequency recorded signals, lateral peak displacements of 0.0015 inch (= 3.8 X 10^-3 cm) may occasionally be encountered. In a pickup having a compliance of 15 X 10^-6 cm/dyne a lateral farce of (3.8 X10^-3) , ( 15 X10^-3) = 0.254X10^3 dynes, or about 0.25 gram is thus developed. If friction between the stylus and the record is neglected, the components of this force perpendicular to and parallel to the groove wall that is doing the pushing at the instant of maximum displacement are each 0.25 √ 2 = 0.18 gm., since the groove walls make an angle of 45 deg. with the direction of lateral stylus motion. Unless the force component parallel to the groove wall is balanced by an oppositely-directed force component due to the tracking force, the stylus will slide up the groove wall and skip over into an adjacent groove. Even when mistracking is not so severe as to cause groove skipping, audible distortion of the reproduced sound may occur as the stylus-groove contact varies erratically.
To present the catastrophic occurrence of groove skipping a downward directed tracking force of at least 0.25 gm. is required. This value should be doubled in order to handle simultaneous vertical and lateral excursions of large amplitude. The tracking force must be increased still further to allow for the skating force, for frictional forces in the pivot bearings of the pickup arm or in the mechanical elements of a record changer, and for eccentric and warped records. Thus, one can understand why it takes a most unusual pickup to track all passages on all records with a tracking force of less than 1 gm. However, nearly all modern stereo pickups are capable of good low-frequency tracking when used with somewhat larger tracking forces.
Unfortunately, tracking problems are not restricted to the compliance controlled, low-frequency region.
Other forces that act when reproducing the high-frequency portion of the audio spectrum make high-frequency tracking a problem with many pickups. In the remainder of this article the nature of the high-frequency tracking problem will be described and some recent measurements illustrating the phenomenon will be discussed.
High-Frequency Tracking
Pickup tracking at high frequencies is best explained in terms of the mechanical impedance of the pickup. In particular we will consider the driving point mechanical impedance at the stylus. Over much of the audio-frequency range the mechanical impedance of moving-magnet, moving-iron, and moving-coil pickups is closely analogous to the electrical impedance of the simple and familiar network made up of inductance L, capacitance C, and resistance R, shown at (A) in Fig. 1. The relation between voltage, V, and current, I, is determined by the electrical impedance, Z_e. In the mechanical analog shown at (B), the force F, applied to the stylus by the record groove is related to the stylus velocity, y, by the mechanical impedance, Z_in. The elements making up the mechanical impedance are the effective mass at the stylus, M, the compliance, C, and the mechanical resistance or damping, R. The impedance has its minimum value at the frequency of resonance, f_o, as shown at (C) in Fig. i where the magnitude of the driving force is plotted as a function of frequency. At frequencies well below resonance the impedance is ZLF = 0.5 pi f C and the moving system is compliance controlled. This is the case treated in the preceding section.
At frequencies well above resonance the impedance is Z_HF = 2 pi fM and the system is mass controlled.
For the types of pickups considered here, the resonance frequency, fo, usually lies in the mid-band region, say between 800 and 3000 Hz. The effective stylus-tip mass of modern, high quality pickups ranges from 0.5 mg. to about 2 mg. The mechanical impedance for a 1-mg stylus and 15-kHz frequency is: ZMF = 2 pi (15 X 10^3) (1 X 10^-3) = 95 mechanical ohms.
If a lateral signal at 15 kHz having a peak recorded velocity of 10 cm/sec is being reproduced, the peak lateral force, F, on the stylus will be: F = 95 (10) = 950 dynes = 0.97 gm.
A tracking force at least this large is required if the stylus is to maintain contact with both groove walls throughout each cycle of this 15-kHz modulation. The same result is obtained if, instead of relating the peak velocity to mechanical impedance, one considers the peak acceleration of the mass of the stylus as is sometimes done in discussions of this type. Indeed, the two approaches are completely equivalent for sine-wave signals.
The peak velocity of 10 cm/sec used in this example represents a rather high level for a 15kHz signal, but it is a level that may occasionally be encountered in short bursts. The minimum tracking force of 0.97 gm found necessary in this case is seen to be substantially greater than the force of 0.25 gm found necessary in the low-frequency example calculated earlier. Hence, for a pickup having a compliance of 15 X 10^-6 cm/dyne and a tip mass of 1 mg, the latter parameter should be the controlling one in determining the tracking force.
If a less massive stylus is used, the tracking force required will decrease proportionately. As in the low-frequency case, the total tracking force should be greater than the value calculated for lateral modulation in order to accommodate simultaneous lateral and vertical motions. When the tip mass is 1 mg or less, a tracking force between 1 and 2 grams should usually be adequate for high-frequency tracking-providing the driving-point impedance acts as a simple mass in the high-frequency range.
It has been found, however, that many pickups-including some of the best-exhibit a mechanical anti-resonance somewhere between 10 and 20 kHz. The anti-resonance is due to the stylus arm bending in a more complex mode. When this occurs the simple circuit depicted at (B) in Fig. 1 is no longer adequate. Close to the frequency of the anti-resonance, the circuit shown at (A) in Fig. 2 is more appropriate. When moving at the frequency of this anti-resonance the forward and rearward portions of the stylus arm move in opposite phase, and their masses, M, and M2, referred to the stylus, are separated by a shunt compliance, C of the arm as it bends in this mode. The driving-point impedance at the frequency of anti-resonance, f', becomes very large, and the magnitude of the force between the stylus and the groove wall has the general form shown at (B) in Fig. 2.
The relatively soft vinyl record is deformed in the area of stylus contact, and the magnitude of the groove-wall deformation varies periodically at the frequency of the modulation. Through this means, the compliance of the groove walls lowers the frequency of the anti-resonance slightly. When the frequency of the recorded modulation is close to the frequency of anti-resonance, the large stylus-groove forces that are generated require a greater tracking force if the stylus is to maintain contact with both groove walls.
Even when there is no reason to suppose that contact has been lost there still can be an increase in distortion, as will be shown in some of the measurements discussed in the following.
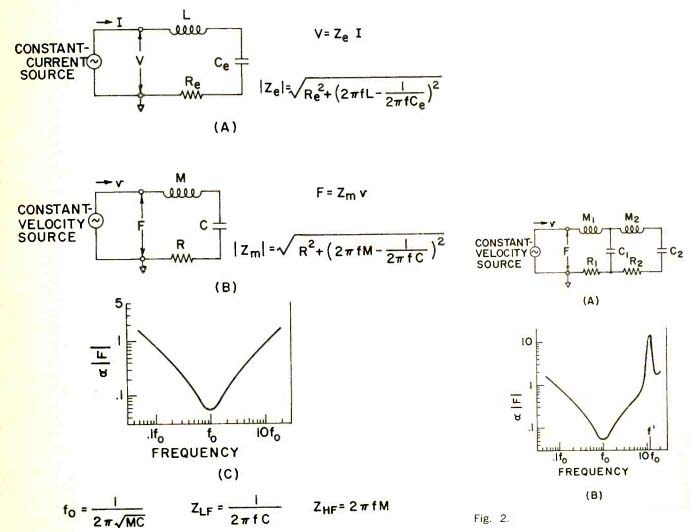
Fig. 1. (A) Simple series R,L,C electrical circuit having a driving-point
impedance Z. (B) Analog of the mechanical elements of the moving system
of a pickup having a driving-point mechanical impedance, Zm, at the stylus
tip. (C) Typical curve of stylus-groove force as a function of frequency
for the simple analog shown at (B). fo will lie between 800 and 3000
Hz for most modern, high-quality pickups.
Fig. 2. (A) Analog of the mechanical elements of the moving system of a pickup having a high-frequency anti resonance. (B) Typical curve of stylus groove force as a function of frequency.
Note the large value of force in vicinity of the anti-resonance at f'.
Sweep-Frequency Tests Two types of tests that have been used recently in laboratory studies of tracking will be described and examples of test results will be shown. The first type of test employs recorded sweep-frequency signals. The recorded sweep-frequency signals consist on a constant-velocity signal that sweeps from 2 to 20 kHz in slightly less than 1/20th of a second. The sweep is repeated 20 times per second.
Thus, the output of a pickup reproducing this signal can be displayed as a stationary pattern on an oscilloscope screen, with the vertical deflection showing the output voltage at each instant and with the horizontal deflection representing frequency. The recorded frequency sweeps upward with time along a logarithmic scale, and blanking markers are inserted at 4, 6, and 10 kHz. An overshooting pulse that marks the start of each sweep at 2 kHz can be used for horizontal synchronization of the oscilloscope. Bands of this signal were recorded on a laboratory test record at four velocity levels and in both lateral and vertical modes.
Figure 3 is an example of sweep frequency test results, showing photographs of oscilloscope traces of playback voltage for the four recorded levels in the lateral mode, and for three values of tracking force. The pickup under test has a smooth and flat frequency response over the entire frequency range of the sweep, as can be seen in the lower-level traces. However, mistracking occurs for the 20.3cm/sec signal. This is evidenced by the erratic and irregular traces for this level. Some irregularity is already present in the traces for the 12.7-cm/ sec level, and the raggedness of the response is seen to become worse as the tracking force is decreased. The behavior of this pickup for vertical modulation was found to be very similar to that shown here for lateral modulation.
The effects of high-frequency mis tracking are shown even more strikingly in the traces for another pickup in Fig. 4 for lateral modulation and Fig. 5 for vertical modulation. This pickup is one having a mechanical anti-resonance at about 13 kHz. Open circuit response measurements of the pickup show a very pronounced peak at the frequency of anti-resonance.
For the tests shown in Figs. 4 and 5, a carefully adjusted R-C load was connected across the terminals of the pickup to give a substantially flat response to almost 15 kHz, as is observed in the lowest-level traces with 2and 3-gram tracking forces. Irregularities in response are seen to occur due to mistracking in the neighborhood of the anti-resonance even for the 5.1-cm/sec modulation when the tracking force is only 1 gram. The evidences of mistracking become progressively worse as the modulation velocity is increased and are very extreme for the 20.3 cm/sec level. Several of the photographs are double exposures showing two superimposed successive oscilloscope traces. The wild variations seen to occur from one sweep to the next give an idea of how erratic the stylus motion is during mis tracking.
Another, but less extreme, effect is observed when mistracking is approached. This is a gradual shifting to lower frequencies of the upper frequency limit of the pickup response as the modulation level is increased.
It appears that as tracking becomes poorer, the frequency of the stylus groove resonance discussed earlier moves to lower frequencies. A tentative explanation of this phenomenon can be offered in terms of groove-wall deformation. When the driving-point forces at the stylus become comparable to the tracking force, the depth of indentation and the area of stylus groove contact vary appreciably from point to point in each modulation cycle in a non-linear manner. At high modulation levels the stylus spends a larger fraction of the time in the condition of lower deformation. In this case the effective groove-wall compliance averaged over a cycle is higher.
This higher compliance then combines with the driving-point impedance of the stylus to lower the frequency of the stylus-groove resonance. However, before this hypothesis can be verified or elucidated in detail, we must learn a great deal more about the dynamic deformation of the groove walls under a stylus at high frequencies.
Intermodulation Tests The second type of laboratory test used in studying pickup tracking uses intermodulation as the performance indicator. When two sine-wave signals are passed through a system, any non linearity in transmission causes each of the signals to modulate the other and so produce distortion in the form of tones having frequencies equal to the sum and difference of the original signals and of their various harmonics.
These tones are known as intermodulation products, and their measurement has provided a powerful tool for the analysis of the non-linear behavior of many types of systems, including phonograph playback systems. For example, recorded frequencies of 400 and 4000 Hz have come into rather common use in the study of phonograph-playback distortion at 400 Hz.
For studying pickup performance at high frequencies it is more appropriate to use two recorded tones of equal velocity and quite close in frequency as the test signal. For example, to measure the performance at 10 kHz we might use primary tones having frequencies of 9.8 kHz and 10.2 kHz.
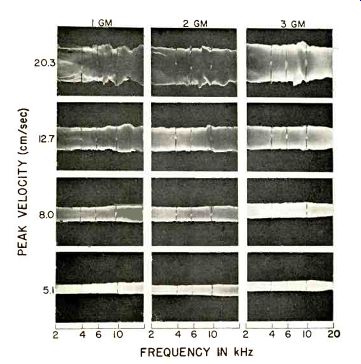
------------- FREQUENCY IN kHz. Fig. 3. Oscilloscope traces of the
output of pickup "A" when playing lateral sweep-frequency modulation
with various tracking forces. Mistracking is indicated by an irregular
envelope.
The first-order sum and difference intermodulation products will then be found at 20 kHz and 400 Hz. The magnitude of these sum and difference tones is a direct indication of the non-linearity of the playback system, including the stylus-groove relationship.
In the case of most pickups it is not feasible to make accurate measurements of the sum tone because its frequency is too high. However, the difference tone is readily measureable and can give useful information.
In order to study pickup tracking, as well as other playback phenomena, throughout the range from 2 to 20 kHz while simplifying the data-acquisition problem as much as possible, two tones of equal and constant velocity and separated by 400 Hz were recorded while they glided from a mean frequency of 2 kHz to a mean frequency of 20 kHz. The rate of glide was synchronized with the chart drive of an automatic level recorder. When playing back this test signal the output of the pickup is amplified, passed through a 400 Hz band-pass filter and fed to the chart recorder. Thus, the pen plots a curve showing the magnitude of the difference tone as a function of the mean frequency of the two primary tones as they glide through the high-frequency range. In the measurements presented here the magnitude of the difference tone will be expressed as a percentage of the peak velocity of the two recorded primary tones. The test signals were recorded in the right and left stereo channels.
Signals for each channel are carried in four bands near the outside of a 12-inch, 33 1/3 RPM record. The peak velocity of the primary tones increases in 4-dB steps from band to band.
The intermodulation measurements shown in Fig. 6 were made with the same pickup used for the sweep frequency tests of Fig. 3. The per cent IM is shown as a function of frequency for both channels, for four velocity levels, and for tracking forces of 1, 2, and 3 grams. We note that the per cent IM consistently increases as the tracking force is decreased. This is true even though there is no indication of loss of stylus-groove contact.
Since this pickup has no anti-resonance in the 2-20 kHz range, the per cent IM as a function of frequency is fairly constant for a given tracking force. The only notable exception to this occurs for the higher level bands with a 1-gram force. Here, a rise in IM at the low-frequency end of the curve is noted. This is an indication of impending low-frequency mistracking due to too low a compliance.
A second set of IM measurements is shown in Fig. 7 for the pickup used in obtaining the sweep-frequency traces of Figs. 4 and 5. Tracking forces of 1.5, 2.0, and 2.5 grams were used. The effect of the high mechanical impedance at the anti-resonance is strikingly evident in these curves. The poor tracking in the neighborhood of the anti-resonance results in a high value of IM. As in the case of the first pickup, lower values of tracking force lead to higher IM at all frequencies.
In the data for both pickups the IM in the right channel is consistently higher than that in the left channel.
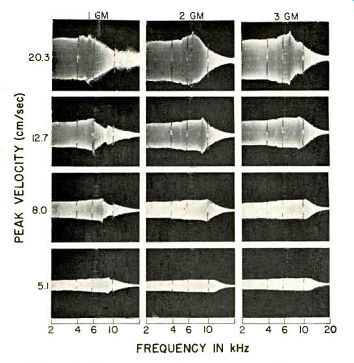
-------- FREQUENCY IN kHz. Fig. 4. Oscilloscope traces of the output of
pickup "B" when
playing lateral sweep-frequency modulation with various tracking forces.
Mistracking is seen to be strongly affected by a high-frequency anti-resonance.
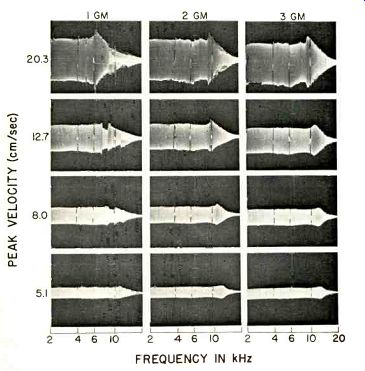
-----------Fig. 5. FREQUENCY IN kHz. Oscilloscope traces of the output
of pickup "B" playing vertical sweep-frequency modulation with
various tracking forces.
Tests have demonstrated that this difference is due to the presence of an uncompensated skating force which pulls the pickup toward the center of the record. This puts a greater contact force on the inner groove wall which carries the left channel. Skating force compensation in the form of a counter-acting force on the pickup arm may be added. This increases the IM in the left channel and decreases it in the right channel to make the two nearly equal.
Discussion
We have seen that high-frequency tracking can be studied by the sweep frequency technique and by measurement of intermodulation products. The sweep-frequency traces show dramatically the erratic behavior of a stylus when mistracking occurs. However, this technique yields only qualitative or at most, semi-quantitative results.
The IM technique, on the other hand, permits truly quantitative measurements. Although IM measurements do not often show an abrupt onset of mistracking as certain conditions are reached, they do show clearly the deleterious effect of a high mechanical impedance in the range of frequencies covered by the test.
It is appropriate to consider briefly the effects of improper tracking on the quality of music reproduced from stereo records. The extreme case of groove jumping requires no comment.
Before this extreme is reached, however, the stylus may slide about or rattle in the groove when high-amplitude, low-frequency passages are played with a pickup having too low a compliance and/or tracking force.
The audible results in the reproduced sound are rattles and buzzes of short duration on certain notes of the music.
When poor tracking occurs for high frequency components of the music one or more of several types of distortion may be heard. Perhaps the most readily identifiable result of high frequency mistracking occurs for percussion instruments or stringed instruments that are struck or plucked. The onset of the sound in such cases is abrupt and is very rich in high frequency components. The noticeable distortion is in the form of a very short click of "kssh" type of sound at the beginning of the note. In extreme cases the reproduced timbre of the instrument may be altered noticeably. Another manifestation of high-frequency mistracking occurs when a chorus of instruments rich in harmonics is playing at high level. In this case intermodulation products are generated, and the difference tones of the high-frequency components fall in the low- or mid-range of frequencies.
Occasionally these difference tones are audible. More often they are partially masked by the much louder components of the music in the same frequency range as the difference tones, and the intermodulation is not recognized for what it is even though it is contributing to a general "muddiness" or lack of clarity in the total sound.
High-frequency mistracking is not the only, and may not be even the principal, cause of high-frequency inter modulation in some phonograph systems. Tracing distortion and vertical tracking-angle errors are other causes.
Indeed, even the magnetic recorders used to make the master tapes from which the disc is copied are not always beyond suspicion in this regard, particularly if several generations of tape are needed in the processing.
There is little that the user of a phonograph system can do to control mistracking beyond making certain that the pickup arm is adjusted for minimum friction and that the tracking force has a reasonably high value.
There is a limit to how large the tracking force may be, however. If the force is too large, the upward static deflection of the stylus arm will be so great that the pickup cartridge will touch the record. Also, in some cases a tracking force large enough to minimize mistracking will result in accelerated record wear. Not enough is known about the mechanism of wear and its dependence on pickup characteristics to permit a categorical setting of upper limits for the tracking force at the presentime. All things considered, however, it is considered generally preferable to use a tracking force at the upper end of the range of forces recommended by the pickup manufacturer. Fortunately, the manufacturers of many of the better grades of pickup are now aware of the high frequency tracking problem, and we may expect new pickup models improved in this regard to become available in the next year or two. It remains to be seen, though, how good a compromise can be made between the design parameters required for high frequency performance and those required for low-frequency performance and for mechanical stability and ruggedness. In any event, this is certain to be an interesting stage in the progressive development of phonograph systems.
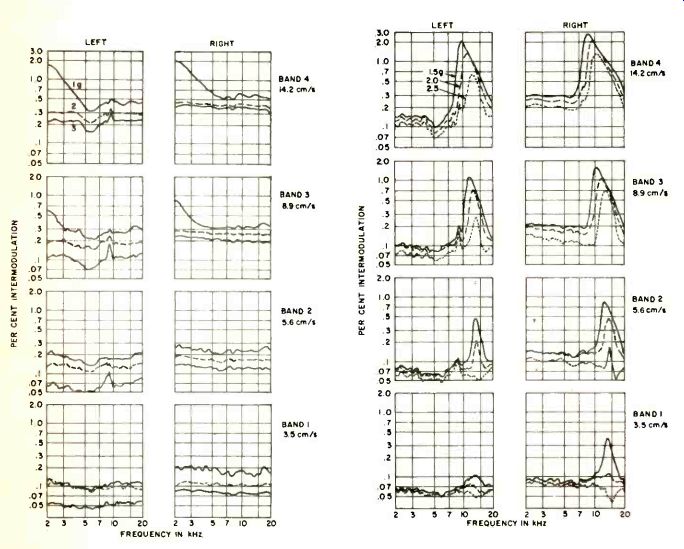
Fig. 6. High-frequency intermodulation measurements in right and left
channels for pickup "A" using tracking forces of 1, 2, and
3 grams.
Fig. 7. High-frequency intermodulation measurements in right and left channels for pickup "B" using tracking forces of 1.5, 2.0, and 2.5 grams.
----------------
ADs
SHURE ... the most important advance in phono cartridges since the advent of stereo ...a new genre of cartridge, analog-computer-designed, and measured against a new and meaningful indicator of total performance: "TRACKABILITY"
The radically new V-15 TYPE II heralds a new epoch in high performance cartridges and in the measurement of their performance. We call it the era of high Trackability. Because of it, all your records will sound better and, in fact, you will hear some recordings tracked at light forces for the first time without distortion.
THE PROBLEM: While audiophiles prefer minimum tracking forces to minimize record wear and preserve fidelity, record makers prefer to cut recordings at maximum levels with maximum cutting velocities to maximize signal-to-noise ratios. Unfortunately, some "loud" records are cut at velocities so great that nominally superior styli have been unable to track some passages: notably the high and midrange transients.
Hence, high level recordings of orchestral bells, harpsichords, pianos, etc., cause the stylus to part company with the wildly undulating groove (it actually ceases to track). At best, this produces an audible click; at worst, sustained gross distortion and outright noise results. The "obvious" solution of increasing tracking force is impractical because this calls for a stiffer stylus to support the greater weight, and a stiffer stylus will not track these transients or heavy low-frequency modulation, to say nothing of the heavier force accelerating record and stylus wear to an intolerable degree.
Shure has collected scores of these demanding high level recordings and painstakingly and thoroughly analyzed them.
It was found that in some cases (after only a few playings) the high velocity high or midrange groove undulations were "shaved" off or gouged out by the stylus thus eliminating the high fidelity.
Other records, which were off-handedly dismissed as unplayable or poor pressings were found to be neither. They were simply too high in recorded velocity and, therefore, un-trackable by existing styli.
Most significantly, as a result of these analyses, Shure engineers established the maximum recorded velocities of various frequencies on quality records and set about designing a cartridge that would track the entire audible spectrum of these maximum velocities at tracking forces of less than 1 1/2 grams.
ENTER THE COMPUTER: The solution to the problem of true track ability proved so complex that Shure engineers designed an analog-computer that closely duplicated the mechanical variables and characteristics of a phono cartridge. With this unique device they were able to observe precisely what happened when you varied the many factors which affect trackability: inertia of tip end of the stylus or the magnet end of the stylus; the compliance between the record and the needle tip, or the compliance of the stylus shank, or the compliance of the bearing; the viscous damping of the bearing; the tracking force; the recorded velocity of the record, etc., etc. The number of permutations and combinations of these elements, normally staggering, became manageable. Time-consuming trial and-error prototypes were eliminated. Years of work were compressed into months.
After examining innumerable possibilities, new design parameters evolved. Working with new materials in new configurations, theory was made fact.
Thus, the first analog-computer-designed, superior trackability cartridge was born: the Shure SUPER-TRACK V-15 TYPE II.
It maintains contact between the stylus and record groove at tracking forces from 3/4 to 11/2 grams, throughout and beyond the audible spectrum (20-25,000 Hz), at the highest velocities encountered in quality recordings. It embodies a bi-radial elliptical stylus (.0002 inch x .0007 inch) and 15° tracking.
It also features an ingenious "flip-action" built-in stylus guard.
It is clean as the proverbial hound's tooth and musical as the storied nightingale.
THERE ARE MANY WAYS TO PROVE ITS SUPERIORITY TO YOURSELF: (1) Shure has produced a unique test recording called "An Audio Obstacle Course" to indicate cartridge trackability.
It is without precedent, and will be made available to Shure dealers and to the industry as a whole. You may have your own copy for $3.95 by writing directly to Shure and enclosing your check. (Note: The test record cannot be played more than ten times with an ordinary tracking cartridge, regardless of how light the tracking force, because the high frequency characteristics will be erased by the groove-deforming action of the stylus.)
(2) A reprint of the definitive technical paper describing the Shure Analog and trackability in cartridges, which appeared in the April 1966 Journal of the Audio Engineering Society, is available (free) to the serious audiophile.
(3) A representative list of many excellent recordings with difficult-to-track passages currently available is yours for the asking. These records sound crisp, clear and distortion-free with the Shure V-15 Type II. The Shure Super-Track V-15 TYPE ll is available at your dealers at $67.50. Shure Brothers, Inc., 222 Hartrey Avenue, Evanston, Illinois 60204
-----------------
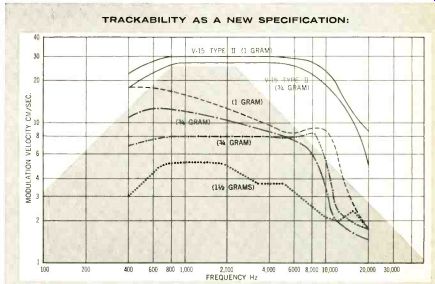
TRACKABILITY AS A NEW SPECIFICATION:
This chart depicts the new performance specification of trackability. Unlike the oversimplified and generally misunderstood design parameter specifications of compliance and mass, trackability is a measure of total performance. The chart shows frequency across the bottom, and modulation velocities in CM/SEC up the side. The grey area represents the maximum theoretical limits for cutting recorded velocities; however, in actual practice many records are produced which exceed these theoretical limits, The smoother the curve of the individual cartridge being studied and the greater its distance above the grey area, the better the trackability. The trackability of the Shure V-15 TYPE II is shown by the top (solid black) lines. Representative curves (actual) for other cartridges ($80.00, $75.00, $32.95, $29.95) are shown as dotted, dashed and dot-dash lines for comparison purposes.
+++++++
Pickering
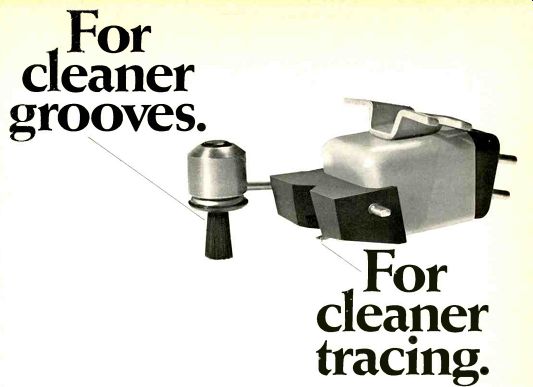
For cleaner grooves.
For cleaner tracing.
New Pickering V-15/3 cartridge with Dynamic Coupling for minimum tracing distortion and maximum tracking ability, plus Dustamatic' feature for dust-free grooves As stereo cartridges approach perfection, dust in the grooves becomes intolerable.
The Pickering V-15 / 3 Micro-Magnetic cartridge has a new moving system that reduces tracing distortion close to the theoretical minimum, thanks to Dynamic Coupling of the stylus to the groove. But what good is perfect contact between the stylus tip and those high-velocity turns if dust particles get in the way? That is why the Dustamatic brush assembly is an essential part of Pickering's total performance cartridge. It cleans the groove automatically before the stylus gets there.
The new moving system also provides a further refinement of Pickering's famous natural sound by extending peak-free response well beyond the audible range, and the patented V-Guard Floating Stylus continues to assure the ultimate in record protection.
There are four "application engineered" Pickering V-15 / 3 Dustamatic models with Dynamic Coupling, to match every possible installation from conventional record changers to ultra-sophisticated low-mass transcription arms. Prices from $29.95 to $44.95.
For free literature complete with all details, write to Pickering & Co., Plainview, L.I., New York.
For those who can hear the difference. Pickering
+++++++++++
Good records start with Stanton.
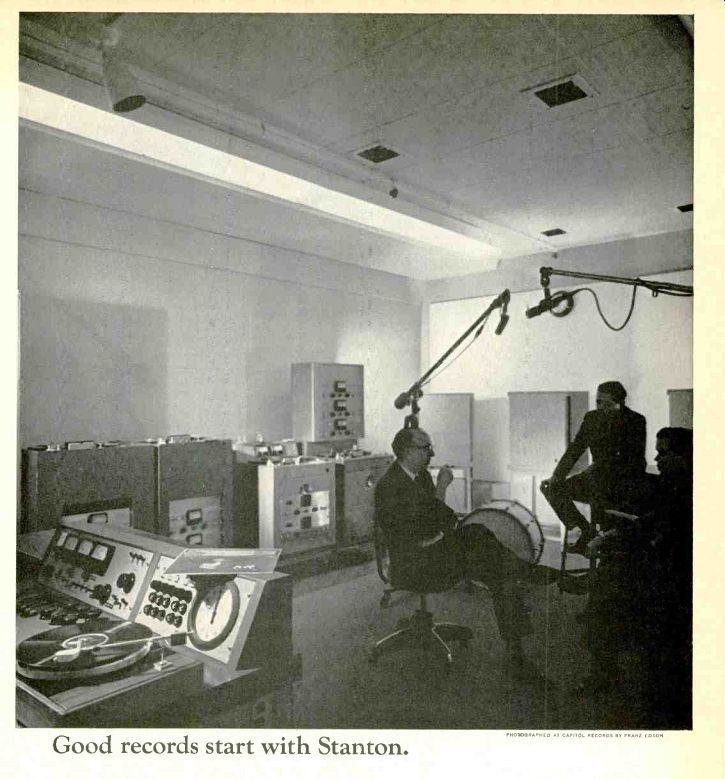
A professional needs to know for sure. When he listens to a test pressing, he needs a cartridge that will reproduce exactly what has been cut into the grooves. No more, no less. Otherwise he would never be able to control the final product. The record you buy in the store.
That's why the professionals keep using Stanton. It tells them the whole truth, and nothing but.
In the photograph above, studio engineers are shown listening to a test pressing. This is a critical stage in record making. The stereo playback system they are listening through is fronted by a Stanton 581 EL Calibration Standard. (The turntable also happens to be a Stanton. Other fine turntables will work, too.) They're getting the whole message. You'll get it, too, in an upcoming release.
Each Stanton Micro FLUX VALVE Calibration Standard is custom made.
PHOTOGRAPH ED AT CAPITOL RECORDS BY FRATO LOSO each will perform exactly as the original laboratory prototype. We laboriously adjust them until they do. It also means that you will get the same accuracy that the professionals get. Guaranteed.
Stanton Calibration Standards are hard to make. And the price reflects it. $49.50. But that really isn't much to pay for uncompromising accuracy.
Stanton Magnetics, Inc. Plainview, L. I., N. Y. USA.
--------
Also see:
The Skating-Force Phenomenon--Part 1 and 2 (Oct./Nov. 1967)
A Quiet Phonograph Preamplifier (Oct. 1972)
How we test a Phono Cartridge (Aug. 1972)