Manufacturer's Specifications:
System Type: Tower style; three- way, dual-chamber acoustic suspension.
Drivers: Two 6 1/2-in. (165-mm) polypropylene cone woofers, one 6 1/2-in. (165-mm) treated-paper cone woofer/midrange, and one 1-in. hard polymer semi-dome tweeter.
Frequency Response: On axis, 43 Hz to 22 kHz, ±3 dB.
Sensitivity: 87 dB SPL at 1 meter for 2.83 V rms band-limited pink-noise input.
Crossover Frequencies: 80 Hz and 3.3 kHz.
Impedance: 8 ohms nominal (3.3 ohms minimum at 65 Hz measured).
Recommended Amplifier Power: 35 to 200 watts per channel.
Dimensions: 37 in. H x 7 in. W x 12 in. D (94 cm x 17.8 cm x 30.5 cm).
Weight: 44 lbs. (20 kg).
Price: $900 per pair.
Company Address: Now Hear This, 537 Stone Rd., Building E, Benicia, Cal. 94510.
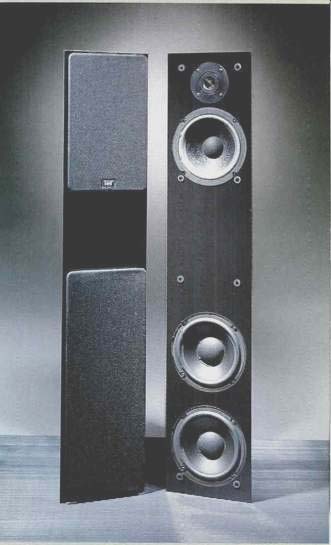
Now Hear This, a not-so-crazy name for a sound company primarily involved in manufacturing loudspeakers, produced the system evaluated in this review. The Model II, even though rated as a three-way system, is unconventional in the sense that it is essentially a small-format, two-way system with added woofers that is housed in a sleek, high gloss black tower structure (also available in oak veneer). The system is deeper than it is wide and stands about 3 feet high with attached stabilizers. These speakers are targeted toward the mainstream consumer rather than the esoteric market. In this market, appearance, value, and good sound for the money are quite important. The Model II's appearance was well liked by all members of my family, including me.
The two most noticeable visual traits of the system are its shiny, black, marble-like finish and its inward-slanted front panel. The 22° slanted front baffle orients the drivers' axis inward, towards the center of the listening area. This, according to the manufacturer, improves its imaging qualities in a concept NHT calls Focused Image Geometry. The design is said to minimize excessive side-wall reflections and reduce "interaural cross-correlation" and thereby maintain a consistent soundstage and stereo perspective throughout a broad listening area. Because of the slanted baffle, the speakers are only sold in mirror-image pairs.
The Model II is a direct descendant of NHT's first product, the compact, two-way bookshelf Model I system, which was released in 1987, and it uses many of the same components as the Model I. Kenneth L. Kantor, a founding partner of NHT (formerly of Acoustic Research, NAD, and Proton), is NHT's primary designer and was the driving force behind the Models I and II. (Kantor, no stranger to the pages of this magazine, has written a number of informative Audio articles. His "Speakers by Design," published in November and December 1988, is particularly informative and shows some of the trade-offs a system designer must juggle to come up with a workable design.) Small-format, two-way loudspeaker systems have always had a reputation for very good pinpoint imaging and stereo soundstage capabilities, due primarily to their small size and simplicity. Using a single driver to cover the entire low and middle frequency ranges eliminates the problems of a crossover point that invariably ends up in the critical mid band region of 250 Hz to 1 kHz. Unfortunately, the bass response suffers in this format because of small physical size. The Model II essentially gets around this problem by melding a small two-way system with an acoustic-suspension bass system containing two small high-excursion woofers, and then packaging the whole in a tall, narrow tower.
The system can be thought of as a small two-way system sitting on its own built-in "subwoofer and speaker stand," as NHT points out. In the last few years, another logical solution to this dilemma has grown very popular, the three-piece design that uses two small satellites with a separate woofer or subwoofer.
The two bottom woofers of the system have the air-moving capability of a 10-inch-diameter woofer but with the width of only a 6 1/2-inch woofer. This allows the Model II to maintain the narrowness of a typical, small-format, two-way system but have the bass response of a larger, wider system. The two bottom woofers are only active in the bottom octave of operation, from 40 to 80 Hz. The upper woofer/midrange, rather than being rolled off as the bottom woofers come into operation, is actually used most of the way down and only rolled off below 45 Hz. From 45 to about 80 Hz, all three woofers are operating essentially in parallel.
The crossover uses a minimalist approach, using the fewest possible components. Most filters are essentially first-order, 6-dB/octave designs with a single capacitor or inductor--except for the dual woofers' low-pass filter, which is a second-order, 12-dB/octave type. The upper crossover, between the woofer/midrange and tweeter, effectively has only a high-pass filter on the tweeter. (Electrical drive measurements of the woofer/midrange revealed that its series inductor was only attenuating the response by about 6 dB at 20 kHz.) The natural acoustic roll-off of the woofer/midrange is relied on to provide the low-pass action. In support of this design, Kantor states: It is my experience that well-controlled driver motion (damping, transient response, phase linearity) is best achieved when the most direct electrical path to the power amplifier is maintained, i.e., the simplest crossover possible. This approach, rather than lowering net cost, simply shifts the burden of spectral accuracy to the drivers themselves.
Read on later to see how well this design approach worked for the Model II. Because each speaker is quite tall, somewhat top-heavy, and only takes up about 1/2 square foot of floor space, the Model II is somewhat unstable and inclined to fall sideways.
To improve lateral stability, NHT provides two sets of steel stabilizer base frames, attachable to the bottom of the cabinets, to increase the width of the base of the enclosure to 13 inches. These base frames are an absolute necessity if the speaker systems are used on carpet, in particular where children live.
As stated before, the most eye-catching feature of the Model II is the hard, shiny black outside finish. The system is finished on all six cabinet surfaces. The surface treatment is achieved by applying a 1/16-inch-thick, high-pressure black laminate over medium-density, 3/4-inch-thick fiberboard. No internal cabinet bracing was evident. The non-square configuration of the cabinet and the internal divider separating the top chamber from the bottom served very well to strengthen the cabinet. Only one mild side-panel resonance could be detected, at 450 Hz, on the bottom half of the narrow side of the cabinet.
A rear panel contains the recessed, double-banana, five way binding-post connectors along with an internally mounted p.c. board for the crossover. The crossover contains six components: Two inductors (one large iron-core and one smaller air-core), three capacitors (one quite large and two smaller), and one power resistor. I did not remove the crossover to trace its circuit, due to removal difficulties. No tweeter level control is provided (or needed). All drivers are flush-mounted and centered horizontally on the front baffle. The tweeter is mounted on the top of the front baffle, with the woofer/midrange just below. The two extra woofers are mounted one on top of the other using the bottom internal two-thirds of the cabinet as a closed-box enclosure. Removal of the top two drivers revealed individual magnetic shielding on each. The tweeter used a second ring magnet, reversed and glued on the rear of the first, to cancel its magnetic field. The woofer/midrange actually had a covered magnet assembly somewhat similar to that on old speakers with Alnico-5 magnets. The bottom two woofers had identical, unshielded magnets much larger than that of the top woofer/midrange.
Each system has two removable grilles made of stretch fabric covering a molded plastic frame. Each frame has molded projections on the rear that mate with corresponding rubber grommet-filled holes on the cabinet's front baffle.
Measurements
The Techron TEF System 12 Plus analyzer, which uses the late Richard Heyser's technique of Time Delay Spectrometry (TDS), was used for most of the measurements in this review. The measurements were performed at several locations including my own new listening room, Crown International's microphone test chamber, and outdoors on my driveway. Evaluation methods included elevated free-field, near-field, and ground-plane techniques.
The measurement of system on-axis frequency response was done at an actual distance of 2 meters, on an axis halfway between the tweeter and the upper woofer/midrange driver, normal to the front baffle (not in a direction parallel to the sides of the cabinet). The input level was 2.83 V rms, which corresponds to a level of 1 watt into the manufacturer's nominal 8-ohm rated impedance. The on axis response was corrected to the standard distance of 1 meter for display of the data. The parameters of the measurement and resultant post-processing were set so that the data was essentially smoothed with a tenth-octave filter.
Raw data was transferred from the TEF System 12 Plus to a Macintosh computer via serial link for post-processing and graphing. Most of the graphs and associated processing were done with a new Macintosh program called Igor, from Wave-Metrics of Lake Oswego, Oregon. (Igor is a general-purpose graphing and data analysis tool with a lot of power. I highly recommend it.) Figure 1 shows the on-axis, 1-watt, 1-meter frequency response of the Model II. The speaker exhibits a reasonably flat response from 50 Hz to 20 kHz (±2.5 dB), with some mid- and high-frequency roughness between 2 and 10 kHz.
This is especially true with the grille on. Mounting the grille produces modest additional response variations of roughly +1 and-3 dB in the range above 3 kHz. The grille's main effect is to add two shallow, half-octave dips in the response at about 3.5 and 8 kHz. Figure 1 also indicates an average midband sensitivity of approximately 87 dB SPL, which matches the manufacturer's rating.
A separate test, comparing the axial response of both right and left speakers (not shown), yielded a not quite-so good match of about ± 1.5 dB over the frequency range from 100 Hz to 15 kHz. The right speaker was approximately 1 to 1.5 dB hotter than the left above 2 kHz while being lower than the left by about 1 dB below 1 kHz.
Near-field measurements (not shown) revealed the response of the Model II's woofers. The response of the upper woofer/midrange extended down from the tweeter crossover to 65 Hz, where it rolled off at 18 dB/octave. An additional 6-dB/octave roll-off for the upper woofer was provided by a series capacitor. Its response had a slight, 1.5-dB hump at 75 Hz before rolling off at lower frequencies. The lower woofers, wired in parallel, exhibited a symmetrical bandpass response centered at 56 Hz, with a bandwidth of 31 Hz extending from 45 to 76 Hz at the 3-dB-down points.
This represents a band pass O of about 1.8 (center frequency divided by bandwidth, which is approximately equal to 56 divided by 31). Roll-off was 12 dB/octave above and below the 3-dB-down points. The manufacturer states that "the dual woofers operate over a relatively narrow band designed to complement and effectively equalize the upper portion of the system."
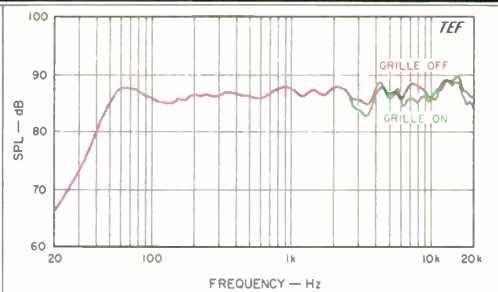
Fig. 1--On-axis frequency response.
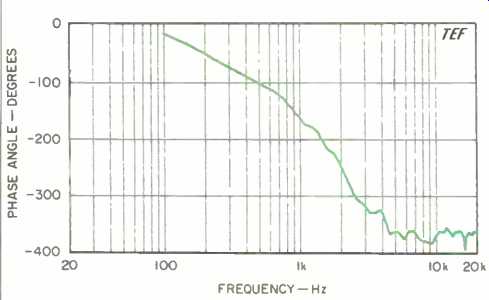
Fig. 2--On-axis phase response, corrected for tweeter arrival time.
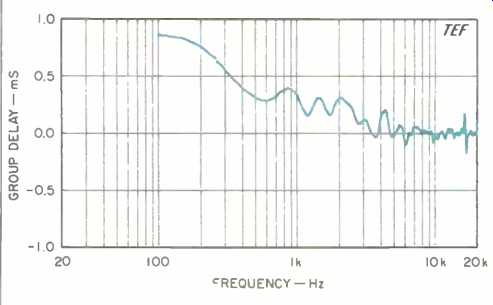
Fig. 3--Group delay corresponding to phase response of Fig. 2.
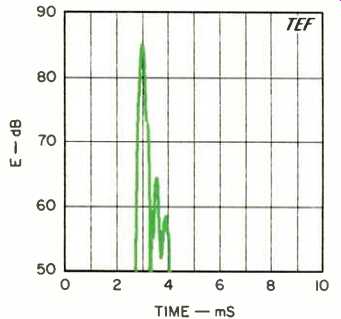
Fig. 4--One-meter on-axis energy/time curve, measured with grille off.
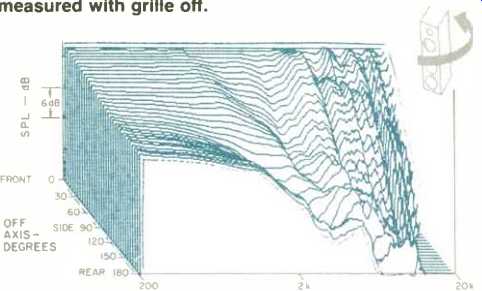
Fig. 5--Horizontal off-axis responses, taken from the front, around the
side, and to the rear of the speaker and normalized to the on-axis
response; see text.
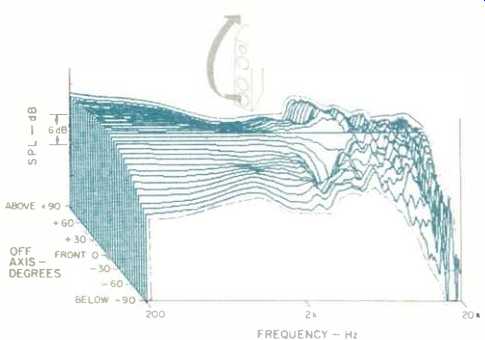
Fig. 6--Vertical off-axis responses taken from below, up the front, and
to the top of the speaker.
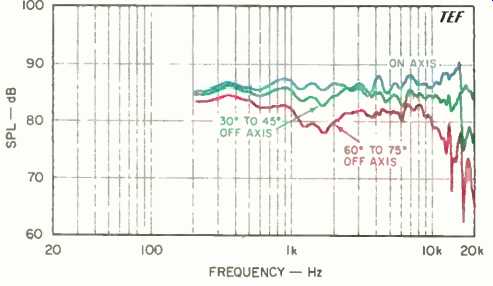
Fig. 7--Mean horizontal response, derived from data of Fig. 5; see text.
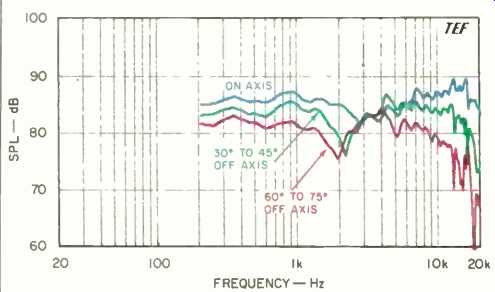
Fig. 8--Mean vertical response, derived from data of Fig. 6.
The woofers' excursion capabilities and frequency dependence were assessed by sweeping with a constant voltage sine wave covering the low-frequency range. As the frequency was swept down from 200 Hz, the upper woofer/ midrange reached an excursion maximum at 70 Hz. At this frequency, the lower woofers had a displacement of about 33% of the upper. Equal excursion between upper woofer and lower woofers was attained at about 60 Hz. At 50 Hz, the bottom woofers attained their maximum. At this frequency, the excursion of the top woofer/midrange was about 75% of the bottom woofers'. At lower frequencies, the upper woofer's excursion diminished in direct proportion to the lowering of frequency. The bottom woofers' excursion, however, reached a plateau of about 60% of its maximum no matter how low the frequency. At 40 Hz, even with the series capacitor, the excursion of the top woofer was about half that of the bottom woofers.
The top woofer also exhibited a significant amount of "dynamic offset" or "oil canning" effect in the range from 60 to 100 Hz, above 7 V rms. The bottom woofers were clean of this distortion. (See Audio, September 1989, page 90, for more information on the "oil-can effect.") The maximum linear excursion capability of the top woofer/midrange was about ±0.2 inch (0.4 inch peak to peak), while the bottom woofers' capability was about ± 0.25 inch (0.5 inch peak to peak). Both drivers had effective radiating diameters of about 5 inches.
Figure 2 shows the on-axis phase response of the system, corrected for the arrival time of the tweeter signal. Figure 3 shows the related group delay versus frequency for the phase curve of Fig. 2. The group delay indicated that the woofer trails the tweeter by about 0.14 mS (140 µS), which corresponds to a distance of 1.9 inches (48 mm). At the crossover of 3.3 kHz, this offset represents approximately 0.46 wavelength, or 170°. The 1-meter, on-axis energy/time response (ETC) is shown in Fig. 4 for a test signal swept over the range of 200 Hz to 10 kHz. The response is good except for a few minor delayed peaks some 20 dB below the first arrival peak. Be mindful of the fact that this ETC represents essentially the tweeter's response only and emphasizes energy in the range of 2 to 9 kHz.
The off-axis response of the system was measured in three different ways. The first method displays the data in a three-dimensional format similar to the one seen in Audio loudspeaker reviews for the last few years. The second method closely follows the way the on- and off-axis response curves were measured and derived at Canada's National Research Council test facilities (see page 75 of the September 1989 issue for more information). The third method I used in evaluating off-axis system response displays the data in a polar format, showing how level changes with direction at a particular frequency.
Figures 5 and 6, respectively, show the "3-D" horizontal and vertical off-axis frequency response curves of the Model II. These curve sets were derived from measurements made at 5° increments along the major horizontal and vertical planes of the system. No additional smoothing was done on these curves except for the fairly high-resolution, 300-Hz, constant-bandwidth smoothing that results from the TDS data gathering process. Note that these plots have a logarithmic frequency scale and that all curves have been referenced (normalized) to the on-axis frequency response. As a result of the normalization, the on-axis response curve is a straight line. The normalized format is beneficial because it clearly indicates the differences between the on- and off axis curves.
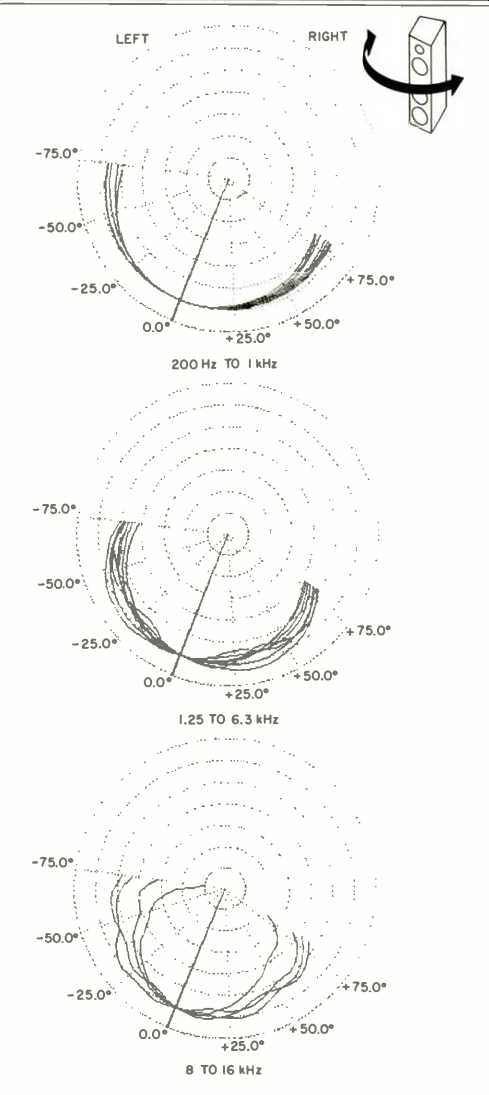
Fig. 9-Horizontal composite polar responses, measured at right angles
to the speaker's front panel.
The offset angle of the 0.0° line corresponds to the front panel's offset from the cabinet walls.
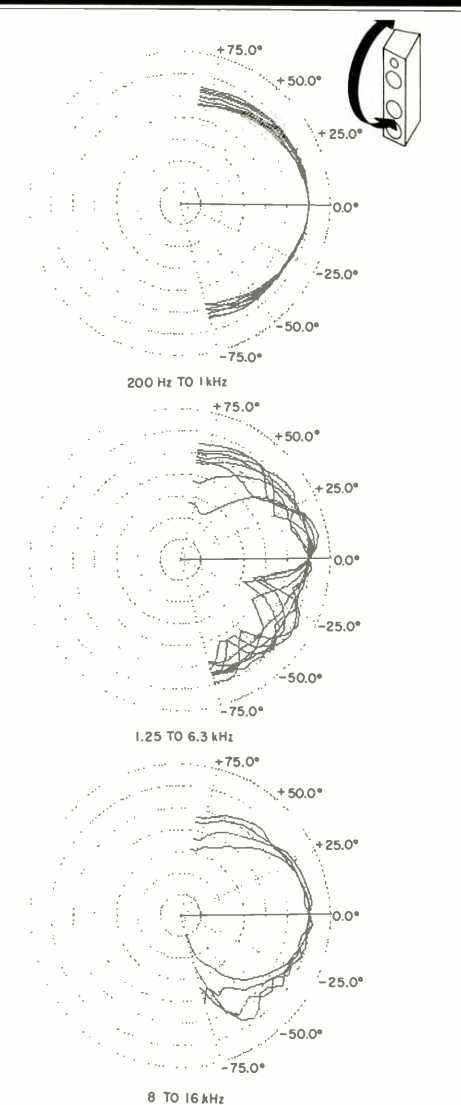
Fig. 10-Vertical composite polar responses.
The horizontal "3-D" off-axis curves in Fig. 5 indicate well-behaved off-axis behavior with wide, high-frequency coverage up to 12.5 kHz and out to about 50° off axis.
The vertical off-axis curves in Fig. 6 clearly indicate the effects of the crossover in a wide, two-octave range extending from 1.5 to 6 kHz. An off-axis null zone exists in the region from 2.5 to 4.5 kHz at angles between 10° and 20° below axis. At corresponding angles above the axis, a moderate peak in the response is evident in the same frequency range. The 51/2-inch (140-mm) center-to-center spacing of the tweeter and woofer corresponds to about 1.3 wavelengths at the 3.3-kHz crossover frequency.
The asymmetrical up and down behavior of the vertical frequency response indicates that the woofer and tweeter are somewhat acoustically out of phase in the crossover region. This denotes a moderate amount of "lobing error" in the crossover frequency response. A separate measurement of tweeter and woofer/midrange individual phase magnitude responses (not shown) revealed that the drivers were about 30° to 45° out of phase between 2.5 and 3.5 kHz.
The phasing was such that the unavoidable crossover directional lobe was aimed upwards at about 12°. In this situation, the lobing error worked to the designer's advantage in smoothing the frequency response for upward angles at the expense of downward angles. If you frequently lie on the floor while listening to your system, this may not be the design choice for you.
The separate tweeter and midrange measurements also disclosed that the roll-off rates (electric and acoustic) in the crossover region between 1.5 and 5 kHz were approximately 6 dB/octave. This indicated why the crossover region covered such a wide frequency range, with its related irregular response behavior.
Electrical measurements of the crossover voltage drive established that the tweeter was rolled off below 3 kHz at 6 dB/octave. The woofer/midrange drive had a 6-dB/octave roll-off below 50 Hz and was allowed to run essentially on its own at all higher frequencies. (Apparently the series inductor on the woofer/midrange wasn't doing much because the electrical drive only fell at about a 1-dB/octave rate from about 1 to 20 kHz, where the total attenuation was only about 6 dB.) The lower woofers, wired in parallel, had, a 6dB/octave roll-off above 50 Hz, changing gradually to a roll off of 12 dB/octave at higher frequencies.
Figures 7 and 8, respectively, show the mean horizontal and vertical on- and off-axis responses, measured and derived in the manner of the NRC tests. These responses were derived from the previous "3-D" data by calculating response averages of several adjacent curves in specific on- and off-axis angular regions. This spatial averaging (rather than frequency averaging or smoothing) tends to suppress the effects of localized response aberrations, due to diffractive effects, without minimizing overall response problems exhibited over broad angles. In a departure from the NRC test methods, mean axial responses were calculated separately for horizontal and vertical planes by averaging all the individual responses in a ± 15° window. The mean off-axis responses were computed separately in both the horizontal and vertical directions from the ±30° to ±45° and ± 60° to ± 75° off-axis curves.
The mean horizontal response curves are shown in Fig. 7.
The mean axial horizontal response curve is fairly flat, although somewhat rough, falling within a ±3 dB envelope out to 20 kHz (±2 dB if the peak at 16.8 kHz is excluded). This curve represents the average frequency balance within ± 15° of the axis horizontally but on-axis vertically. The slightly choppier 30° to 45° response fits in a fairly tight envelope of ±2.5 dB out to 16.5 kHz. The 60° to 75° response is still not too bad out to 10 kHz, where the level drops quite rapidly with increasing frequency. Evident in all the curves is a tweeter high-frequency resonance occurring at 16.8 kHz.
The 60° to 75° response is representative of the spectrum of the sound energy that is reflected off the side walls in a typical listening room. If this response were quite uneven, it could contribute to making the image wander from side to side with frequency. The fairly smooth wide-angle response of the Model Its means that they should image quite well over a broad horizontal listening area. The off-axis horizontal curves exhibit the effects of box-diffraction narrowing from 1 to 2 kHz. In this range, the box is approximately 1/2 to 1 wavelength wide.
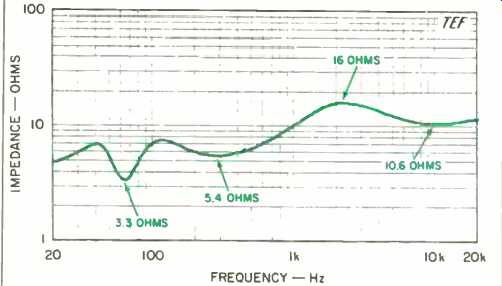
Fig. 11--Magnitude of impedance (see text); note the logarithmic impedance
scale.
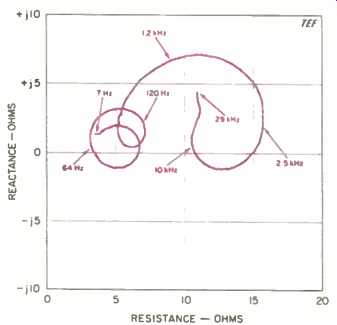
Fig. 12-Complex impedance, showing reactance and resistance vs. frequency.
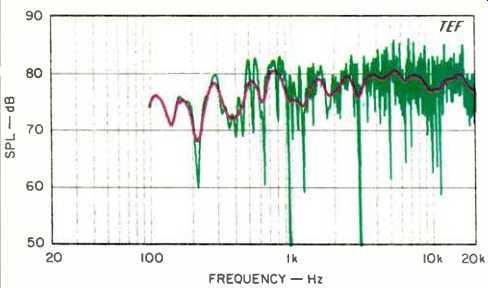
Fig. 13-Three-meter room response, showing both raw and smoothed data;
see text.
The mean vertical responses are shown in Fig. 8. The mean axial vertical response curve is not as flat as the mean axial horizontal response curve due to crossover effects from 1.5 to 6 kHz. The interference effects of the lobing error just below the axis, included in the ± 15° averaging, affect the mean axial vertical response curve quite strongly. The mean off-axis curves, although somewhat similar to the horizontal curves, include crossover dips in the 2-kHz range. The 60° to 75° mean response represents the spectrum of the sound energy that is reflected off the floor and ceiling in a typical listening setup. An uneven vertical response, at large angles up and down, may cause an image to shift up or down with frequency because of differing amounts of reflective energy at different frequencies.
Figures 9 and 10 show, respectively, the horizontal and vertical off-axis behavior of the Model II in a polar format.
These curves show how the level changes with direction at a particular frequency over the angular range of about ± 75°. All curves have been referenced (normalized) to the on-axis level and are shown for all the third-octave center frequencies in the range of 200 Hz to 16 kHz. For each Figure, three composite polar plots are shown: Low to middle frequencies (200 Hz to 1 kHz), the crossover region (1.25 to 6.3 kHz), and high frequencies (8 to 16 kHz). An omnidirectional response, exhibiting no change of level with direction, would be a perfect circle centered at the origin. A so-called constant-directivity speaker, even though having noncircular polar curves, would have curves that do not change with frequency, i.e., the shapes would be the same at all frequencies.
Figure 9 shows the horizontal composite polar plots, which are quite well behaved over the complete frequency range. Broad, even coverage is exhibited at most frequencies. Narrowing is exhibited in the crossover range due to box diffraction and exhibited at high frequencies due to tweeter directivity.
The vertical composite polar plots, shown in Fig. 10, are quite well behaved below 1 kHz and above 8 kHz. However, the crossover range of 1.25 to 6.3 kHz is quite uneven and exhibits many lobes. These unavoidable response variations are due to the physical displacement of the midrange and tweeter; as noted before, the units are separated by about 1.3 wavelengths at crossover. Note the response dips of 10 to 15 dB just below axis and the drastically changing level with angle. Note also the absence of such response dips at angles between 0° and 25° above the axis.
Clearly seen in the middle plot of Fig. 10 are the effects of lobing error (midrange and tweeter somewhat out of phase at crossover), which aims the lobe at crossover 10° to 15° above the axis. The designer is only free to change the direction of the main lobe at crossover by manipulating the drivers' relative phasing. A system exhibiting no lobing error would have its lobe facing straight ahead. Other relative phasing of the drivers will shift the lobe direction up or down. In the Model II, the designer has chosen to aim the lobe slightly upward, thus maximizing on-axis and above axis frequency response at the expense of below-axis response. The shape of the lobe and its angular width depend primarily on the center-to-center spacing of the drivers, a parameter the designer does not have much control over.
Figure 11 shows the input impedance of the Model II plotted over the range from 20 Hz to 20 kHz and with a logarithmic vertical scale covering 1 to 100 ohms. A minimum impedance of 3.3 ohms at 65 Hz and a maximum of 16 ohms at 2.2 kHz was measured in the operating range of the system. Though the Model II is rated at 8 ohms, the 3.3-ohm minimum impedance reached in the bass range makes paralleling two sets of these systems a possible risk for most amplifiers--especially at high bass levels.
What appears to be the low-frequency, double-humped impedance characteristic of the vented-box cabinet is in reality the result of the Model II's crossover network combining the response of the three closed-box woofers. At the point of lowest impedance, 65 Hz, all three woofers are operating and are essentially in parallel.
The complex magnitude-phase (Nyquist) polar plot of the impedance is shown in Fig. 12. The polar curve is quite well behaved. No minor loops are exhibited, which indicates no spurious higher-order resonances in the cabinet or woofer drivers. The maximum positive (inductive) phase angle of 38° is attained at 900 Hz; the maximum negative (capacitive) phase angle of -14° is reached at 52 Hz. These moderate maximum phase angles will present no problems to most amplifiers.
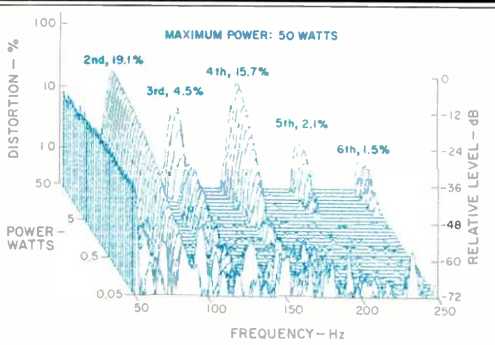
Fig. 14--Harmonic distortion products for the tone E1 (41.2 Hz).
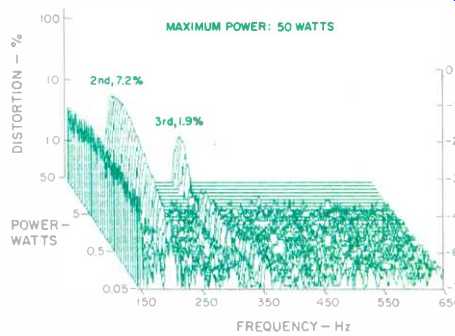
Fig. 15--Harmonic distortion products for the tone A2 (110 Hz).
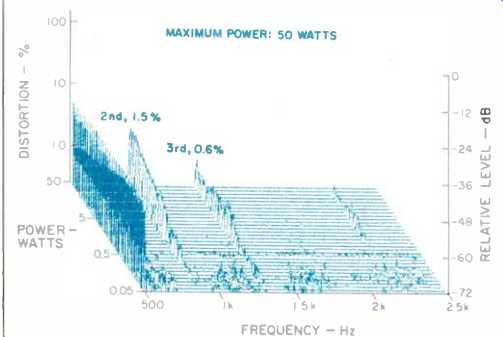
Fig. 16--Harmonic distortion products for the tone A4 (440 Hz).
Figure 13 shows the 3-meter room curve of the right-hand system when it was placed in the normal listening position in my new listening room. The test microphone was placed at ear level on the sofa where the listener normally sits. The system was swept from 100 Hz to 20 kHz with a 2.83-V rms sine-wave signal, equivalent to 1 watt into 8 ohms. The resultant SPL generated can be read directly off the graph. Also shown is a sixth-octave smoothed curve.
The parameters of the TDS sweep were set so that the direct sound and 13 mS of the room's reverberation were included. This amount of room sound represents approximately the effective averaging of the human ear, with its emphasis on the direct sound plus early energy arrivals. In general, the curve is not too ill behaved except for a peak at 800 Hz and a depression in the lower ranges, presumably due to room effects. The effect of the floor-bounce reflection is clearly seen at about 220 Hz. I am going to reserve final judgment on this curve until I get more experience with other systems measured in this new room.
The distortion characteristics were measured in two different ways-by performing three single-frequency distortion spectra versus power level and by running an IM distortion measurement versus power level.
Figures 14, 15, and 16 show, respectively, the single frequency harmonic-distortion spectra versus power level at the musical notes of E1 (41.2 Hz), A2 (110 Hz), and A4 (440 Hz). These curves indicate how much harmonic distortion is generated by the Model II with the application of a single frequency sine wave at power levels covering the range from 0.05 to 50 watts (-13 to 17 dBW, a 30-dB dynamic range). The power levels were computed assuming the rated impedance of 8 ohms.
The curves were run by successively increasing the sine wave input level in 1-dB increments (each step about 26% higher in power than the previous level). At each power level, a swept spectrum analysis was done over a frequency range covering up to the fifth or sixth harmonic. Two precision 1-dB/step attenuators were used in the setup-one in the send path and one in the receive path-to ensure that the steps in power level were accurate. The receive attenuator provides a constant fundamental level to the spectrum analyzer so that distortion percentages can be directly read off the plotted data scales.
Figure 14 shows the harmonic data for E1 (41.2 Hz). The non-harmonically related spikes at lower power levels are byproducts of the measurement setup's background noise and are not generated by the loudspeaker. At most power levels, the second and fourth harmonics were found to predominate. At this frequency, the distortion was generated primarily from the high excursion of the system's dual woofers.
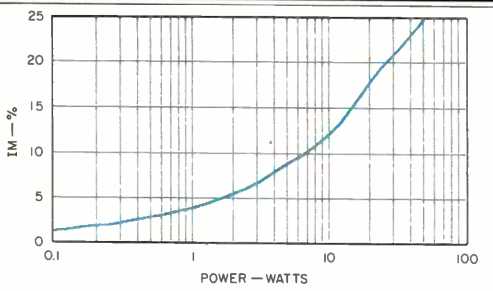
Fig. 17--IM distortion on 440 Hz (A4) produced by 41.2 Hz (E1) when
mixed in one-to-one proportion.
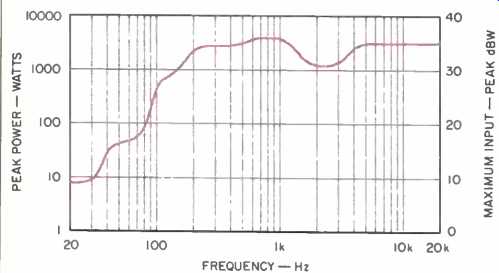
Fig. 18--Maximum peak input power vs. frequency; see text.
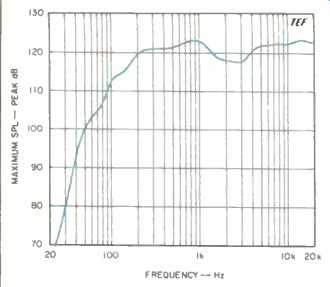
Fig. 19--Maximum peak sound output, measured at 1 meter on axis, for
the input levels shown in Fig. 18; see text.
Separate near-field waveform measurements, comparing the top woofer/midrange with the bottom woofers, revealed that most of the distortion was being generated by the top woofer/midrange. The top woofer's waveform was highly distorted in one direction, with appreciable fourth harmonic visible in the waveform. The bottom woofers' waveforms were quite clean in comparison. A one-sided asymmetrical distortion mechanism generates high levels of second and higher even-order harmonics. This means that the top woofer was running out of excursion capability quite heavily in one direction.
The harmonic data for A2 (110 Hz) is shown in Fig. 15. The data shows that only the second and third harmonics were significant. The second harmonic increased gradually with power, reaching a level of 7% at 50 watts. The third harmonic was quite low over most of the range and reached a level of 1.9% at 50 watts.
Figure 16 shows the harmonic measurements for A4 (440 Hz). Again, the predominant distortion is a low amount of second and third harmonics, with only a very small amount of fifth harmonic.
Figure 17 shows the IM distortion on a 440-Hz (A4) tone created by a 41.2-Hz (E1) tone of equal input power. The IM distortion gradually rises with power, reaching a level of about 18% at 20 watts and 25% at 50 watts. The first-order (f2 ± f1) and second-order (f2 ± 2f1) side frequencies contributed most to the measured total distortion, but IM products out to the fifth order were contributors. These IM levels are moderately high for a system having a combined woofer size equivalent to a woofer 10 to 12 inches in diameter. As before, near-field measurements revealed that most of the distortion was being generated by the top woofer/ midrange.
Overall, the distortion measurements on the Model II are quite low for a system of this size, with the exception of IM. A high level of IM distortion is objectionable because it modifies the reproduction of upper frequencies when they coexist in music with high-level, low-frequency signals. It can cause a muddiness of mid- and upper-range reproduction and a masking of inner voices. (For more information, refer to several good papers by Paul Klipsch on modulation distortion in the April 1969, February 1970, and December 1972 issues of the Journal of the Audio Engineering Society. These and other highly recommended writings by Mr. Klipsch are available from Klipsch and Associates, Hope, Ark. 71801.) Figures 18 and 19 show the short-term, peak-power input and output capabilities of the system, as a function of frequency. The tests were run by applying a shaped tone burst test signal consisting of 6 1/2 cycles of a sine wave, shaped using a Hamming raised-cosine envelope. The resultant test signal covers a third-octave bandwidth, and its time duration increases as frequency goes down. The burst is presented at such a low duty cycle that the long-term thermal characteristics of the speaker under test are not exercised. The test consisted of evaluating the maximum peak input power-handling capacity and maximum output peak sound pressure levels, at all the third-octave center frequencies in the range from 20 Hz to 20 kHz. A very powerful amplifier, capable of generating 5,500 peak watts (+37 dBW!, ±210 V into an 8-ohm load), was used to drive the system. The peak input power was calculated by squaring the measured peak driving voltage and dividing by the rated 8-ohm impedance.
The test sequence consisted of determining how much of the special signal could be handled by the speaker, at each frequency, before the output sounded audibly distorted or the acoustic output waveform appeared distorted, whichever occurred first. At each frequency, the maximum peak input voltage and the corresponding generated peak output sound pressure level at 1 meter were recorded.
Figure 18 shows the maximum peak electrical input power-handling capacity of the Model II. The peak input power handling capacity is seen to rise with frequency until about 200 Hz, where it levels out at about 3.2 kW. The knee in the curve at about 75 Hz and the dip at about 2.5 kHz were caused by excursion limitations of the upper woofer/midrange and the tweeter, respectively.
Though the system could not handle any more than about 10 watts below 25 Hz (for moderately clean output), high-level subsonic program material in this range will not cause intermodulation of the higher frequencies due to the highpass filter on the upper woofer/midrange. However, between 40 Hz and 90 Hz, where the majority of bass energy is found in typical program material, the system is primarily limited by the excursion of the upper woofer/midrange because the internal high-pass filter has no effect in this range.
The Model II can actually handle more power than the curves show but at the expense of much greater distortion and possible risk of damage at higher frequencies. Conducting these tests, I actually burned out a tweeter at a level of 180 V peak at 4 kHz. (Gee whiz, the system would only handle 4,000 watts-it's no darn good! Only kidding.) I subsequently limited the level to 160 peak V, which resulted in the high-frequency, 3.2-kW system limitation.
Figure 19 illustrates the maximum peak sound pressure levels the system generated at a distance of 1 meter on axis for the levels shown in Fig. 18. The graph shows that the Model II can generate very respectable peak levels in excess of 115 dB SPL at frequencies above 150 Hz. Between 20 and 100 Hz, the maximum output rises at about 20 dB per octave. Of course, two of these systems operating in a typical listening room will be able to generate much higher levels in this critical low-frequency range, due to mutual coupling and boundary effects. The room provides some 5 to 10 dB of low-frequency gain, while a pair .of systems increases the level some 3 to 6 dB.
Use and Listening Tests
The listening tests were conducted in my new listening room, which, with a volume of about 3,400 cubic feet (43 cubic meters), is fairly large. The room dimensions are approximately 15 1/2 x 27 x 8 feet. The floor is carpeted, and the room has normal living-room style furnishings. The short wall is filled with deep floor-to-ceiling bookshelves and an equipment cabinet. Listening equipment consisted of an Onkyo Grand Integra DX-G10 CD player, a Krell KSP-7B preamp, a Krell KSA-200B power amp, and Straight Wire interconnects and speaker cables. As usual, most of my listening evaluation was done before the measurements were made.
The Model II loudspeakers were placed well out in the room, 6 feet (1.8 m) away from the short wall, and separated by about 8 feet (2.4 m). This left a spacing of about 4 feet (1.2 m) from the side walls. The sides of the systems were parallel to the room's walls, which aimed the systems' axes directly at me due to the slanted configuration of the cabinet's front baffle. Most listening took place on the sofa, about 10 feet (3 m) away.
My first impression of the systems was quite favorable because they did a good job in filling my new, larger listening room with a broad, well-defined, controlled soundstage.
The stereo imaging was quite precise, and lateral orchestral instrument placement was very good. The speakers also had no trouble reaching very respectable levels on program material that demanded it.
The NHT systems did a good job on solo soprano voice but were a bit crisper on high frequencies than my reference system when playing The English Lute Song (Julianne Baird and Ronn McFarlane, Dorian DOR-90109). A fine sense of air and detail was demonstrated on the delicate high-frequency bell and percussion sounds on track 6 of David Chesky's Club de Sol (Chesky JD33). The reproduction of male vocals and harmonies on Papa Doo Run Run's California Project, which includes a very good Beach Boys simulation (Telarc CD-85501), revealed a smooth upper bass and midrange character.
The low bass below 40 Hz was definitely lacking, however, as compared to my reference systems. This was judged by playback of the 20-, 25-, and 31.5-Hz third octave band-limited pink-noise tracks on the Brüel & Kjaer Pro Audio demo disc (CD-4090). In the next higher octave, between 40 and 80 Hz, where the major bass energy in typical program material is found, the NHT speakers did a very respectable job. Reproduction of the proverbial Telarc bass drum on the "Poet and Peasant Overture" (William Tell and Other Overtures, CD-80116) sounded as powerful as ever. The kick drum on The Sheffield Track and Drum Record (CD-14/20) did not quite have the gut punch of my reference systems but was still very satisfying. The NHTs did do an excellent job on the high-level dynamics and transients of the drum solo on track 5 of the Sheffield disc.
Playback of high-level, band-limited noise between 50 and 100 Hz did reveal some distressed clicking sounds which were generated by the upper woofer/midrange. Some unevenness in the bass line and a slight one-note bass characteristic on the acoustic guitar and double bass of track 12 of the Stereophile Test CD (STPH-002-2) were noted. Some muddiness of choral vocals was heard on track 7 of the same disc when high-level pipe organ pedals were played.
On pink noise, the system passed the walk-around, stand-up, sit-down test to check evenness of coverage. However, upper-midrange roughness and changes in spectrum were heard when moving up and down. Minimal differences could be heard on piano reproduction when compared to my reference systems, and the NHT speakers had good lower register reproduction and impact (B & K CD, track 4). The Model II did an excellent job, at high levels, reproducing the live jazz club ambience and kick drum on "Count Down" from Dave Grusin and the NY/LA Dream Band (GRP GRD-9501). In conclusion, the Model II speakers yielded excellent stereo imaging and lateral soundstaging along with a smooth, coherent upper bass and midrange. The high frequency reproduction, although a bit on the bright side, was very listenable and revealing of program material. The bass reproduction, despite exhibiting somewhat higher distortion than it could have, was quite capable and did justice to most of what I listened to. Only aficionados of large, room-shaking subwoofers would be disappointed in the NHT's lower-octave bass response. The compactness, performance, striking physical styling, and innovative design features of the Model II make it a desirable system to own.
-D. B. Keele, Jr.
(adapted from: Audio magazine, Jul. 1990)
Also see:
N.E.A.R. 15M Speaker (June 1997)
Ohm Walsh 5 Loudspeaker (Jun. 1988)
Link | --NHT Pro A-20 Speaker System (Sept. 1999)