VOM's and VTVM's are designed to measure AC voltage, but their accuracy of measurement will depend on the AC frequency. VOM's have built in rectifiers to convert the alternating current to direct current since direct current is required to operate the meter movement.
They are calibrated to read with accuracy (usually ±3%) at 60 Hz, with a drop-off in accuracy at higher frequencies. The manufacturer's specs will state the range of frequencies, which sometimes includes the entire audio range (beyond 15,000 Hz). You are not likely to find a VOM which will measure radio frequencies.
VTVM's (AC operated or solid state) have internal or external rectifiers. Those with internal rectifiers include frequency-compensation circuits to make accurate readings up to about 3 MHz. For these you can usually buy an external r-f probe that fits over the regular probe.
With the external r-f probe (and with those instruments with the built-on external probe), readings to 250 MHz can be made. External probes convert the r-f current to direct current, and are read on the DC scales.
METER RECTIFIERS
Internal rectifiers follow the series of voltage-multiplier resistors, so value readings can be made as high as the instrument's DC reading capability. However, external probes are limited as to the highest volt age read. The limit is set by the reverse-breakdown voltage of the silicon diodes, or heater-to-cathode breakdown voltage in the case of vacuum-tube diodes. This limit is often around 100 volts. This means that you cannot measure the r-f voltage at the top of the final tank circuit in a transmitter, but 95 percent of r-f voltage measurements can be made.
Because of the loss of some voltage through the rectifier and the need for extra circuitry for frequency compensation, as well as adjustment to make the AC scales match the DC scales, sensitivity on AC is usually lower than on de. This may be a drawback in some high impedance circuit measurements, such as the high-impedance input of an audio amplifier. Most AC measurements are made at low-impedance points, however.
Rectifiers have low conduction at very low currents through them, and for this reason, the instrument will have a separate scale for low range AC readings. At higher ranges the AC readings are fairly linear, and high-range AC scales are the same as the DC meter scales.
Meter rectifiers for alternating current are very much like rectifier systems in power supplies. They may be half-wave, full-wave, or bridge types (Fig. 2-1). Each type provides successively higher sensitivity.
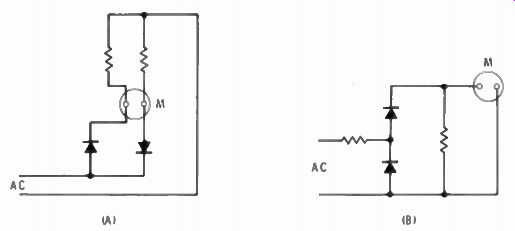
Fig. 2-1. At A two diodes are used in a full-wave meter rectifier circuit.
B shows a half-wave rectifier. The lower diode conducts on the other half cycle
to present a constant load to the AC source.
Sometimes a voltage-doubler system is used for an even higher sensitivity. As in power supplies, capacitors arc frequently used, and when used, charge up to the peak value of the AC waveform. Thus, with VTVM's. the meter actually reads the peak or the peak-to-peak value.
This is important in TV servicing because of the complex waveforms encountered. A half-wave rectifier passes current in one direction of the AC cycle only, so it is a peak-reading meter. A full-wave rectifier and bridge rectifier rectifies both halves of the waveform, and thus is a peak-to-peak reading AC meter. However, the scales are marked in rms values (as well as peak-to-peak). which is the peak-to-peak value times .3535. Keep in mind the rms readings arc only correct for sine wave voltages. Complex waveforms with high peaks will show a higher reading than average alternating current. This is important only when reading voice or random audio-frequency signals. Any meaningful tests of audio amplifiers or modulators should be made with a sine-wave generator supplying the signal.
OSCILLOSCOPES
Because the meter movement in a VOM or VTVM is mechanical it has mass, and therefore has inertia. The needle cannot follow the rapid changes of the AC cycle. An oscilloscope, on the other hand, is electronic. The electron beam scanning the face of the scope tube has no inertia and will travel as fast as internal circuitry will permit.
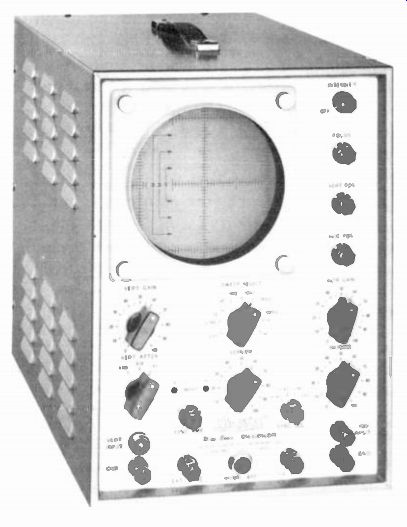
Courtesy Hickok Electrical Instrument Co.
Fig. 2-2. A wideband, high-gain oscilloscope. Vertical amplifier response is within 3 dB to 4.5 MHz. Sensitivity is 40 mV per inch of deflection.
The better the instrument is engineered (and the higher the price), the higher the frequency it can display (Fig. 2-2). The vertical-deflection plates in the cathode-ray tube carry the amplified (or direct) signal voltage to be observed. The horizontal deflection plates carry a repeating linear voltage to sweep the beam across the tube at a fixed time rate. The time rate is selectable from the front panel. As the beam sweeps from left to right at a fixed rate, it also moves up and down following the voltage changes of the signal under observation. Thus, you see the exact appearance of the wave, and all its complexities if there are any. If the signal is a non-changing repeating frequency, and the horizontal sweep is synchronized with it. the signal appears to stand still on the face of the CRT for easy study.
The value of the scope to the amateur is almost exclusively based on the vertical amplifier. Low-priced scopes have a frequency response that is more than adequate to observe any audio frequency, but not radio frequencies. Medium-priced scopes have a response to about 4.5 or 5 MHz. and this will allow direct observation of r-f waveforms in the 3.5-MHz band. Lab-type scopes go much higher in response, but they become very expensive and outside the reach of the average ham. However, the internal vertical amplifier can be bypassed and a direct connection made to the vertical-deflection plate terminals of the CRT. This lifts the limit of frequency, but a fairly high signal level is needed to get any deflection. Some instruments do not provide for direct connection to the CRT deflection plates, but any ham can make his own easily.
Vertical amplifier sensitivity also varies with different scopes. As a rule, the higher the sensitivity (the gain of the amplifier) the lower the frequency response. Sensitivity ratings are in volts or millivolts per inch of deflection (sometimes in centimeters of deflection). For ham use a sensitivity of 1/40 volt per inch 's usually sufficient, although quite low. If you wish to check on low-level speech circuits (such as clippers), you will need a much higher input sensitivity-more like 10 millivolts per inch.
MEASURING FREQUENCY
The instruments mentioned above are for measuring or observing AC voltages. Since frequency is also involved it is frequently necessary to measure the frequency of an unknown AC voltage. Frequencies that hams are interested in measuring are usually in the r-f range. Instruments for measuring the frequency of an r-f AC voltage vary in complexity and cost, depending on the accuracy of the measurement.
The most inexpensive instrument for measuring radio frequencies is the absorption wavemeter (Fig. 2-3). It is simply a tuned circuit to which a rectifier and meter is connected. When the coil is coupled to the r-f source the indicator will show a deflection on the needle when the capacitor is tuned to resonance at the frequency being measured.
The capacitor dial is calibrated in frequency with the coil in use (the coils are usually plug-in). Since only one tuned circuit is involved, the accuracy is low-just about good enough to tell you in what part of the amateur band the radio frequency is.
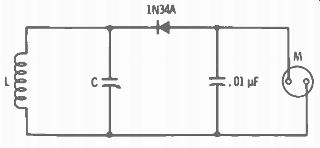
Fig. 2-3. A simple wavemeter for measuring frequency.
L is one of several plug-in coils for covering all amateur hf and vhf bands. C has a maximum capacity of about 50 picofarads.
Accurate frequency measurements on transmitters are made with a heterodyne frequency meter (Fig. 2-4). This instrument includes a precision calibrated oscillator and a detector. The frequency to be measured beats with the internal oscillator and is heard in head phones, and sometimes is shown on a meter. Better instruments include ...
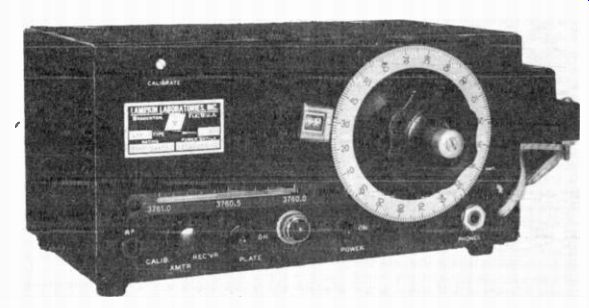
Courtesy Lampkin Laboratories, Inc.
Fig. 2-4. A high-quality frequency meter for making measurements of transmitter frequency between 100 kHZ and 175 MHz. A variable oscillator beats against the incoming signal. A built-in crystal oscillator is a calibration standard.
... crystal oscillators for use in setting the local adjustable oscillator to exact frequency. These instruments are sometimes called secondary frequency standards, in that the crystal oscillator can be adjusted precisely by beating it against WWV. the National Bureau of Standards precision transmitter in Ft. Collins, Colorado.
THE GRID-DIP OSCILLATOR
The handiest instrument for the amateur (and inexpensive too) is the grid-dip oscillator (Fig. 2-5). It is a resonant circuit like the wavemeter but includes the resonant circuit in an oscillator using a vacuum tube, transistor, or tunnel diode. An indicating meter is connected to the grid of the vacuum tube, to the base of a transistor, or to the load resistor in series with the tunnel diode. The GDO will measure frequency in your transmitter with its power off. When the GDO is coupled to a coil-capacitor circuit and made to resonate with it, energy is absorbed from the GDO by the coupled circuit. When this happens the DC voltage at the grid drops, and the meter needle shows a lower reading. The name of the instrument comes from this action.
Fig. 2-5A. A commercial high-quality grid-dip oscillator. Its accuracy is
much higher than is normally avail able from a kit or home-built unit. Courtesy
James Millen Mfg. Co., Inc.
The needle takes a dip when the GDO is resonant to the tuned circuit to which it is coupled. Most GDO's include a phone jack. With head phones plugged in, the instrument acts like a regenerative detector and a beat note will be heard when the GDO is resonant with an r-f volt age. This action is like that of the heterodyne frequency meter, but, as with the absorption wavemeter, accuracy is comparatively low. Its greatest value is in experimental work for matching coils and capacitors to resonate at a desired frequency.
The GDO is also a signal generator, although it lacks the refinements of a good one. It can also be used to feed an impedance bridge for checking antenna feeders--more about this in a later section.
ALTERNATING-CURRENT MEASUREMENTS
While the VOM measures direct current, and all of the instruments mentioned at the beginning of this section measure both de and ac volts, none measure alternating current directly. Alternating current ...
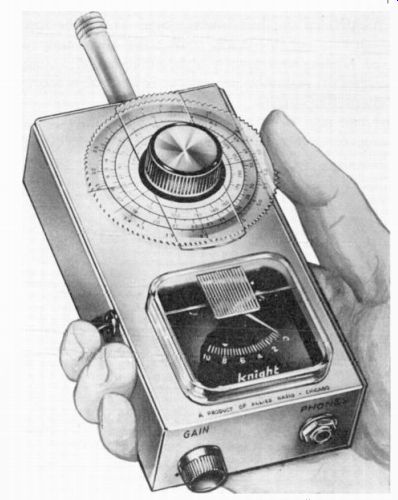
Courtesy Allied Radio Corp
Fig 2-5B. Low cost grid-dip oscillators are available in kit form. The Knight Kit shown here is one. By listening to its signal in a calibrated receiver, the adjustable cursor can be set to give fairly good accuracy.
... can be measured by measuring the voltage across a resistor in series with the current (Fig. 2-6), and using Ohm's law. Ohm's law says:
E=I/R
The voltage measured across a resistor divided by the value of the resistor is the current through it. The instrument should be set for the lowest AC voltage range, and the resistor should be as low a value as possible. When measuring r-f current, the resistor must be noninductive.
When current values are low and it is necessary to use a high value of resistance to get a decent reading, another problem arises. The very high-impedance inputs of VTVM's will pick up stray alternating currents when operated on their lowest range. When the instrument is across a high value of resistance, some stray alternating current can increase the reading and give a higher-than-actual voltage reading across the resistor. A low-value resistor is kind of a short circuit to the stray alternating current.
A scope can also be used to observe alternating-current action, but the same precaution of use across a high value of resistance is needed.
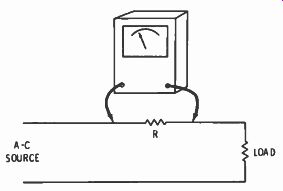
Fig. 2-6. To measure alternating current, connect a resistor in series with
the load, and measure the voltage across the resistor. Convert to current with
Ohm's law. Always use the lowest possible resistor value.
THE SIGNAL GENERATOR
Although not a measuring instrument, the signal generator is an important instrument for producing r-f signals for making it possible to measure components and equipment. It is a miniature transmitter which is tunable over a very wide range of radio frequencies (Fig. 2-7). A signal generator contains a stable variable-frequency oscillator.
The oscillator is band-switched. and each band is tuned over its range with a variable capacitor, like a general-coverage receiver. The oscillator is sometimes followed by a buffer stage to isolate the oscillator from the output. The buffer is followed by an attenuator, usually in two parts. One is a step attenuator with steps of either 10 dB between each step or 10:1 voltage ratio between steps. The other attenuator part is a variable potentiometer. An output meter is part of better signal generators. The meter usually precedes the attenuator and is used to set the output to a predetermined level, say 0.1 volt. The step attenuator then reduces the output in fixed increments, down into the microvolt range.
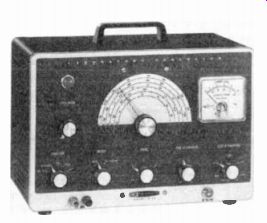
Fig. 2-7. A quality signal generator available in kit form. It covers 100
kHz to 9.5 MHz in four bands. The output meter provides calibrated r-f output.
For use where a modulated r-f output is necessary, signal generators include internal audio modulation. Most use a single 400-Hz audio signal, but some include a variable-frequency audio signal. The amount of audio is adjustable.
THE AUDIO GENERATOR
Of less importance to the amateur, but a generally useful instrument to have is the audio generator (Fig. 2-8). If high fidelity is high on your list of activities, an audio generator and a scope are two instruments worth owning. An audio generator is also valuable in ssb transmitter adjustments.
Like the signal generator, the audio generator has an oscillator, a buffer, and an attenuator. The oscillator is of the RC type, usually a Wien bridge. It is band-switched by switching precision resistors in the bridge circuit. The range of audio frequencies in each band is covered by a dual-ganged variable capacitor which is part of the bridge circuit. The output also has a stepped attenuator marked in dB or in 10:1 voltage steps.
The output is a nearly pure sine wave with a minimum of distortion.
The better the instrument is the lower is the distortion. For ham use, the very low distortion is not important. Many audio generators include a square-wave output in addition to the sine wave. A switch cuts in a positive- and negative-peak clipping circuit. When a good part of the peaks of a sine wave are clipped off. the remaining sides are straight enough to make fairly good square waves. A square wave through an audio amplifier will show up transients as spurious spikes when viewed on a scope
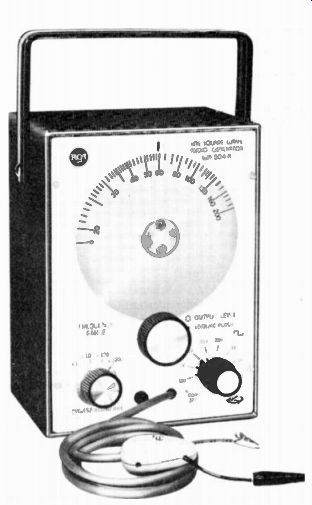
Fig. 2-8. A sine-/ square-wave audio oscillator. It covers the range from
20 Hz to 200 kHz. Output is a choice of pure sine wave or a square wave, which
has value in hi-fi measurements. Courtesy Heath Co.
CHECKING CAPACITORS AND INDUCTORS
The simplest check of a component is, of course, that for continuity.
If an ohmmeter shows infinite resistance through a choke or a winding of a transformer, that circuit is open. If the ohmmeter reads zero resistance across the leads of a capacitor it is shorted.
But an ohmmeter can do more than that on a capacitor. It can show that there is capacitance, and it can measure leakage, which is an important parameter of a capacitor used to couple between stages of vacuum-tube amplifiers. The presence of capacitance is shown by a kick of the needle when the leads are first applied. When you first touch the leads of the ohmmeter to the capacitor it takes a charge from the ohmmeter battery. During the short interval that current from the battery is entering the capacitor the current drawn is high enough to cause the meter needle to kick up-scale in the case of a VOM, down scale in the case of a VTVM. As the capacitor becomes charged, the current decreases and the needle returns to a high-resistance reading.
The amount of time it takes the needle to reach its highest-resistance reading is an indication of the amount of capacitance in a capacitor.
There is a formula for figuring the RC time constant of the charge of a capacitor, but it involves time in fractions of a second which makes it impractical to measure. It is sufficient to know that the higher the capacitance is, the longer it takes the meter to settle down to a high-resistance reading.
A good capacitor should have a resistance of over 50 megohms after the needle has settled down. This is the leakage resistance. Lower resistances (except for electrolytics) mean the capacitor is old and has absorbed some moisture, or is of poor construction. When electrolytic capacitors are checked, the kick will be to a lower resistance reading and the needle will take longer to settle down to a high reading, if the polarity of your ohmmeter is correct. The positive (+) of the internal battery must be connected to the positive (+) terminal of the electrolytic. Any leakage resistance reading of 100,000 ohms or more is considered satisfactory for electrolytic capacitors, because of the electrolyte used in them for a dielectric.
The presence of inductance in an iron-core inductor, such as a filter choke or audio or power transformer, is checked in the same way.
The effect is the opposite, however. The needle on the ohmmeter will move from a high resistance value slowly down to the DC resistance of the winding. The higher the inductance is, the longer it takes for the magnetic field to build up as a result of the charge from the ohm meter battery. A quick movement of the needle (only slightly more than the movement occurring when measuring a resistor) means that possibly some of the turns of wire are shorted, thus affecting the inductance.
POWER TRANSFORMERS
The leads on a power transformer generally follow a standard color-code system. Fig. 2-9 shows the standard colors used on a typical power transformer. Assume you have a transformer of unknown volt ages and you want to measure the voltages. Separate the leads and ...
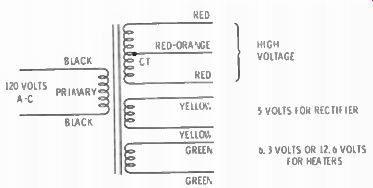
Fig. 2-9. The leads out of power transformers are color-coded
like this.
... study the colors of the insulation on them. If you are able to find agreement with the sketch of Fig. 2-9, select the black leads and connect them to the 120-volt house supply. Be careful in this operation; you are dealing with high voltages. Twist the black leads to the ends of a line cord, and cover them with tape, or with wiring nuts used to make electrical connections. Place your voltmeter on the highest AC range and measure between a red lead and a red-orange (the center tap of the high-voltage secondary) lead. The voltage should be quite high, depending on the transformer, and be the same between either red lead and the red-orange lead. The balance of the leads should be from heater or filament secondaries. You should measure 5 volts ac across the yellow leads, and either 6.3 or 12.6 volts between the green leads.
You can also measure the approximate power rating on the basis of temperature rise. The same length of copper wire will measure a different resistance when hot or cold; higher when hot. Assume you have a power transformer with a 500-volt center-tapped high-voltage secondary. You are building a piece of equipment in which you want to draw 50 mA in the secondary. Measure the DC resistance of the secondary winding while cold. Connect a 10.000-ohm, 25-watt resistor across the secondary and plug the primary into the 120-volt AC socket.
At 500 volts, the resistor will draw 50 mA. Leave it connected for about an hour thus allowing the transformer to warm up. Remove the transformer from the power, remove the resistor and again measure the DC resistance of the high-voltage secondary. It will now indicate a higher value. The heat rise is figured from the following formula:
t_2 = X (234.5 + t_1) - 234.5
where,
t_1 is cold temperature in °C (room temp),
t_2 is hot temperature,
R_1 is resistance at t_1,
R_2 is resistance at t_2 .
A heat rise of 40° C is considered within limits. At any figure substantially below that, the transformer will run comparatively cool for your application. But what about the power from the filament windings? Our measurement was made on the basis of a 50-mA continuous current from the entire high-voltage secondary. A center-tapped secondary in a full-wave rectifier circuit is called on to deliver current out of each half of the secondary winding only on alternate cycles.
Our checking system gave a 100 percent safety factor, and some of this will be used for filaments. Unless you figure on a long string of tubes in the circuit, you will still be well within the heat-rise figure of the transformer.
AUDIO TRANSFORMERS
Audio transformers are used to match impedances in audio circuits, whether it is to match the output of a power amplifier to a speaker or the collector of a transistor to the base of another following it. The impedance ratio between primary and secondary of a transformer is easy to figure when you know the turns ratio. The impedance ratio is equal to the square of the turns ratio. The turns ratio is equal to the voltage ratio. Using voltage as our measurement we merely square the figures to get impedance ratio. Remember we are concerned with a ratio, so the actual voltage is not important.
For example, we are building our own receiver and wish to use a 6K6GT in the output to drive a 3.4-ohm speaker. The tube manual says a 7600-ohm load is recommended. Here is a small output trans former whose instructions have been lost. It has a red lead, a blue lead, and two black leads. The red and blue leads are the primary, and black leads are the speaker secondary. This is standard color coding for output transformers. If instead of two black leads it had a green and a black lead, it would be an interstage transformer. however, a DC ohmmeter check would verify the type of transformer. The resistance between the red and blue leads would be between 25 and 100 ohms, and between the two black leads, less than one ohm. If it were an interstage transformer the resistance between the secondary leads would be greater than the resistance on the primary. Since we have determined it is an output transformer, wire up a line cord to the primary, in the same way we did for the power transformer before.
Measure the voltage across the primary. It should, of course, be the line voltage. Measure the voltage across the secondary. As near as we can read on our meter it is 2.4 volts. The ratio of 120 (the line voltage) to 2.4 is approximately 50 to 1. The square of 50 is about 2500. The impedance ratio is, therefore, 2500 to 1. Since it is a ratio, we can also say it is 7600 to 3.13. That is pretty close to the ideal of 7600 ohms for the plate and 3.4 for the speaker. The impedance of 3.4 ohms for a speaker is a very loose figure anyway. Your trans former could be as much as 20-percent off the right ratio and still work quite well.
The primary of a small transistor transformer should never be connected to the 120-volt line. The impedance of the primary is much too low for so high a voltage. Instead, find an old power or filament transformer and use 12.6 volts for the primary. Because transistors are low-impedance devices, the required impedance ratio is more like 300 to 3.2 for a speaker matching transformer. Check the specifications for the transistor you plan on using.
MEASURING CAPACITORS
There are two methods for measuring the capacitance of a capacitor.
One is to measure the AC voltage across the capacitor, and across a resistor in series, adjusting the value of the resistor until the two volt ages are equal, and applying a formula. The other method is to measure the resonant frequency of a coil and capacitor of known value; then substitute the unknown capacitor and measure resonance. The first method is good only for high values of capacitance, because the handiest frequency available for such measurements is the 60 Hz of the house supply. With an audio generator set at higher frequencies you can measure lower values of capacitors. The second method is for low values of capacitance. Neither method is highly accurate with the use of equipment the amateur is likely to have, but either is good enough for practical use.
Accurate measurement of capacitors and inductors can only be done on a laboratory-type bridge. This requires an investment it will never pay the amateur to make.
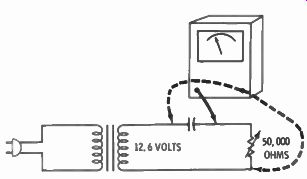
Fig. 2-10. When a voltage across a resistor and a capacitor are equal, the
capacitor's reactance equals the value of the resistor.
Fig. 2-10 is the schematic setup for measuring capacitors by the method mentioned first.
Connect a 50,000-ohm variable resistor in series with the capacitor and a source of 60-Hz voltage. A 12.6-volt filament winding on a transformer is safe to use. Make AC voltage measurements alternately across the capacitor and resistor, at the same time adjusting the resistor until the voltage across both are the same. When the two volt ages are equal, the capacitor has a capacitive reactance equal to the resistor. Measure the resistance of the variable resistor after the adjustment. The standard formula for capacitive reactance is:
X = i c 2-fC
Transposed for C as the unknown it becomes: 2tt / XQ where, C is capacitance in farads, pi is 3.1416,
f is frequency in Hz,
Xc is capacitive reactance in ohms.
To change to C in microfarads (uF), raise the numerator 1 to 10^6 , thus:
Here is an example of how it works: An output of 14.8 AC volts was available. The unknown capacitor and a variable resistor was connected in series, across this voltage. The resistor was adjusted until 9.8 volts was measured across both the resistor and capacitor. The resistor measured 12,450 ohms at this balance. Substituting in the above formula:
--------- 40
_ IO5 2 X 3.1416 X 60 X 12,450
_ IO6 4700 X 103 1000 C 4700
C - .215 pF (approximately)
The capacitor in this case was marked .22 pF with probably a broad tolerance, so we are pretty close.
It is interesting to note that the sum of the two voltages measured seems to be greater than the supply voltage. This is because the circuit of a capacitor in series with a resistor introduces a phase lag (the volt age lags behind the current). Using a 50,000-ohm variable resistor permits measuring capacitors from about 0.05 pF up. A higher resistor value might introduce stray AC pickup into the reading and result in considerable error. If your signal source is an audio generator, increased frequency will permit reading smaller capacitances. For instance, using 600 Hz places the lower limit of capacitance measurement at about 0.005 pF. You will ...
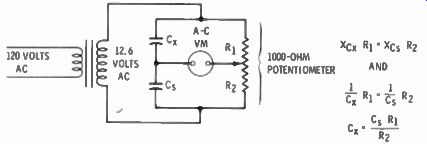
Fig. 2-11. A simple bridge for measuring capacitance.
A capacitor (C ) of known value must be used as a standard.
...recognize this as half of a bridge circuit, with the resistor adjusting the bridge for equal voltages each side of the two arms.
With only a little more effort you can make a homemade (or should we say a ham-made) bridge, which checks unknown values of capacitors against one of a known value. Fig. 2-11 is the schematic of a simple bridge. A variable 1000-ohm potentiometer represents two arms of the bridge. The unknown capacitor, and the known capacitor are the other two arms. Set your meter on the 15-volt range. Adjust the potentiometer for minimum reading on the meter; it should come pretty close to zero. Now disconnect the voltage source, switch your instrument to ohms and measure the resistance each side of the center terminal of the potentiometer. The bridge is in balance when the product of the reactance of Cx and resistance of R, equals the product of the reactance of C and the resistance of R ... This can be written as follows: 2fcX 1 = *C8 ^2 Capacitance is inversely proportional to capacitive reactance. The capacitance formula can be written as follows:
c xRl = ã Ri or C s R, - Cx R? and
_ C, R, R2
Example: A capacitor marked .047 uF was connected into the circuit for C„ Another capacitor was connected in the C, spot. The potentiometer arm was balanced for a null on the meter, and when measured for resistance, the R, part measured 800 ohms, and the R part measured 200 ohms. Substituting in the above formula:
.047 X 800 Cx 200 C x = .188 mF
The capacitor Cx was actually marked .22 uF. The difference between the calculated value and marked value is the tolerance of both the standard capacitor and the one under measurement. The obvious conclusion is that the capacitor used as a standard should be a close tolerance capacitor, or you must expect a ±20% variation.
Lab-type bridges also include a variable resistor in series with Cs for balancing out the leakage resistance of capacitors. For practical purposes for the ham this can be overlooked. If a leakage test with the VTVM shows less than 1 megohm of leakage of any kind but an electrolytic, the capacitor should be thrown away.
Electrolytic capacitors can be measured in the same way but it takes a quality, high-value capacitor for the standard, and the addition of the variable resistor in series with the standard. Also required is a polarizing DC voltage in series with the AC source.
Fig. 2-12 is the circuit. The Ry R 2 balance control is adjusted simultaneously with the leakage resistor control (R t ) for minimum reading.
R3 balances out the leakage resistance of the electrolytic capacitor, which resistance is considered to be in series with the electrolytic ...
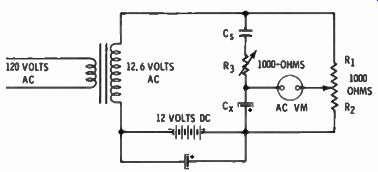
Fig. 2-12. A
bridge circuit for measuring electrolytic capacitors. C, must be an oil filled
non-electrolytic type. Direct current is added to polarize the electrolytic
capacitor under test.
... capacitor. Once balance is attained, the solution is the same as for other capacitors.
Small values of capacitors are best measured in a resonant circuit.
This involves the use of grid-dip oscillator, or a signal generator. Every ham should have a GDO, and the method to be described uses the GDO. You will also need a coil and a small capacitor of known value.
The coil may be any type that you think should resonate with the capacitor within the ranges of the GDO (Fig. 2-13). Connect the capacitor across the coil ends. Couple the GDO to the coil and measure the resonant frequency. Start with the highest ...
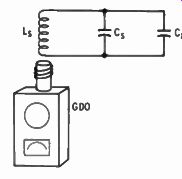
Fig. 2-13. Using standard capacitors and inductances in a resonant circuit,
any small value of unknown capacitor can be measured by the change in resonant
frequency.
... inductance plug-in coil you have for the GDO. Couple and tune the GDO for a dip on the needle. Move the GDO coil slowly out of the field of the coil under test until the needle barely dips. The looser the coupling is. the more accurate the reading will be. Note the resonant frequency reading. Connect the unknown capacitor in parallel with the known-value capacitor and measure for resonance again. The solution requires solving for the inductance of the coil with the known capacitor and frequency; then knowing the inductance, solving for the value of the unknown capacitor from the inductance and the new frequency. It is based on the formula:
_ __1_
/ = 2n\/LC
Squaring, we get:
' 4tt= L C and 4^ r- L and L = * 4tt2 f C
where,
f equals frequency in Hz,
L equals inductance in henrys,
C equals capacitance in farads.
If all values are in MHz, microfarads (uF) and microhenrys(MH), the same formulas apply.
Example: Starting with a known capacitor of 100 pF (picofarads, or micromicrofarads) connected across a coil, the resonant frequency was measured to be 7.8 MHz. Solving for L in the above formula (and using a slide rule for approximate calculations) we get:
4 X 9.8 X 60.8 X .0001 .239 L = 4.19/zH
Connect the unknown capacitor across the 100-pF capacitor. The new frequency measures 5.48 MHz. Having L we now solve for C.
C =_?_- 4 X 9.8 X 30.3 X 4.19 ~ 4987 C = .0002 (approximately)
Subtract the known value of .0001 uF from the calculated value of
.0002 uF (.0002 - .0001 = .0001).
The unknown value is probably a 100-pF capacitor, but, again, tolerances must be considered.
If you have many occasions to measure very small capacitors, it will be worth your while to select a coil to keep as a standard for L. Put it away with a chart of capacitance versus the inverse of frequency squared (capacitance increases linearly with the inverse of the frequency squared), like that shown in Fig. 2-14. Copy the figures of the horizontal capacitances and vertical inverse frequency-squared ratio as shown. Draw your own diagonal line for the coil you have.
Any small r-f coil will do. You will need a couple of 1-percent capacitors, say 10 pF and 100 pF. Place marks on the graph where resonance occurs for each of the capacitors, as measured by coupling a GDO to the resonant circuit. Draw a straight line through both
[...]
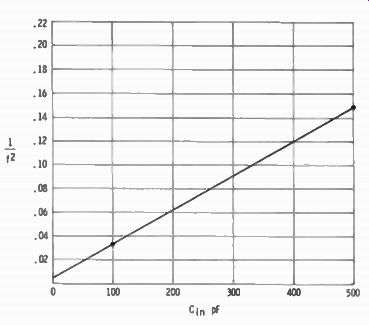
Fig. 2-14. How a chart can be made to find the value of small capacitors by
measuring the resonant frequency with a standard coil. The diagonal line in
this sample was based on a 100-pF and a 500-pF capacitor.
capacitance figure. This is the distributed capacitances of the coil.
Thereafter, for any unknown value of small capacitor, find the resonant frequency with the standard coil, go across to the diagonal line, and down to capacitor value.
MEASURING INDUCTANCES
An inductance may be measured by the method described for capacitors. For high values of iron-core inductors, use one of the first two methods. For low values of inductor use the GDO resonance method, with a known value of small capacitor.
One difference must be considered in measuring iron-core or high value inductors. They all have resistance, which is the resistance of the wire with which they are wound. In the case of r-f coils, the resistance is so low it may be disregarded.
In the first method (that of an inductor in series with a resistor and adjusting the resistor for equal voltage across it and the inductor) the answer will be the impedance of the inductor. Impedance is a combination of reactance and resistance.
Remove the power and measure the resistance of the inductor with the ohmmeter. Find true Xt . from the following formula:
Z = or Z 2 = R' + X2 therefore X2 = Z2-R2 where,
Z is the apparent impedance as measured, R is the DC resistance of the wire in the inductor.
Having reactance (X) we find the inductance from the following formula:
If you have an inductor of known value you can use it as the standard in the bridge method described for capacitors. If the DC resistance of the two inductors (the known and the unknown) are different, you will need to add resistance in series with the one with less resistance to make the two equal. Assuming the standard inductor has the lesser DC resistance, the circuit will look like Fig. 2-15. If the two resistances are not equalized the balance on the R} R. arm will be incorrect.
For small air-core inductors as used to resonate in the ham bands, the GDO method described for measuring small capacitors with a standard value capacitor applies. On the basis of the resonant frequency with a capacitor of known value you would solve for inductance, as was done earlier for capacitors, using the setup of Fig. 2-13.
This does not take into account the effect of distributed capacity in the coil, but in the small inductors used in the ham bands distributed capacitance has little effect. Besides, the wide tolerances of capacitors ...
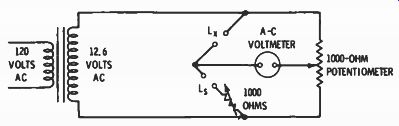
Fig. 2-15. A
bridge for measuring iron-core inductors. The standard inductor (L.) must
have a known value. If its DC resistance is higher than the inductor being
measured (L.), switch the positions of the two. The series resistor should
be in series with the lower-resistance inductor.
... that may be at hand and the lack of calibration accuracy of the GDO readings would result in wide errors of distributed capacitance. Distributed capacitance on ham-band coils usually is less than 1 pF on large air-wound coils, and perhaps as much as 10 pF on close-spaced r-f coils.
Distributed capacity is important only in r-f chokes where it should result in self-resonance in the ham bands for the greatest effect. The real importance is for the r-f choke to offer the highest r-f impedance in a circuit, and it does so when it is resonant at the frequency of concern. But its self-resonance is as much affected by parallel capacities of the associated circuitry as the distributed capacitance of the coils of the choke. The measurement, therefore, should be made with the choke connected into the circuit in which it is used or is to be used.
If one knows the inductance of a coil from its published specifications. the distributed capacitance can be determined. Couple the GDO to the coil and measure its self-resonant frequency. Start with the lowest-frequency coil in your GDO. and work up. From frequency, the distributed capacitance is solved from:
--------
HEADPHONE AND SPEAKER IMPEDANCE
The impedances of headphones and speakers are specified for frequencies other than 60 Hz; for headphones it is usually 1000 Hz, and for speakers, 400 Hz. This obviously calls for the use of a signal source of these frequencies, the audio generator being the best source. As in the case of C and L measurements, the simplest method is the equal voltage method; that is, equal voltages across the headphone or speaker, and a resistor in series.
For head phones set the audio generator for 1000 Hz and connect a 5000-ohm variable resistor in series with the headphone and across the output of the generator. Make alternate AC voltage measurements across the headphones and across the resistor. Adjust the variable resistor until the voltages are equal. The impedance of the headphones then is equal to the resistance of the resistor setting at 1000 Hz.
The AC impedance of loudspeakers is very close to the DC resistance of the voice coil. Begin by measuring the DC resistance of the voice coil. Connect a variable resistor of about twice that value in series with the speaker. A 20-ohm variable resistor will be high enough to measure any speaker, including 16-ohm high-fidelity speakers. With the audio generator set for 400 Hz, adjust the resistor for equal volt ages. Most speakers used on ham receivers are the same as used in standard radio sets, and will probably measure 3.4 ohms. These speakers are called "replacement" speakers in the radio parts catalogs.
MEASURING Q
The Q of a circuit is the figure of merit of selectivity of the circuit.
It is an indication of how sharp the resonant point is. The Q is affected by the winding factor of the coil and by the resistance in the circuit. The resistance may be the resistance of the wires of the coil, the resistance in the capacitor (usually negligible), and principally by the resistance of the circuit associated with the resonant circuit-that is, the rest of the circuit in which it is used.
With a GDO the relative Q is reflected by the sharpness with which the needle on the GDO dips when tuning through resonance. A quick flick of the needle indicates a high Q. A broad dip indicates a low Q. To see this, note the effect on the dip when measuring a coil-capacitor resonant circuit both with and without a 1000-ohm resistor across the circuit. Resonance will show up as a broad dip with the resistor across the circuit.
The actual measurement of Q requires a signal source and a VTVM with an r-f probe. Connect the probe of the VTVM across the coil and-capacitor circuit, and apply an r-f signal to the coil by coupling the GDO to the coil. Measure the voltage at resonance. Adjust the GDO frequency to either side of resonance until the meter reads .707 of the resonance value. Adjust the GDO to the other side of resonance until the meter again reads .707 of the resonance value. Q is given by the formula.
where, fn is the meter frequency at resonance, ft is the frequency at .707 below resonance, f 2 is the frequency at .707 above resonance.
The Q of a tuned circuit is easily measured with an r-f signal generator. The setup is like that of Fig. 2-16. Note the resistor in series with the signal generator and tuned circuit. The value of the resistor ...
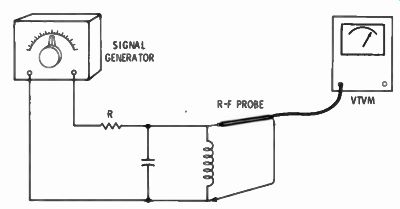
Fig. 2-16. Setup for
measuring Q of a resonant circuit. The resistor (R) should have a value equal
to the normal associated circuitry-for example, the plate resistance of
the tube preceding the resonant circuit.
... should be the same as the plate resistance of the tube or circuit to which the tuned circuit is normally connected. The information can be obtained from the tube manuals.
R-F AND I-F TRANSFORMERS
The build-it-yourself ham can predetermine the selectivity of trans formers he may want to use. The setup of Fig. 2-17 is similar to that of Fig. 2-16, but a resistor has been added to the output to simulate the grid loading of a following stage. Selectivity measurements are made like that for the Q of a circuit mentioned before, except a number of frequency-versus-output voltages are plotted. The information is converted to a curve like that of Fig. 2-18. Changing the voltage ratio figures to dB results in a selectivity curve for that transformer. (dB is 20 times the logarithm of the voltage ratio).
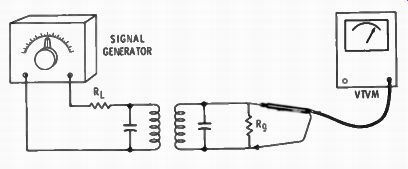
Fig. 2-17. The Q and selectivity of an r-f or i-f transformer can be measured with this setup. R1. is equal to the plate resistance of the preceding stage. Re is equal to the grid load of the following stage.
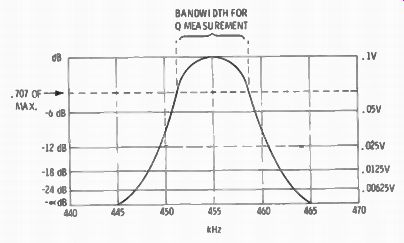
Fig. 2-18. By charting volts versus frequency and converting volts to dB,
a selectivity curve like this can be drawn. Bandwidth shown in specs is at
the - 6dB points.
Transformers are designed to cover the range from high gain and sharp selectivity to those with a broad passband and low gain. Some times the latter type even have a double hump with a small dip at resonance.
FREQUENCY MEASUREMENTS
It obviously follows that the method described above for Q and transformer selectivity measurements may also be used for measuring the resonant frequency of an unknown coil-and-capacitor combination, or r-f or i-f transformers. Tuning the signal generator to the lowest frequency that gives a peak reading on the VTVM. the generator dial will indicate the resonant frequency.
The handiest instrument for measuring frequency is the GDO. What it lacks in accuracy it makes up in versatility. Resonant circuits wired into a piece of gear may be measured for frequency, if they arc not shielded to prevent coupling the GDO to it. Inductively couple a GDO to the coil of any resonant circuit. The meter on the GDO will dip down scale when the GDO and the resonant circuit are at the same frequency.
How to Couple a GDO
Care must be used in coupling a GDO to a resonant circuit. The accuracy of the GDO is affected by the external load of the circuit to which it is coupled. For minimum effect the coupling should be as loose as possible, while still getting a dip on the meter.
When first coupling to a tuned circuit, place the coil end against the end of the coil of the resonant circuit. This puts the magnetic field in line with the field path of the resonant circuit. You will note a pronounced dip on the needle of the GDO. You will also note the point of greatest dip is different depending on the direction from which you turned the tuning dial on the GDO. If this occurs you are definitely overcoupled. The object is to draw' the GDO coil away from the resonant circuit until there is a barely perceptible dip on the needle. This is the point of least effect of the external tuned circuit and greatest accuracy. The higher the Q of the resonant circuit the farther away from it you will get a dip, and the sharper will be the dip.
The GDO may also be coupled to a piece of wire for an indication, if the wire is part of a tuned circuit. The connecting lead between a coil and capacitor is part of the resonant circuit. Placing the coil of the GDO against the wire is coupling to the circuit. Because the magnetic field around a wire is much less than around the coil of a resonant circuit, it may be necessary to place the coil of the GDO right up against the wire. Unless heavily swamped with resistance, any piece of wire will show some resonance. Try this in a transmitter (turned off.
of course) at any point. You may discover other resonant frequencies than the one the transmitter should be operating on. In fact, this is one way of checking for spurious oscillation, and will be covered more fully in a later section. A straight piece of wire connected to nothing is a resonant circuit-like an antenna. By coupling your GDO to the center of the wire you can measure the resonant frequency of that wire like a half-wave dipole antenna.
Coupling to a circuit under test must be inductive. It is possible to get a dip by capacity effect between the coil and a large surface, but most such attempts usually fail, and the capacitive-coupling method should not be considered.
Measuring Crystal Frequency
A quartz crystal is a mechanical resonant circuit of high stability and Q. Its approximate frequency can be measured with a GDO by coupling to it as you would any resonant circuit. Wind about two turns of wire around the coil of the GDO, and connect the stripped ends to the pins of the crystal. The GDO will dip at resonance. Crystals can have more than one mode of vibration, and some are especially de signed as overtone oscillators, especially the ones for use in the Citizens Band. Start with the lowest-frequency coil plugged into the GDO, and work up in frequency until the first dip is found. This is the approximate frequency of the crystal fundamental.
In some GDOs the coil jack's pin spacing and the circuit is such that FT style crystals may be plugged into the GDO in place of a coil, and the instrument will oscillate at the crystal frequency. The Knight Kit GDO is an example of such a unit. In GDO's using tunnel diodes as the oscillator, the tunnel-diode current flows through the coil. Since crystals have no DC continuity they cannot be substituted for coils in tunnel-diode GDO's.
A crystal plugged into a GDO can be heard in a receiver. Its frequency would be determined from the dial reading of the receiver.
A crystal offers very low impedance to the flow of current at its resonant frequency When connected in series with a signal generator and a VTVM with an r-f probe, the frequency at which the VTVM indicates the highest is the frequency of crystal resonance.
FILTERS
Filters for attenuating frequencies above or below a specified frequency (called low-pass and high-pass) are made up basically of L sections as in Fig. 2-19. This type of filter is called a constant-k filter.
The product of the arithmetic impedance values of each leg is a constant (Zc X Zb = k 2 ), and is true for all frequencies. Constant-A filters have excellent attenuation above or below the cutoff frequency.
The same filter will often appear as in Fig. 2-20 called a Tr-section, low-pass filter, or as in Fig. 2-21 called a T-section, low-pass filter.
Adding sections increases the attenuation rate above or below the ...
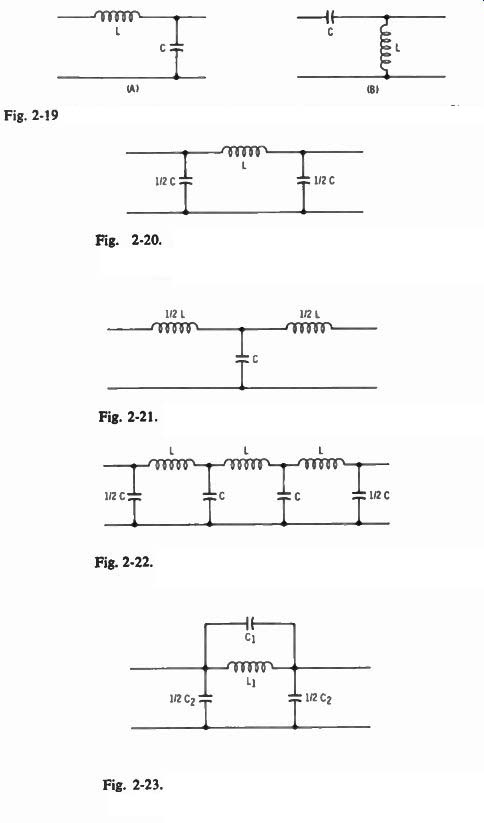
Fig. 2-19. Constant-k filter sections. A is a low-pass, and B a high-pass
filter.
Fig. 2-20. A pi-section constant-k low-pass filter network. The capacitor value is split between the input and output.
Fig. 2-21. A T-section constant-k low-pass filter.
Fig. 2-22. A multisection constant-k low-pass filter.
Fig. 2-23. An m-derived low-pass filter section. The parallel coil and capacitor form a resonant circuit.
... cutoff frequency. Fig. 2-22 is a multisection constant-k filter for reducing TVI from a transmitter output.
Another configuration, called m-derived, uses resonant circuits. This type puts a deeper dip in the curve at some remote frequency beyond cutoff, in the case of a low-pass filter. A single m-derived pi-section low-pass filter looks like Fig. 2-23.
Constant-k low-pass filters have better overall attenuation beyond the cutoff frequency, while m-derived filters have a sharper initial drop
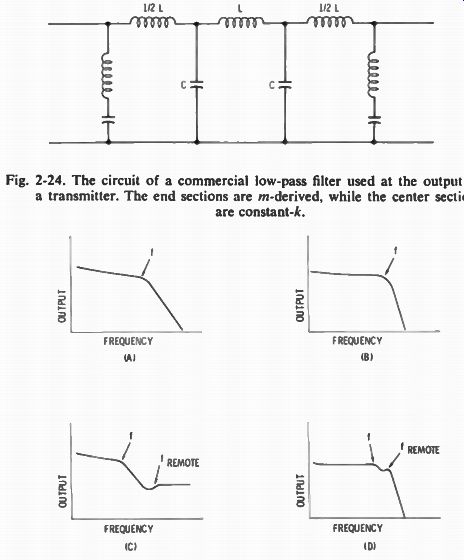
Fig. 2-24. The
circuit of a commercial low-pass filter used at the output of a transmitter.
The end sections are m-derived. while the center sections are constant-k.
Fig. 2-25. Approximate curves for various filter types. A is that of a single section constant-k. B shows the sharper drop of a 3-section constant-k. C is a single-section m-derived. D is the actual measurement of a commercial TVI low-pass filter for amateur transmitters. The sharp drop is at approximately 45 MHz. All of these are low-pass filters. The letter / indicates the cutoff frequency; /remote is the dip of the resonant circuit in in-derived filters.
... between the cutoff frequency and some remote frequency. Commercial TVI filters for use at the output of a transmitter combine both types (Fig. 2-24). Fig. 2-25 shows approximate curves of typical filters. The one at D is an actual measurement of a commercial TVI high-pass filter measured in the manner about to be described. The response shown is true only when the filter is terminated with the proper load resistor.
The value of the load resistor plays a prominent part in the formulas.
If you use a TVI filter in the output of your rig it is most important that it be followed by a perfect 52-ohm resistive load by the antenna feeder. This means a perfect match, or a 1:1 SWR. Otherwise you might not be suppressing higher harmonics, and may even be sup pressing some of your operating-frequency signal power.
Filter Formulas
The formulas for constant-k filters are:
I - R AT 1
where,
L is in henrys,
C is in farads,
f_c is the cutoff frequency in Hz,
R is in ohms.
The cutoff frequency is represented by fc, and R is the load resistance. Furthermore, if your feeder is reflecting a high SWR it is also reflecting some reactance, and this also upsets the filter values.
Resonant m-derived filters are filters whose LC ratio is related to the load, (R). The factor m becomes part of the precise formula. It is a figure somewhere between 0 and 1. The usual value for m in r-f filters is 0.6, and is already calculated in the formulas appearing in Fig. 2-26.
Thesem-derived filters are frequently used at each end of a constant-k filter system. The two m-derived configurations are shown in Fig. 2-26. B and D are complete filters using the m-derived sections at the ends.
There are many other configurations for both the constant-A and m-derived type filters. There is also a whole series for high-pass purposes.
Those shown here are applicable to transmitter output filters for reduction of harmonics above the highest output band (commercial units are usually designed for passing frequencies through the 10-meter...
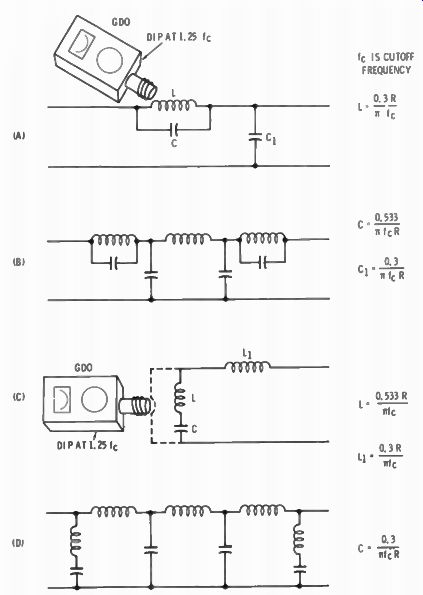
Fig. 2-26. Filters using m-derived sections. At A is a single pi section and
the formula for the constants. B is a complete low-pass, filter using m-derived
pi sections on the ends. C and D are like A and B but with T sections. Also
shown is how to couple a GDO for measuring m-derived sections.
...band, and attenuating sharply above 30 MHz) to reduce TVI. The information here will make it possible to measure commercial filters or to design your own.
Audio Filters
Low-pass audio-frequency filters are sometimes used in the speech equipment of transmitters to cut off frequencies above about 3000 Hz. They reduce splatter caused by harmonics of the speech frequencies, especially following a speech clipper which, by its clipping action, is a producer of undesirable harmonics.
Audio filters generally follow the constant-k design but seldom adhere precisely to formulas. They arc practical compromises because input and output load resistance is seldom the same, and exact values of L and C are hard to come by at audio frequencies.
Filter Measurements
All you need to measure an r-f filter is a GDO or signal generator and a VTVM with an external r-f probe having high frequency response limits. The setup is as shown in Fig. 2-27. Two or three turns of wire around the GDO coil is connected in series with a 52-ohm noninductive resistor (any carbon resistor will do), and connected to the input of the filter (filters arc symmetrical and either end may be used for input or output). A 52-ohm noninductive resistor is connected across the output.
Use the coil in the GDO with which you observe a pronounced drop in output beyond some frequency. For a transmitter TVI filter this will be at about 35 to 45 MHz. Make a chart of frequency and voltage input at each major division on the GDO dial with the VTVM r-f probe connected to the input of the filter. Make sure the coupling to the GDO is not disturbed and run through the same frequencies charting the output voltages. You will probably use the 1- and 5-volt ...
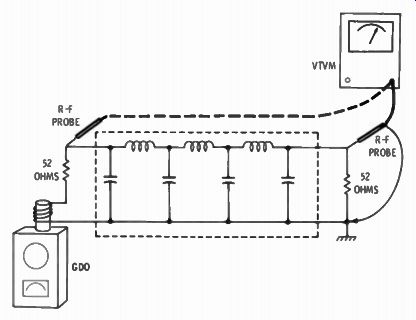
Fig. 2-27. The setup used to measure the attenuation of a filter. Compare
the output to input voltages at various frequencies, and draw a curve.
... ranges on the VTVM. With a slide rule, chart the ratio between output and input voltages. Plot the ratio figures on log graph paper versus frequency and you will have the voltage attenuation curve for your filter. For converting to dB remember that dB is 20 times the log of voltage ratios. This can be read directly on a slide rule with an L scale. Convert the voltage ratios from the slide-rule D scale to the L scale, and multiply by 20. If you prefer to plot attenuation in terms of power, square the voltage ratios.
Fig. 2-28 is the schematic of a simple, balanced high-pass filter.
This, and variations of it, are used at a TV set input to reduce swamping by adjacent ham transmitters. They are designed for 300 ohm fines, the usual TV lead-in. These can be checked as described above, but with 300-ohm resistors at the input and output.
An easy method of checking the filter of Fig. 2-28 is shown in Fig. 2-29. Short the input and measure the resonant frequency by coupling the GDO coil to the short. The resonant frequency is the cutoff frequency (f_r). No resistors are used. This method is good only for single-section filters. In multiple section filters the other coils and capacitors upset the measured resonant frequency.
The method described for multisection filters is used to plot the attenuation of band-pass, or band-attenuation filters, or filters used at audio frequencies.
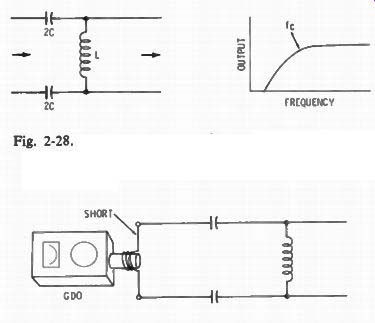
Fig. 2-28. A simple high-pass filter as used at the input of TV sets. The
sketch at the right shows approximate response.
Fig. 2-29. The method of coupling a GDO to a simple high-pass filter. The resonant frequency measured is the cutoff frequency of the filter.
For measuring audio-frequency filters you will need an audio generator for a signal source. Any VTVM and most VOM's will have good audio frequency response on the AC volts function to serve for measuring, without the need for special probes.
When making measurements of filters at radio frequencies, external leads must be kept short. Connect the load resistor directly from the output to ground. A banana plug makes a good connector for the center terminal of coaxial male connectors on commercial filters.
Use only two or three turns around the GDO coil on the input and keep the rest of the connection as short as possible. Long lead lengths become an external inductance and can affect the results of measurement at the higher frequencies.
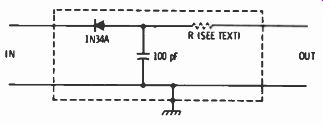
Fig. 2-30. An r-f probe for converting high radio frequencies to DC. The
resistor (R) may be omitted if the probe is used with a VTVM. If you do not
have a VTVM with an r-f probe you can make your own. Fig. 2-30 is the schematic.
To prevent loading the circuit under test, a series isolating resistor should
follow the rectifier. This would be the 1-megohm resistor already part of a
VTVM in its DC probe.
If the r-f probe is to be used with a VOM. a resistor should be added.
If you are checking filters designed for 52- or 300-ohm loads, a 5000 ohm series resistor will not affect accuracy too much. It will reduce the sensitivity of a 1000 ohms/volt VOM on the 1.5-volt scale by a ratio of 5000/1500. Higher sensitivity VOM's fare better. The output of the probe is direct-current, so the DC function on the instrument must be used.
While the foregoing measurements were based on the use of a GDO, it should be obvious that a signal generator will do the same thing, provided it has enough output-some don't. In addition, some inexpensive signal generators are somewhat limited in highest frequency fundamental output. Often, the highest band shown on the dial is a calibration of the harmonic of the last fundamental band. Measurements given here, based on a harmonic band, would be completely inaccurate. If you decide to invest in an r-f signal generator be sure to check the highest fundamental frequency it will produce.