by Dick Crawford
I'VE BEEN experimenting with loudspeakers. Great sport! But I've had difficulty making measurements that mean anything. I don't have an anechoic chamber. Few do. Somebody suggested burying my loudspeakers up to face level in the yard and making half space measurements. Another suggested that I just bury the loudspeakers, and forget the measurements. No respect.
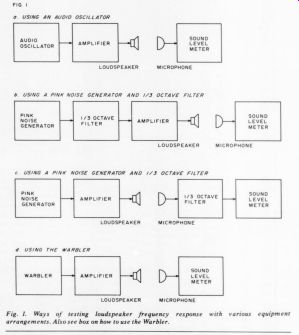
In my listening room the acoustic reflections are bad. So bad that if I try a frequency response measurement using an audio oscillator as a signal source (as in Fig. 1A), moving the microphone a foot or so is apt to significantly change the measured frequency response. This is typical(1,2,3).
Under such conditions the microphone measurements must be averaged at, say, half a dozen positions. No thanks.
Another answer is to put the microphones very close to the loudspeakers, but this works well only at low frequencies.
A better answer is the use of a pink noise source and a 1 / 3 octave filter. (Fig. 1B and Fig. 1C). The pink noise method works because the acoustic energy is spread over 1 / 3 octave, and this helps average out the room reflections. It also reduces the sensitivity to microphone placement. 1 have such a system, but I consider it too complicated.
THE EASIER WAY
I designed and built an audio signal generator that periodically sweeps through 1/3 octave bands. It sweeps rapidly enough so that the measuring system tends to average the response in the band being swept. The frequency bands are those commonly used in 1/3 octave analyzers. With this unit and a sound level meter, a simple loudspeaker measurement system is possible. (See Fig. 1D).
Technically this unit is a 1/3 octave warble tone generator, but I've come to call it The Warbler.
Fig. 2 is a block diagram of the Warbler. What we need is an oscillator which can be rapidly voltage tuned over a range of frequencies, with a constant output level.
The voltage to frequency converter does this, but its outputs are a square and a triangular wave. A waveshaping circuit is used to selectively distort the triangle wave into a near sine wave. Readers may notice that this circuit is a form of the familiar function generator(4).
The Warbler should spend equal time at all frequencies in each band. This means a linear sweep. If we sum a low frequency triangular wave with the DC tuning voltage we achieve a linear sweep. If we make the peak-to-peak value of the triangular wave 1/3 that of the DC tuning voltage, then we have a 1/3 octave wide sweep.
HOW THE CIRCUIT WORKS
The schematic is shown in Fig. 3. IC1a and IC1b form the triangle wave generator which provide the sweep voltage. The sweep rate is about four or five Hertz. The output of IC1b is a triangle wave of about 3 volts peak-to-peak. This is summed with a DC voltage in IC1c. IC1c is about plus 10V DC with a 3V peak-to-peak triangle wave superimposed.
The frequency control is a switched attenuator, S103, mounted to the front panel and labeled Frequency. A poten tiometer could be used here, but I selected a switch as it allows the user to always return to the same frequency setting. The output of the frequency control goes to IC1d, which is a voltage follower used as a buffer. It feeds IC2a, which is a precision inverter.
Precision is needed here to preserve the symmetry of the output waveform. Good symmetry is needed at the output to keep down the even order harmonic distortions.
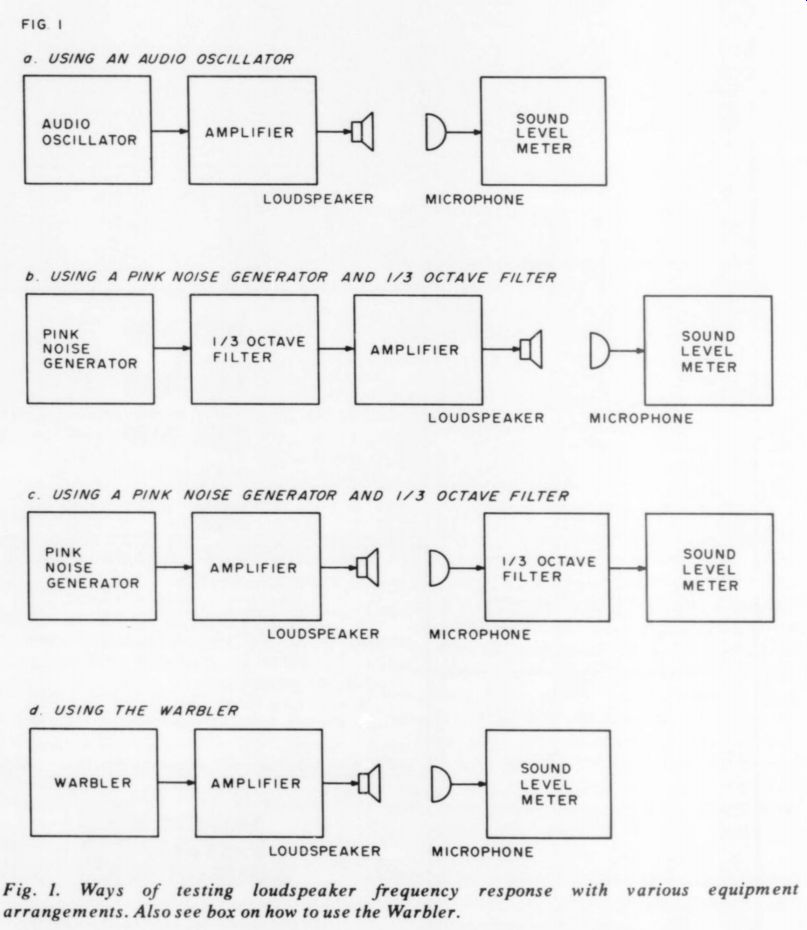
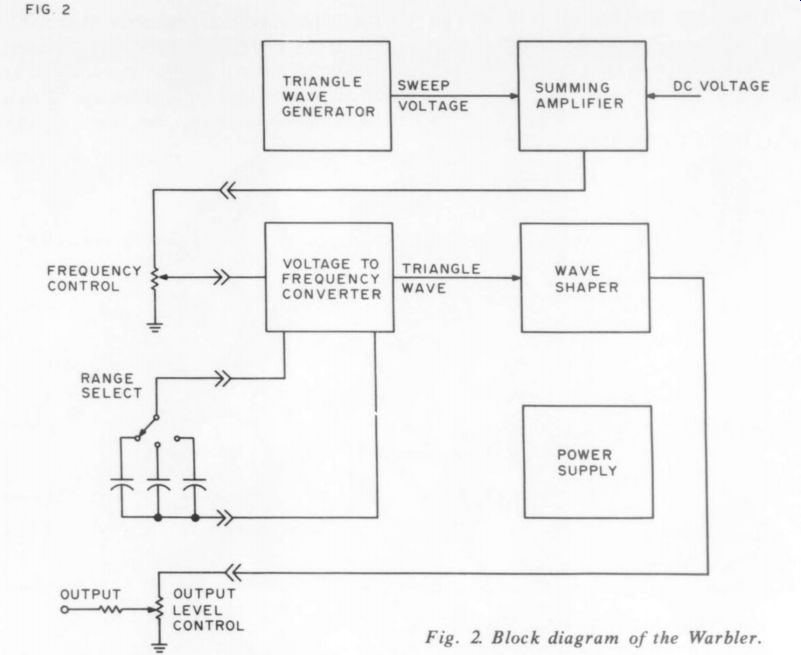
Fig. 1. Ways of testing loudspeaker frequency response with various equipment arrangements. Also see box on how to use the Warbler.
Fig. 2. Block diagram of the Warbler.
The matching of resistors R8 and R9 determine the preciseness of inverter IC2a.
Now comes the sticky part. Q1, IC2b and IC3 operate together to make a triangle wave generator. When Q1 is on, a positive current flows into the input of IC2b. This causes a negative going ramp at the output of IC2b. The slope of this ramp (volts per unit of time) is determined by two things: 1, the setting of the frequency control switch, and 2, the value of capacitor selected by the range switch (S102).
SCHMITT TRIG
IC3 is a Schmitt trigger(5). When the output of IC2b has ramped down to minus 5 volts, the output of U3 will change from positive 12V to minus 12V. This will turn off Q1. With Q1 off, there is a negative current into the input of IC2b. This negative current is equal in magnitude to the positive current we started with. Thus with Q1 off, the output of IC2b is a positive-going ramp.
It ramps positive until it reaches plus SV, at which point the output of IC3 switches from minus 12V to positive 12V.
This turns on Q1, and we are right back where we started, because with Q1 "'on'' the ramp starts going negative again. Thus the output of IC2b cycles between a negative going ramp and a positive going ramp, which the output of IC3 alternates between a positive voltage and a negative voltage.
IC2b output is a triangle wave, and the output of IC3 is a square wave. The frequency of both outputs is determined by the voltage selected by the frequency control switch (S103). Thus, this circuit satisfied the need for a voltage-to frequency converter as shown on the block diagram.
IC3 is a 301 type op amp, because it is (relatively) fast, and we need speed here.
In fact, C2 is used to speed up IC3 so that the calibration of the frequency control switch (S103) will be more accurate at the higher frequencies.
IC2c is a wave shaping circuit. It transforms the triangular wave form from IC2b into what is nearly a sine wave. It does this by means of the non-linearities of diodes D2 through D7. Resistors R17, R18, and R19 were chosen for the lowest total harmonic distortion.
POWER
The power supply is a full-wave bridge rectifier with capacitor inputs. The low total drain of about 15 milliamperes allows the use of relatively small filter capacitors. Q2 and Q3 are series pass transistors with zener diodes (D12 and D13) used to regulate the output voltages at about plus and minus 14V.
The schematic is not completely drawn, as plus 14V goes to pin 4 of both IC1 and IC2, and pin 7 of IC3, and minus 14 Volts goes to pin 11 of both IC1 and IC2, and pin 4 of IC3.
A one-to-one reproduction of the etched circuit artwork is shown in Fig. 4. All components whose number is less than 100 (example R3) mount on the PC board.
Those components whose number is more than 100 (example R103) mount elsewhere. The connections to and from the board are shown as circled alphabetical letters on the schematic. Fig. 5 is a loading diagram showing the position of the components on the etched board. A parts list is given in Fig. 6.
I put my warbler in a 4x5x6" chassis box. The finished product which has been used now for a couple of years, is shown in Fig. 7.
--------------
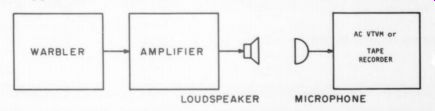
HOW TO USE THE WARBLER
The Warbler is designed to be used as a signal source for measuring loudspeaker frequency response, as shown in the figure below. The microphone should have a flat frequency response. Most electret and condenser microphones have a flat response to 5kHz, and many are flat to beyond 15kHz. If you don't have an AC VTVM, the recording level meters of most tape recorders can be used. Use a blank tape, put the recorder in ''record'' and pause modes, and the record level meters will indicate the sound pressure level at the microphones.
It is usual to reference the frequency response measurements to 1kHz. Set the warbler to 1kHz, turn up the volume to a reasonable (normal listening) level, place the microphone at the desired location (a commonly used one is one meter on axis with the tweeter), and adjust the record level control on the recorder (the sensitivity control if using an AC VTVM) to 0dB. Now as you change the warbler frequency all measurements of the meter will be referenced to 1kHz. Of course, the tone controls or loudness compensation of the amplifier will affect the results, unless they are set flat or switched out where possible.
Do not be disturbed if your loudspeakers do not measure as flat as you expected.
For one thing, the warbler cannot completely overcome room effects. For another, despite the hype, most manufacturers' loudspeakers are definitely not flat.
----------
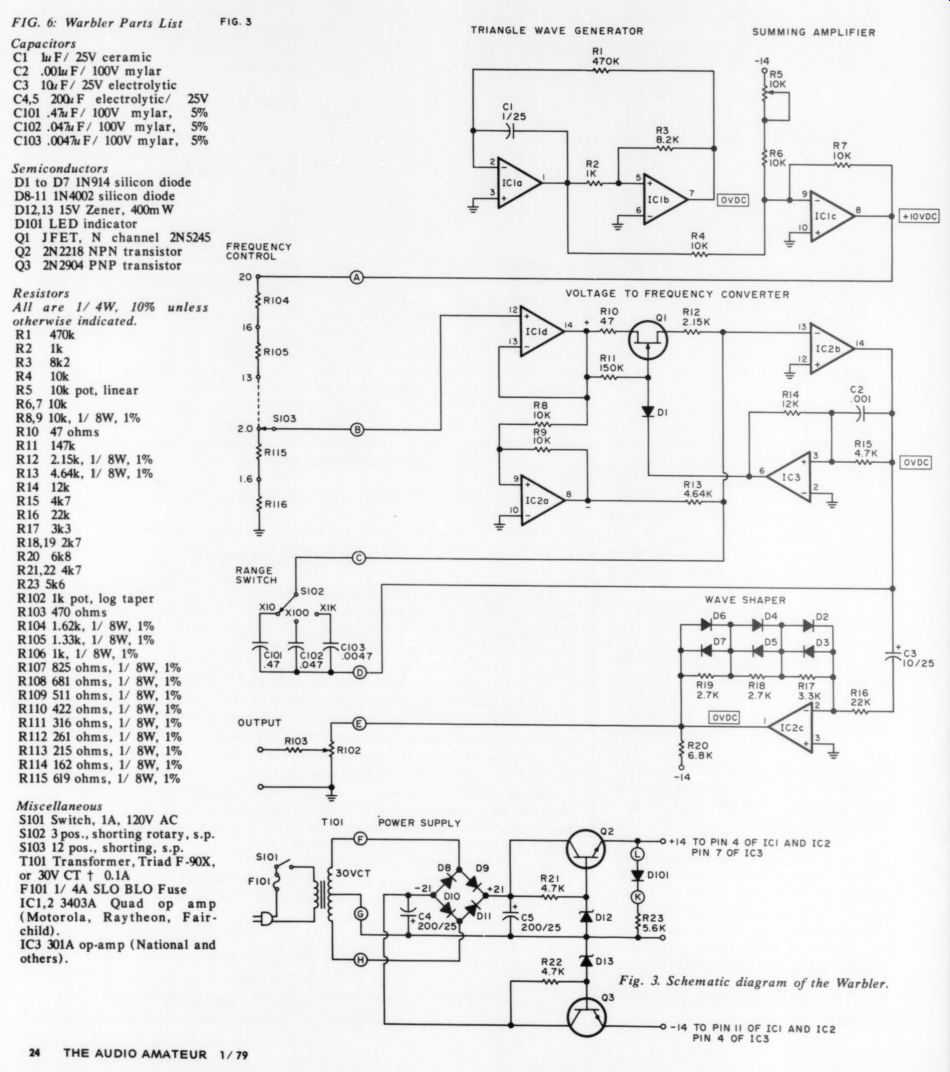
FIG. 6: Warbler Parts List
Capacitors C1 WF/ 25V ceramic
C2 .001 uF/ 100V mylar
C3 1 F/ 25V electrolytic C4,5 200uF electrolytic/ 25V
C101 4 F/ 100V mylar, 5% C102 .047F/ 100V mylar, 5% C103 .0047 uF/ 100V mylar, 5%
Semiconductors D1 to D7 IN914 silicon diode D8-11 1IN4002 silicon diode D12,13 15V Zener, 400mW D101
LED indicator
Q1 JFET, N channel 2NS5S245 Q2 2N2218 NPN transistor Q3 2N2904 PNP transistor
Resistors All are 1/ 4W, 10% unless otherwise indicated.
R1 470k R2 1k R3 8k2 R4 10k RS 10k pot, linear R6,7 10k R8,9 10k, 1/ 8W, 1% R10 47 ohms R11 147 R12 2.15k, 1/ 8W, 1% R13 4.64k, 1/ 8W, 1% R14 12k R1S 4k7 R16 22k R17 3k3 R18,19 2k7 R20 6k8 R21,22 4k7 R23 5k6 R102 1k pot, log taper R103 470 ohms R104 1.62k, 1/ 8W, 1% R10S 1.33k, 1/ 8W, 1% R106 1k, 1/ 8W, 1% R107 825 ohms, 1/ 8W, 1% R108 681 ohms, 1/ 8W, 1% R109 511 ohms, 1/ 8W, 1% R110 422 ohms, 1/ 8W, 1% R111 316 ohms, 1/ 8W, 1% R112 261 ohms, 1/ 8W, 1% R113 215 ohms, 1/ 8W, 1% R114 162 ohms, 1/ 8W, 1% R11S 619 ohms, 1/ 8W, 1% Miscellaneous
$101 Switch, 1A, 120V AC
$102 3 pos., shorting rotary, s.p.
$103 "pty Sots, s.p. ' T101
Transformer, Triad F-90X, or IVCT t+ 0.1A F101 1/ 4A SLO BLO Fuse IC1,2 3403A Quad op amp (Motorola, Raytheon, Fairchild).
IC3 301A op-amp (National and others).
--------------------
(above right) Fig. 3. Schematic diagram of the Warbler.
Calib. Methods
The only calibration required is that of R5. There are several alternative procedures, based on the equipment available. The simplest is to use an oscilloscope with a calibrated time base. Set the warbler frequency to kHz, and adjust R5 until the average frequency is 1kHz. A more ac curate method is to use a frequency counter. To do this the warble must be temporarily disconnected by removing one end of R4 from the etched board. Then tune the Warbler to 1kHz and adjust R5 until the frequency counter, which is connected to the output of the warbler, indicates that the frequency is indeed 1kHz.
A third method utilizes Lissajous patterns on an oscilloscope. Again, disconnect one end of R4 temporarily. Set the warbler to 20Hz and adjust R5 until there is a steady 3 to 1 Lissajous pattern on ...
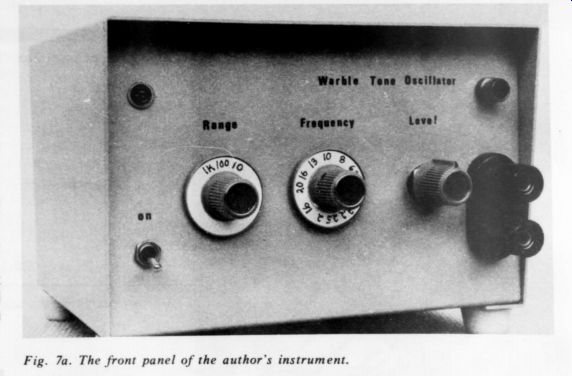
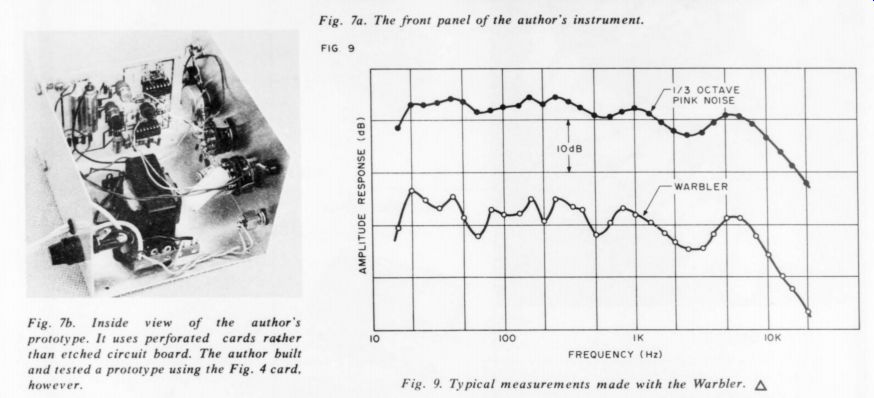
Fig. 7b. Inside view of the author's prototype. It uses perforated cards
rather than etched circuit board. The author built and tested a prototype
using the Fig. 4 card, however.
Fig. 9. Typical measurements made with the Warbler.
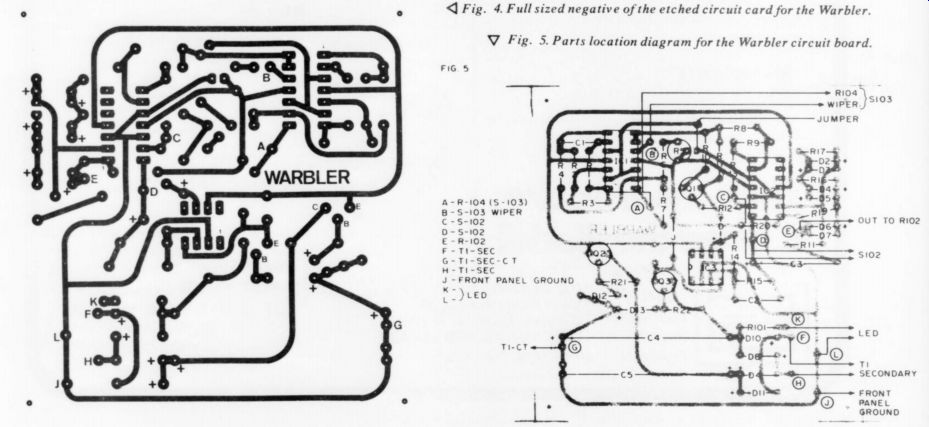
Fig. 4. Full sized negative of the etched circuit card for the Warbler.
Fig. 5. Parts location diagram for the Warbler circuit board.
FIG. 8: WARBLER CHARACTERISTICS
I. Frequency A. Ranges: x10, x100, x1k B. Bands: 1/ 3 octave in a (1.6, 2, 2.5, 3.2, 4, S, 6.3, 8, 10, 13, 16, 20) sequence. C. Sweep: linear, 1/ 3 octave, at about 5 repetitions/ sec. D. Accuracy (center frequency): +5%.
II. Amplitude: A. Output: 0 to 1 Volt RMS. B. Vs. Frequency: $ 0.25dB, 10Hz to 20kHz.
III. Distortion (at 1kHz):
A. Harmonic: Harmonics # 23456789 % Distortion .25.1.01.9.015.4.025.4
B. Out of band components
1. Total Harmonic Distortion (see above): less than 1.5%
2. Hum and Noise: less than .1%
3. Sidebands at less than 1/3 octave from 1kHz (<800Hz and >1.3kHz) less than 1%
---------------
... the oscilloscope with 60Hz as the other input. If you understand Lissajous patterns the above will make sense, and if you don't, then forget it as I couldn't possibly explain it.
PERFORMANCE
Some of the performance characteristics of the unit I built are shown in Fig. 8. They are not great. Furthermore, if you build your copy of the design, yours might be worse. But are the deficiencies relevant? Let's look at the competition to help us decide.
What is the frequency of a 1/3 octave pink noise source? Hard to say. What is the distortion of a 1/3 octave pink noise source? Well, you might consider harmonics as out-of-band signals, in which case the warbler is better than most 1/3 octave pink noise sources. In short, my claim is that the warbler is best judged by the way it performs, and my opinion is that it does that rather well.
Fig. 9 shows the results of a typical measurement. I took it in my listening room using an inexpensive electret microphone. I make no claims for the speaker system being measured: it was an experiment. The top curve is the loud speaker frequency response as measured using a pink noise source and a 1/3 octave filter (Fig. 1C). The bottom curve was taken using the warbler (Fig. 1D).
The bottom curve is not very pretty, but it is nearer the truth.
The peaks and valleys only hinted at in the upper trace are stark naked in the lower trace. One reason for this is the limited Q (broad skirts on the response) of the 1 / 3 octave filter used for the upper curve, which tends to average peaks and valleys. Both curves show a deficiency in the 1.5- to 5kHz region. Some of the resonances measured, such as the one at 170Hz, are due to the room and are apparent to the ear. In short, the warbler works, and it works better than an inexpensive 1/3 octave pink noise system.
BENEFITS
Using the warbler reveals an unexpected benefit. It can audibly disclose peaks in the frequency response of a loudspeaker in a distinctive way. The ear seems to hear a peak in frequency response as a sort of honking noise that repeats with the sweep rate.
Listening to the warbler can also be deceptive. It has significant amounts of higher order odd harmonic distortion. In many cases the ear is much more sensitive to these distortion terms than it is to the fundamental. Thus the listener might conclude that the loudspeaker is rotten, when the fault lies in the signal generator.
However, this problem won't affect the measurements taken with a microphone.
Incidentally, all the function generators that I've ever used have this problem.
It's time to review. The problem attacked was that of room reflections affecting loudspeaker measurements. A particular type of generator, called a warbler, was proposed to alleviate the problem. Design, construction, behavior and application of the Warbler followed.
But one little problem remains that I've been saving for the last. At some frequencies the warbler sounds much like some police sirens. If you build one, best advise your neighbors, or they might wonder why the police seem to always be screaming up to your house.
References
1. William B. Snow, 'Loudspeaker Testing in Rooms.1 Journal of the Audio Engineering Society., Jan. 1961, Vol. 9, # 1, pp. 54-60.
2. ---, Reference Data for Radio Engineers, 6th Ed., 1975, pp. 37-11 thru 37-17. Howard W. Sams Co.
3. G.A. Briggs, Loudspeakers, 1958, Rank Wharfedale, Ltd., pp. 273-283.
4. Walter G. Jung, IC Op Amp Cookbook, Howard W. Sams Co., pp. 378-382.
5. ----, Linear and Integrated Circuits Applications, Texas Instruments, Inc., 1974, p. 72.
--------
Also see:
Issues of Reliability and Validity in Subjective Audio Equipment Criticism, by Lawrence L. Greenhill, M.D. Scientific techniques which might improve listening tests.
The NPQR, Revisited by David Ross -- Further explorations into drone speaker cones.