Manufacturer's Specifications:
System Type: Tower-style, three way, acoustic suspension.
Drivers: Dual 8-in. (20.3-cm) cone woofers, 6 1/2-in. (16.5-cm) cone mid-range, and 1-in. (2.54-cm) soft-dome tweeter.
Frequency Response: 40 Hz to 20 kHz, ±3 dB.
Sensitivity: 90 dB SPL at 1 meter for 2.83 V rms.
Crossover Frequencies: 400 Hz and 3 kHz.
Impedance: 8 ohms nominal.
Recommended Amplifier Power: 15 to 150 watts per channel.
Dimensions: 42 1/2 in. H x 10 1/4 in. W x 12 1/8 in. D (108 cm x 26 cm x 30.8 cm).
Weight: 65 lbs. (29.5 kg).
Price: $1,200 per pair in walnut veneer, $1,000 per pair in black ash vinyl.
Company Address: 70 Broadway Lynnfield, Mass. 01940.
Whatever happened to the "East Coast sound"? It's alive and doing well at loudspeaker manufacturer Boston Acoustics in Massachusetts. The "East Coast sound" has traditionally described a speaker whose tonal qualities emphasized a neutral, flat response with minimal emphasis of any particular frequency range. Fortunately, regional differences in the sound and tonal balances of loudspeakers are nearly nonexistent now. Most manufacturers now produce or at least profess to produce systems that meet the traditional meaning of the term.
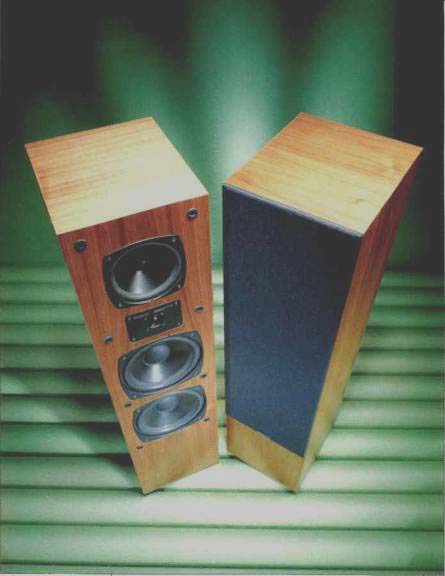
The T1030 is the recently introduced top model from Boston Acoustics' three-product "tower series" of three-way speaker systems. It is a somewhat large, floor-standing system containing two 8-inch woofers, a 6 1/2-inch midrange, and a 1-inch dome tweeter. The rest of Boston Acoustics' home speaker line consists of five bookshelf systems, five in-wall speakers, a powered subwoofer, and a three-piece satellite/woofer combination (the SubSat Six).
Andy Petite, president and chief designer of Boston Acoustics, has been in the loudspeaker manufacturing business since 1964, when he started at KLH. (My first systems of any merit were KLH-6s, which I still have.) Later he was at Advent, for nine years starting in 1969, where he was involved with the whole Advent speaker line and was sole designer of the New Advent and the Advent/1, which came out in 1977. At Advent, he worked with Henry Kloss, one of the founders of Acoustic Research, where the first speakers with the "East Coast sound" originated.
In 1979, Petite and Frank Reed (formerly vice president of sales at Advent) co-founded Boston Acoustics, where they have tried to maintain the tradition of making speakers with high performance for their price. One of Boston Acoustics' best-selling speakers, the A40, was reviewed by Richard C. Heyser in the July 1983 issue.
According to Petite, the goal for the T1030 was to make a system for home use that could compete on a sonic basis against any speaker at any price and to do so in a sensibly sized and priced package. A tall order indeed! The tower format was chosen for the T1030 because of its small footprint and the predictable relationship it establishes between the drivers and the floor. It also puts the midrange and tweeter at ear level, for best coverage. A vertical stack of two 8-inch drivers, each in its own sub-enclosure, is used for the low end of the system. This combination, which has roughly the same air-moving capabilities as a 12-inch woofer, minimizes width and provides better vertical directivity, which reduces troublesome floor reflections.
Boston Acoustics manufactures all of their own drivers and thus, they claim, can maintain much tighter control over manufacturing and performance. Petite states that every driver matches its own reference within ± 1 dB (and likewise for the finished systems), which is a much tighter tolerance than any outside supplier provides.
The high-excursion woofers have a voice-coil 1 1/2 inches in diameter that is 0.75-inch long operating in a 0.236-inch gap. A vented pole piece provides cooling, and a shorting ring in the magnetic structure reduces distortion resulting from flux modulation. The midrange uses a Ferrofluid cooled, 1-inch coil and is housed in a separate, sealed tubular enclosure, filled with damping material, which also acts as a front-to-back brace in the top of the cabinet. The wall between the two woofers provides more enclosure bracing. The 1-inch, soft polyamide dome tweeter is Ferrofluid-cooled and is flush-mounted to minimize diffraction.
Mounting the midrange over the tweeter provides a listening window that is tilted upward, which minimizes changes in tonality for seated and standing listeners. The midrange is large enough to permit a relatively low crossover point of 400 Hz, so that the midrange frequencies really come from the midrange driver.
The T1030s are finished on five sides and are available in walnut veneer or black ash vinyl (for $200 less); both versions have black grilles. The molded plastic grille is fitted to the front panel using eight projections which fit into rubber-lined holes. Removal and replacement of the grille was quite easy and occurred without any alignment problems. The build quality and finish of the systems were very good. The bottom of the enclosure has four threaded inserts installed to attach feet or floor spikes, which are supplied.
The rear bottom input connectors are two pairs of quite substantial gold-plated metal binding posts on 0.75-inch centers, worthy of any high-end system. The connectors are recessed at an angle and can be manipulated without much difficulty. A pair of gold-plated straps can be removed for bi-wiring. The manufacturer recommends against bi-amplifying, however, because an external crossover would probably eliminate the proper acoustic summing caused by the internal crossover's broad, gradual overlap between the woofer and midrange. This, Boston says, would create a dip in the response and change the sound adversely.
Measurements
Measurements performed on the T1030 to evaluate its performance included on- and off-axis frequency response, energy/time curves, impedance versus frequency, harmonic and IM distortion, and maximum .peak input and output capabilities. The system was also evaluated using elevated free-field, near-field, and ground-plane measurement methods in my own listening room and lab, and outdoors. Test equipment consisted of a Techron TEF System 12 Plus Time-Delay Spectrometry (TDS) analyzer, B & K 4007 con denser microphone, Crown Macro-Tech MA-2400 and D-75 power amplifiers, and Leader signal generators, attenuators, voltmeter, and oscilloscope.
The tilt of the system's reference axis, about 8° up from the midrange/tweeter midpoint, is about halfway between the angles for a seated listener (+1°) and a standing listener 3 meters away ( + 14.5°). This raised a crucial question:
Should I define on-axis as being an 8° up angle or should I measure this system, as I have most of the previous systems, using an approximate 0° angle from a point midway between the midrange and tweeter? This is a significant question for the T1030 because it was found that the response through the crossover region is somewhat smoother at 8° up than it is at 0°. I finally decided on using an angle of + 1°, arguing that this is the angle of the axis that is aimed toward the ears o' a seated listener when the system is set up in its normal upright position. This choice places much more importance on the response for the seated listener than for the standing listener, as it ought to. If the manufacturer's recommended setup included an 8° forward tilt (which it didn't), I would be much more justified in using the 8° up-angle as the on-axis direction. Of course, the ideal system would have the same response for seated and standing listeners, making these considerations moot.
The on-axis frequency response, with and without grille, is shown in Fig. 1. The measurement was taken at a distance of 2 meters at an angle corresponding to the direction of the ears of a seated listener 3 meters way. The angle is about 1° above a line originating from a point midway between the tweeter and midrange. The response is reasonably well behaved and fits a ±3.5 dB window from 48 Hz to 20 kHz, quite close to the manufacturer's specifications. The curve has some roughness and a slight depression in the cross over region from 2 to 6 kHz (partially due to the reference axis I chose), with a low-Q peak centered at 16 kHz.
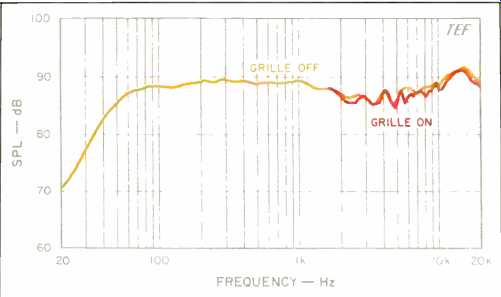
Fig. 1--On-axis frequency response. Also shown is the response with grille,
which caused minimal effect.
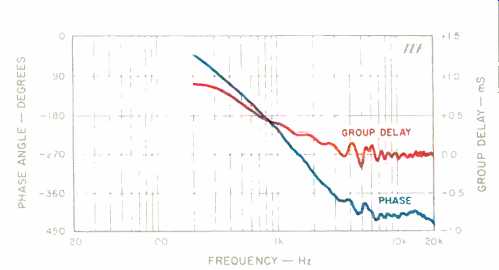
Fig. 2--On-axis phase response and group delay, corrected for tweeter arrival
time.
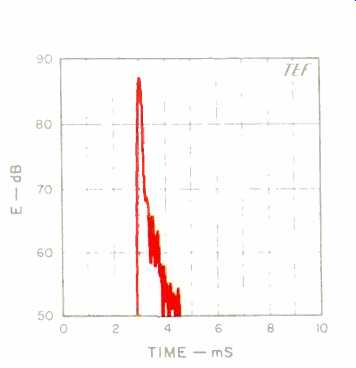
Fig. 3--One-meter on-axis energy time curve.
Averaging the axial response over the range from 250 Hz to 4 kHz yielded a sensitivity of 88.5 dB SPL, 1.5 dB lower than the manufacturer's rating of 90 dB. The slight depression in the response at the upper crossover region contributed to the lower measured sensitivity. The grille has mini mal effect on the axial response, no more than about 1 dB maximum variation. The maximum deviation of about -2 dB occurred in a narrow, sixth-octave range centered at 5.7 kHz. The right/left matching of the systems was excellent, with no more than ±0.5 dB variation above 100 Hz. This should be compared with the repeatability of my test setup, which is about ±0.1 dB. All the following measurements were taken with the grille off.
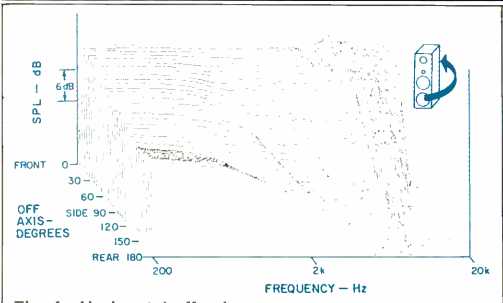
Fig. 4--Horizontal off-axis frequency responses, taken from the front, around
the side, and to the rear of the speaker, normalized to the on-axis response;
see text.
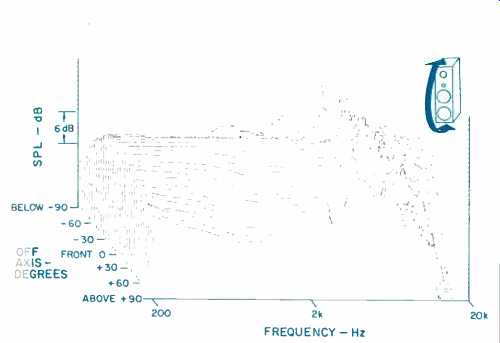
Fig. 5--Vertical off-axis responses, taken from below, up the front, and
to the top of the speaker, normalized to the on-axis response. Note that
the above-axis response is at the front of the display. A significant amount
of roughness in the crossover region (2 to 4 kHz) is evident.
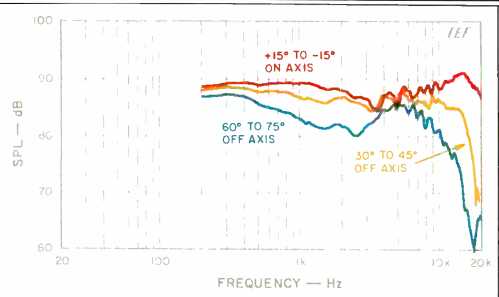
Fig. 6--Mean horizontal response, derived from data of Fig. 4. The axial
and 30° to 45° off-axis curves are reasonably flat and well behaved.
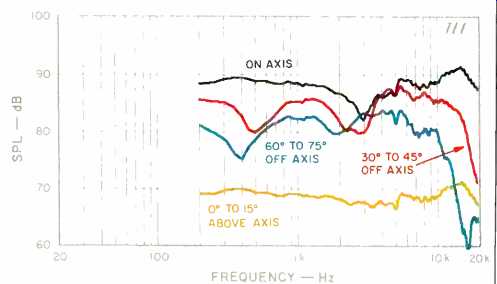
Fig. 7--Mean vertical response, derived from data of Fig. 5. Also shown
is a response average extending from 0° on axis to 15° above axis, which
includes both seated and standing listeners. This response is commendably
flat and extended; its curve has been lowered 20 dB for clarity.
Figure 2 displays the axial phase and group delay of the system, corrected for the tweeter's time arrival. The phase response exhibits a modest amount of total phase rotation, about 210° between 1 and 20 kHz. A separate measurement of offset indicated that the midrange trails the tweeter by about 0.14 mS (140 mS), which corresponds to an offset distance of 1.9 inches. At the crossover of 3.0 kHz, this offset represents approximately 0.42 wavelengths, or 161° of phase.
The excursion capability of the woofers was determined by sweeping with a high-level sine wave covering the low frequency range. The maximum linear excursion capability of the woofers was a healthy ± 0.25 inch (0.5 inch, peak to peak), while the limiting excursion (high distortion) was significantly higher at about ±0.4 inch (0.8 inch, peak to peak). The effective piston diameter of a single woofer was about 6 3/4 inches, and thus two woofers are about the same size as a single driver 12 inches in diameter. The upper woofer of each system exhibited slight ticking sounds at levels above 15 V rms at 50 Hz. A finger touch of the surround would either worsen or reduce the ticking, de pending on where the surround was touched (a slight voice coil rub?). During these sine tests, the enclosure side walls were quite rigid and displayed no significant resonances.
The crossover consists of 11 parts (three inductors, four capacitors, and four power resistors), wired on a piece of hardboard and attached to the rear of the cabinet in the top sub-enclosure. The woofer section is a second-order low pass filter (12 dB/octave), the midrange a 6-dB/octave high pass and a 12-dB/octave low-pass, and the tweeter section a second-order high-pass network (12 dB/octave). The inductors for the midrange and tweeter are small air-core units, while the large woofer inductor is a laminated iron-core unit wound with 16-gauge magnet wire. The three capacitors in the woofer and midrange sections are nonpolarized electrolytics, while the tweeter high-pass capacitor is a Mylar type. The internal cabling is done with 18-gauge stranded wire.
The crossover phase relationships were investigated by reversing the midrange connections and then noting the amount of rejection at the crossover frequencies. The lower crossover exhibited a dip of about 18 dB, which indicated that the woofers and midrange are essentially in phase at their crossover point. The response at the 3-kHz crossover disclosed a dip of only about 8 dB, which indicated that the midrange and tweeter are somewhat out of phase in their crossover region and thus will exhibit some lobing error. As noted before, the midrange is mounted over the tweeter in order to launch the resultant crossover lobe in the upwards direction.
The 1-meter, on-axis, 1-watt energy/time response (ETC) is shown in Fig. 3 for a test signal swept over the range of 200 Hz to 10 kHz. This ETC represents mostly the tweeter's response and emphasizes energy in the range of 2 to 9 kHz.
The response is notably tight and followed only by lower level arrivals which are more than 20 dB down from the main arrival.
The normalized horizontal "3-D" axis curves of the T1030 are shown in Fig. 4. The curves are, in general, well behaved but indicate off-axis roughness in the upper cross over region. The normalization actually makes the off-axis response curves somewhat rougher because the on-axis curve is rough through the crossover response range. The response holds up well out to 16 kHz, up to about 30° off the system's axis.
The vertical off-axis curves in Fig. 5 also indicate significant roughness through the upper crossover region of 1.5 to 6 kHz. Not shown in this display is a large dip in the response at 3 kHz, just below the axis, that indicates a sizable amount of lobing error. Fortunately, the response through this frequency region is much smoother above axis than below, as will be shown later.
The NRC-style mean horizontal and vertical on-and off-axis response curves of the system are shown in Figs. 6 and 7. These responses were derived from the previous "3-D" data by calculating response averages of several adjacent curves in specific on- and off-axis angular regions.
The mean horizontal response curves are shown in Fig. 6.
The mean axial horizontal response curve exhibits the same depressed, somewhat rough response between 2 and 6 kHz, and the same response peak at 16 kHz, as the axial curve shown in Fig. 1. This curve represents the average frequency balance within ±15° of the axis horizontally, but on axis vertically. The 30° to 45° response is quite flat and fits in an envelope of ± 2.25 dB from 100 Hz to 13 kHz. The 60° to 75° response exhibits a broad slump between 1 and 3 kHz and a rapid fall-off above 8 kHz. The fairly smooth, extended horizontal responses out to 45° off axis indicate that the T1030s should produce good stereo images over a fairly broad horizontal listening area.
The mean vertical responses are shown in Fig. 7. The mean axial response is also very similar to the on-axis response in Fig. 1 but has a deeper hole at 3 kHz because the severe response dip just below axis is included in the ± 15° average. Also shown in Fig. 7 is an average of the responses from only 0° to 15° above axis, which includes both seated and standing listeners. This response is considerably smoother and fits within an envelope of ± 2.5 dB from 200 Hz to 20 kHz. The data indicates that the system might benefit from a slight forward tilt of the enclosure to optimize the vertical coverage.
The 30° to 45° averaged response displays the effects of both low-to-mid and mid-to-high crossovers, with dips in the response at both 500 Hz and 2.5 to 3 kHz. A vertical stack of two 8-inch woofers has a narrower vertical radiation pattern in the range from 400 to 500 Hz than the equivalent 12-inch woofer does, and this causes a greater dip in the response.
The 30° to 45° response does extend up to about 15 kHz before falling rapidly at higher frequencies.
The 60° to 75° averaged response displays even more directivity in the low-frequency range, as well as a rapid roll-off above 10 kHz. The increased low-frequency directivity of the stacked woofer array is quite beneficial in this situation because it decreases potentially harmful ceiling and floor reflections.
Figure 8 shows the magnitude of impedance versus frequency of the T1030. The curve is quite well behaved and smooth except that it reaches a rather low minimum of 3.4 ohms at 100 Hz. Because the minimum is in the upper bass range, where program material typically has high power content, the speaker should be considered a 4-ohm system for practical purposes. With two of these systems paralleled, some amplifiers may not perform very well if played at loud levels on program material with a lot of power in the range from 50 to 200 Hz, such as rock music.
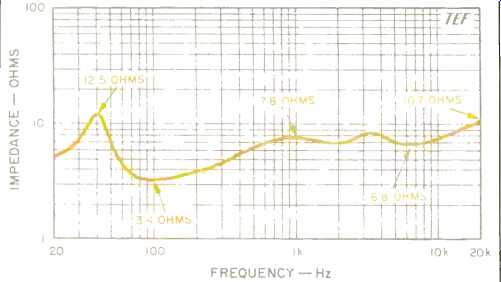
Fig. 8--Magnitude of impedance; note the logarithmic impedance scale. Even
though the impedance is rated at 8 ohms, a rather low value of 3.4 ohms is
reached in the upper bass range.
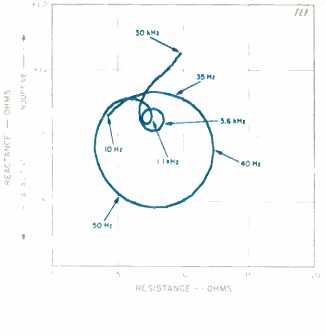
Fig. 9--Complex impedance, showing reactance and resistance vs. frequency.
The curve is quite well behaved.
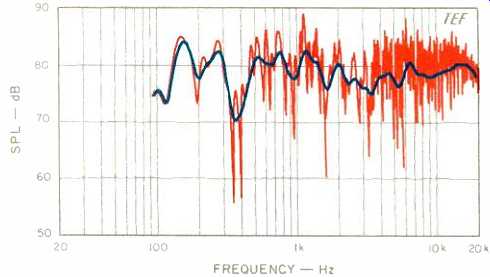
Fig. 10--Three-meter room response, showing both raw and smoothed data;
see text.
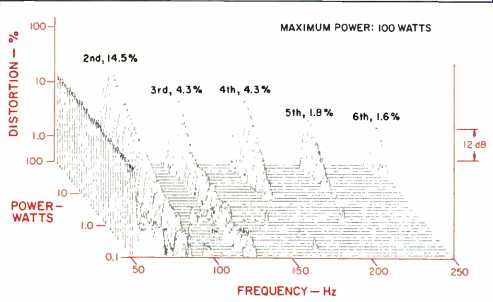
Fig. 11--Harmonic distortion products for the musical tone E1 (41.2 Hz).
At the highest power shown, the system generates roughly 100 dB SPL for the
fundamental at 1 meter.
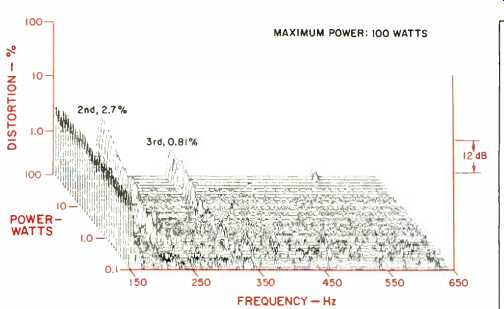
Fig. 12--Harmonic distortion products for the musical tone A2 (110 Hz).
At the highest power shown, the system generates roughly 105 dB SPL for the
fundamental at 1 meter.
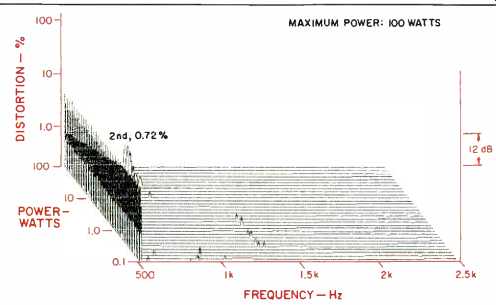
Fig. 13--Harmonic distortion products for the musical tone A4 (440 Hz).
At the highest power shown, the system generates roughly 106 dB SPL for the
fundamental at 1 meter. Distortion is very low.
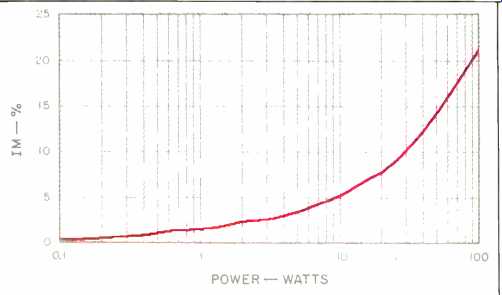
Fig. 14--IM distortion on 440 Hz (A4) produced by 41.2 Hz (E1) when mixed
in one-to-one proportion.
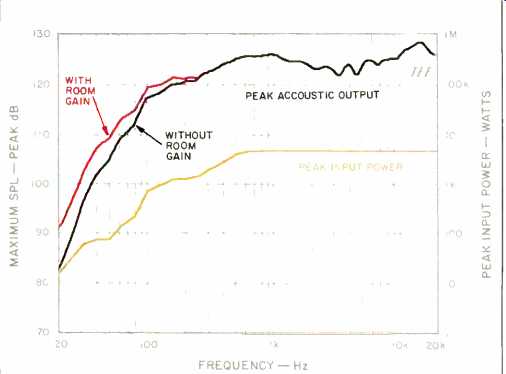
Fig. 15--Maximum peak input power vs. frequency (lower curve), and maximum
peak sound output (upper curve), measured at 1 meter on axis, for the input
levels shown in the lower curve; see text. Also shown is the effect of low-frequency
room gain on the maximum output curve.
Figure 9 is a plot of the complex impedance of the 11030, showing how the resistance and reactance vary with frequency. This plot is also quite well behaved and indicates that the system has no irregular resonances except for the expected crossover features. The large circle is the 40-Hz fundamental closed-box resonance of the system.
Figure 10 shows the 3-meter room response of the system with both raw and sixth-octave smoothed responses. The speaker was located in the right stereo position, with the test microphone placed at ear height (36 inches) on the sofa where the listener normally sits. The system was swept from 100 Hz to 20 kHz with a 2.83-V rms sine-wave signal. The sweep parameters were chosen so that the direct sound plus 13 mS of the room's reverberation was included. The resultant sound levels can be read directly off the graph.
The curve is generally well behaved and extended except for some moderate roughness and a dip in the response near 400 Hz. An emphasis was noted in the upper bass response between 140 and 300 Hz and in the midband from 500 to 1,500 Hz. A separate 3-meter curve with the micro phone at the ear height of a standing listener (64 inches, my ear height, curve not shown), raised the level somewhat in the crossover region from 1.5 to 6 kHz and significantly smoothed the response.
Harmonic and intermodulation (IM) distortion were measured and are displayed in four graphs. Figures 11, 12, and 13, respectively, show the spectra of single-frequency harmonic distortion versus power level at the musical notes of E1 (41.2 Hz), A2 (1 10 Hz), and A4 (440 Hz). These curves indicate the level of harmonic distortion that is generated by the system with the application of a single-frequency sine wave at power levels covering the range of 0.1 to 100 watts (- 10 to 20 dBW, a 30-dB dynamic range) in steps of 1 dB.
The power levels were computed using my suggested 4-ohm impedance rating.
Figure 11 shows the E1 (41.2-Hz) harmonic distortion data. Maximum power was limited to 100 watts, which is 20 V rms into a 4-ohm load. (At 24 V rms and above, both systems' woofers generated extraneous noises.) The non-harmonically related spikes, at lower power levels, are due to background noise in the measurement setup and were not generated by the loudspeaker. As with other systems I have measured, at lower power levels the second and third harmonics are evident, while at higher power levels the fourth, fifth, and sixth harmonics join the lower ones. The second harmonic is seen to predominate over the whole power range, which indicates a one-sided nonlinearity. Note that this system generates roughly 100 dB at 1 meter with 100 watts at 41 Hz. These distortion percentages, though not the lowest, are reasonable considering the size of the woofers.
The A2 (110-Hz) harmonic data is shown in Fig. 12. The graph shows that only the second and third harmonics were significant over the tested power range. The second harmonic increases gradually with power, reaching a level of only 2.7% at 100 watts. The third harmonic, which was significantly lower, reached only 0.8% at full power.
The A4 (440-Hz) harmonic measurements are shown in Fig. 13. The only measurable distortion was a low amount of second harmonic, which peaked at 0.72% at 100 watts. All other distortion products were below the floor of the display, which was about 0.2%! Figure 14 shows the IM distortion on a 440-Hz (A4) tone created by an equal-level (input power, not output acoustic level) 41.2-Hz (E1) tone. The IM distortion gradually rises with power, reaching the fairly high level of about 22% at 50 watts. The first-order (f2 ± f1) and second-order (f2 ± 2f1) side frequencies were the only significant ones in this power range. These IM levels are higher than they could be because the midrange is operated quite low in frequency, with only a first-order 6-dB/octave roll-off below the crossover frequency. In the "rub and buzz" test it was noted that the midrange had significant displacement below 100 Hz at high levels.
Figure 15 shows the system's short-term peak-power in put and output capabilities as a function of frequency. The tests were run by exercising the system with a high-level, shaped, 61/2-cycle sine-wave tone burst at all the third-octave points from 20 Hz to 20 kHz, using an amplifier with very high peak-power capability. The test sequence consisted of determining how much of the burst test signal could be handled by the speaker, at each frequency, before the output sounded audibly distorted or the acoustic output waveform appeared distorted, whichever occurred first. At each frequency, the maximum peak input voltage was re corded and the output level calculated using the 1-watt, 1-meter response data.
The maximum peak electrical input power-handling capacity of the T1030 is shown in the lower curve of Fig. 15.
The rated impedance of 8 ohms was used to calculate the input power. The peak input power-handling capacity rises with frequency throughout the bass range, reaching a plateau of 4.5 kW above 500 Hz, which is close to the clipping power of the test amplifier. Some limitation of input power was noted between 40 and 63 Hz due to the woofers making slight ticking sounds. No dynamic offset problems were observed in the woofers' range. The system can actually handle more power than the curves show but at the expense of much greater distortion and possible risk of damage at higher frequencies.
The upper curve in Fig. 15 illustrates the maximum peak sound pressure levels the system can generate at a distance of 1 meter on axis for the input levels shown in the lower curve of Fig. 15. Also shown on the upper curve is the maximum output with the "room gain" of a typical listening room added at low frequencies. This adds about 3 dB to the response at 80 Hz and 9 dB to the response at 20 Hz. With room gain, a single system can generate peak levels in excess of 110 dB above 50 Hz and 120 dB above 100 Hz.
Though not in the subwoofer class, these levels are quite respectable. A pair of these systems operating with mono bass will be able to generate higher levels of some 3 to 6 dB in the bass range.
Use and Listening Tests
All listening was performed in my listening room, which has dimensions of approximately 15 1/2 x 27 x 8 feet. The room has normal living-room furnishings and a carpeted floor. Equipment used for listening included an Onkyo Grand Integra DX-G10 CD player, a Rotel RCD855 CD player, a Krell KSP 7B preamp, a Krell KSA 200B solid-state power amplifier, and Straight Wire Maestro interconnects and speaker cables. The Boston Acoustics systems were hooked up conventionally, without bi-wiring. As usual, the majority of my listening was done before the measurements were made.
Most of the listening was done with the T1030s placed in my normal evaluation position, about 6 feet away from the short rear wall, and separated by 8 feet. This left a spacing of about 4 feet from the side walls. The systems were aimed horizontally at my normal listening position so that I was on the midrange/tweeter axis of the system. Listening took place on the sofa, about 10 feet away.
My first impressions of the T1030s were very positive. The tonal balance was quite even, with just a hint of very high frequency emphasis. The systems could be played quite loudly without any stress, while the bass response was extended and full but with some upper bass heaviness.
Vertical coverage was quite adequate and did not exhibit any consequential midrange tonal changes between seated and standing listener positions. Imaging and soundstaging were stable and precise, exhibiting no wandering images with changes in the frequency content of the instruments.
On Bob Mintzer's Big Band disc, Incredible Journey (dmp CD-451), the systems could be turned up to realistic levels with minimal stress on the loud horn passages. Tracks 4 and 8 were particularly good. On a new CD I recently received of Brazilian arrangements of piano and guitar music (The New York Chorinhos by David Chesky, Chesky JD39), the T1030s demonstrated excellent presence and soundstaging and delineated very well the delicate fingering sounds on the guitar. The loud piano intro on track 13 was managed without any harshness.
Boston Acoustics has been running a promotional campaign featuring the "Up Close" series of CDs available by mail order for about $3.00. (I'm a sucker for a $3 CD!) I recommend heartily Volumes 1 and 3. Volume 1 features an Irish male vocalist and guitarist doing what you might call "minimalist" rock and roll, with just one man and one amplified acoustic guitar (Luka Bloom, Up Close, Volume 1, Reprise PRO-CD-3960; selected songs from the Reprise album Riverside 26092-1). Track 2, "Delirious," was re created by the T1030s with much presence and excitement, clearly revealing the four separate voices in Bloom's guitar.
The systems, however, emphasized the upper bass of the guitar a bit more than my reference B & W 801 speakers.
Volume 3 of the "Up Close" series presents Andy Narell, who uses steel drums in contemporary jazz arrangements (Andy Narell, Up Close, Volume 3, WD90-04; selected songs from the Windham Hill CD, Little Secrets, WH-0120).
All the songs are of demo quality, and the T1030s did a superb job on the complex percussion passages. The re production was, however, somewhat less open than my reference systems'.
The T1030s presented a good, solid, stable center image on the blues vocal and harmonica of Taj Mahal (track 1 of The Best of Taj Mahal, Columbia CK 36258). The rock and high-level capabilities of the systems were demonstrated very gratifyingly (and loudly) on track 13 of the All-Ears Review, Volume 1 CD, where an obscure West Coast group named Crazy-Backwards Alphabet performs a Russian-language version of the ZZ Top hit "La Grange" (All-Ears Review, Volume 1, ROM Records 21001).
Reproduction of the band-limited third-octave noise on the B & K test disc held up to below 31 Hz with very usable levels (Bruel & Kjaer Pro Audio, CD-4090). Its output was only exceeded on the 20- and 25-Hz bands by the reference B & W 801s. The T1030s actually did better than my reference systems on the difficult passage of the organ version of Pictures at an Exhibition that made my reference systems stumble, as noted in the B & W 801 review in the November 1990 issue (Dorian DOR-90117, track 15 at 3:41 and 3:44, played loud!). The T1030s came quite close to my reference systems in handling the very demanding cannon shot on Tchaikovsky's "1812 Overture" (Sampler, Volume II, Telarc CD-80002). These systems will satisfy bass freaks! The T1030s handled the contrabass and pipe organ selections on the d'Albinoni CD with much presence, air, and realism (Adagio d'Albinoni, King Record Co. LTD. K33Y 236, a Japanese import, highly recommended if you can find it; if you can't, it is available from Acoustic Sounds in Salina, Kans., 800/525-1630). The systems were quite clean on massed vocals in Handel's Messiah (The Erato Autumn Collection sampler, Erato 45580-2, a German import).
I am very pleased with the performance of the T1030 speakers, especially when their price is considered. The systems provide about 90% of the performance of my reference systems but for about 20% of the cost. They also take up much less floor space and, in my opinion, are more acceptable in appearance. Everything considered, the speakers should appeal to anyone who wants good value for the money and near high-end performance in a package of sensible size. I believe the goal stated earlier in this review by the founder of Boston Acoustics has been well met.
-D. B. Keele, Jr.
(adapted from Audio magazine, Jan. 1991)
Also see:
Link | --Boston Acoustics A40 Speaker (July 1983)
Cambridge Physics Model 310 Loudspeaker (Nov. 1982)
Bright Star Altair Speaker (Jul. 1992)
= = = =